Table of contents
Facebook video ads are paid video placements bought through Meta Ads Manager and delivered across the Facebook feed, Reels, Stories, in-stream breaks and the Audience Network — sold on the same auction as static ads but judged on watch behaviour as well as clicks.
This guide covers the specs that matter per placement, the creative patterns that keep winning, worked examples by business type, real cost benchmarks and the watch-through metrics that predict whether an ad will scale.
Key Takeaways
- 91% of businesses now use video as a marketing tool and 93% of video marketers call it important to strategy, so video is the default ad format on Facebook rather than an experiment.
- Vertical wins: build the master cut at 4:5 for feed and export a 9:16 version for Reels and Stories rather than uploading one 16:9 file everywhere.
- The average Facebook traffic-campaign click-through rate is 1.71% at an average $0.72-$1.22 cost per click depending on industry.
- Restaurants and food advertisers average 1.67% CTR and $0.72 CPC; finance and insurance sits lowest at 0.98% CTR.
- Hook the viewer in the first 3 seconds and land the value proposition before second 10 — most drop-off happens before the halfway mark on any cut longer than 30 seconds.
- Ship 3 to 5 genuinely different concepts per test, not five edits of the same concept, and judge them on hook rate and cost per result together.
- Organic Facebook engagement now averages 0.15%, with Reels the strongest format — paid distribution is how video reaches scale on the platform.
- 63% of video marketers have used AI video tools, up from 51% a year earlier, which has collapsed the cost of producing test variants.
- Add captions to every cut: a large share of feed views start muted, and captions are the cheapest single lift available.
- Refresh creative every 2 to 4 weeks at meaningful spend; frequency creep, not the algorithm, is what kills a winning video.

Where Facebook video ads actually run
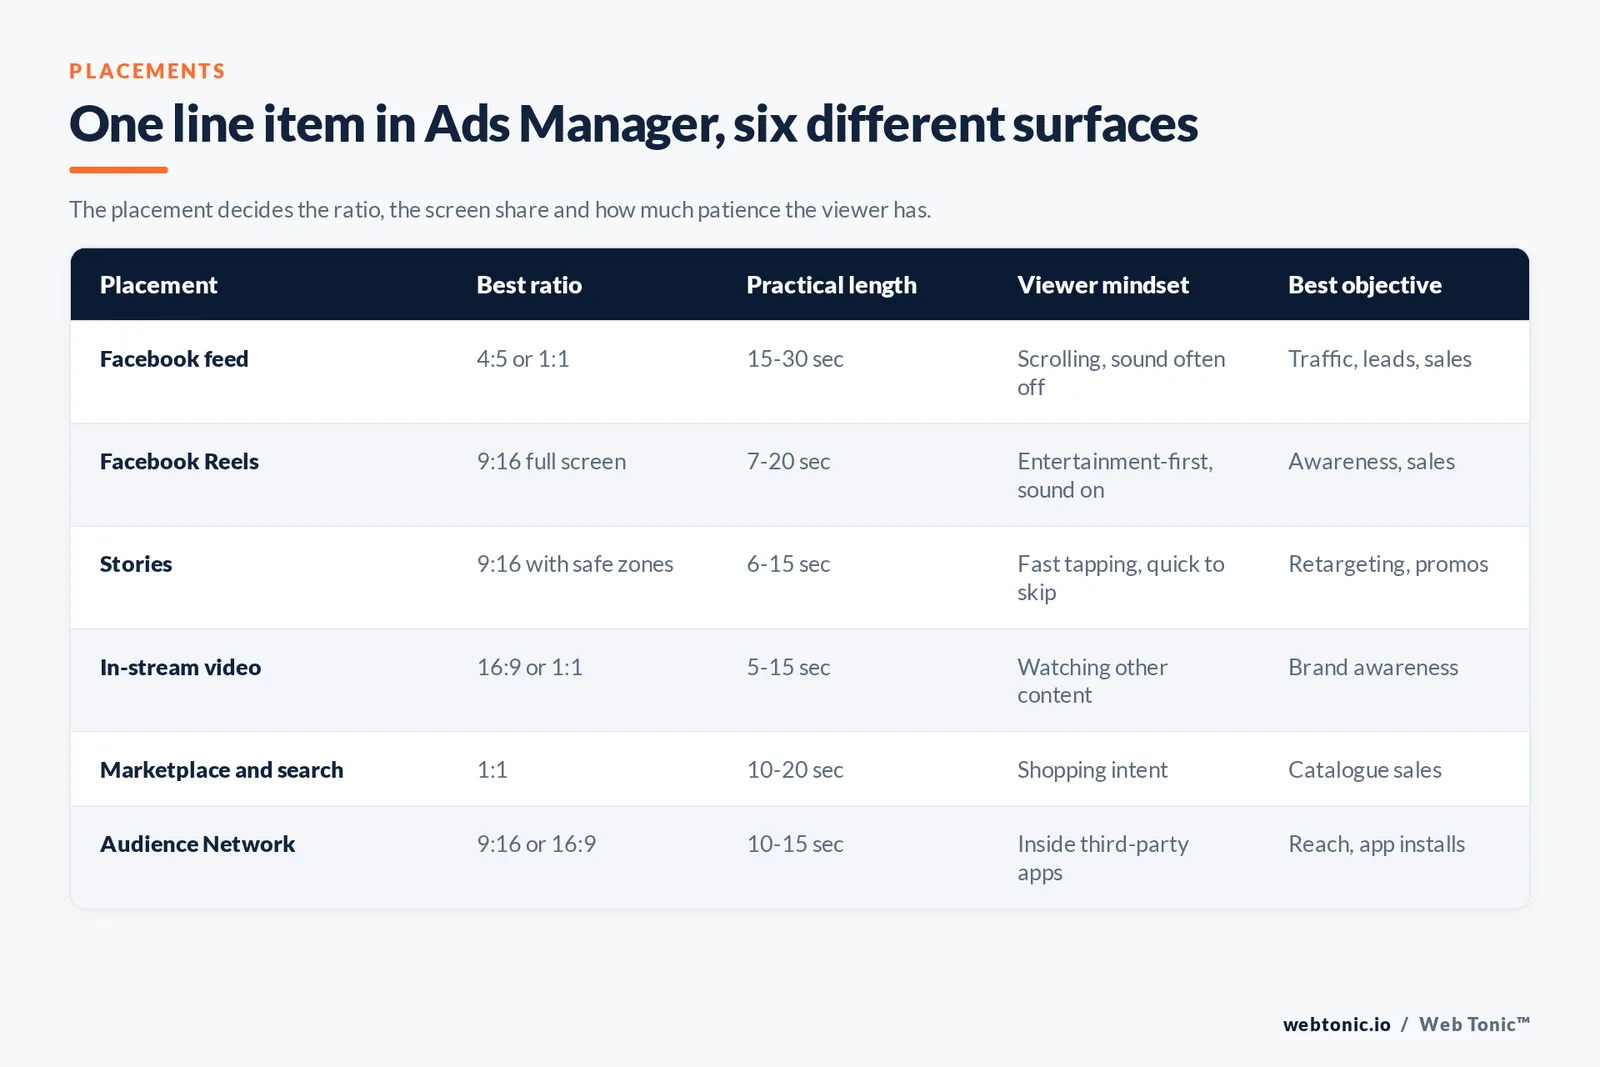
"Facebook video ads" is a single line item in Ads Manager that covers half a dozen visually different surfaces. The placement decides the aspect ratio, the amount of screen the video occupies, and how much patience the viewer has. Treating them as one format is the most common reason a well-made video underperforms.
| Placement | Best aspect ratio | Practical length | Viewer mindset | Best objective fit |
|---|---|---|---|---|
| Facebook feed | 4:5 or 1:1 | 15-30 seconds | Scrolling, sound often off | Traffic, leads, sales |
| Facebook Reels | 9:16 full screen | 7-20 seconds | Entertainment-first, sound on | Awareness, engagement, sales |
| Stories | 9:16 with safe zones | 6-15 seconds | Fast tapping, high intent to skip | Retargeting, promotions |
| In-stream video | 16:9 or 1:1 | 5-15 seconds | Watching other content, sound on | Brand awareness, video views |
| Marketplace and search | 1:1 | 10-20 seconds | Shopping intent | Catalogue sales |
| Audience Network | 9:16 or 16:9 | 10-15 seconds | Inside third-party apps | Reach, app installs |
The practical workflow is one shoot, one master edit, and three exports: a 4:5 feed cut, a 9:16 Reels and Stories cut with the text lifted clear of the top and bottom 14% of the frame, and a square cut for Marketplace. This is the production model our performance creative team uses so a single concept can cover every placement without a second shoot day.
Facebook video ad specs, in plain terms
Meta accepts a very wide range of files, which is exactly why spec sheets mislead people: what the platform tolerates and what performs are different things. The column that matters is the recommended one.
| Attribute | Recommended | Why it matters |
|---|---|---|
| Aspect ratio | 4:5 feed, 9:16 Reels and Stories | Vertical claims more screen on mobile, where the majority of sessions happen |
| Resolution | 1080 x 1350 or 1080 x 1920 | Below 1080px wide, compression artefacts read as low quality |
| Length | 7-30 seconds for direct response | Longer cuts only pay off with genuine narrative or demo value |
| File format | MP4 or MOV, H.264 | Widest compatibility, cleanest compression at upload |
| Audio | Stereo AAC, dialogue mixed loud | Sound-on placements like Reels reward clear voice |
| Captions | Burned-in or uploaded SRT | Feed autoplay is muted by default for many users |
| Primary text | Under 125 characters | Longer copy truncates behind "See more" on mobile |
| Thumbnail | Custom frame, minimal on-image text | Controls what appears before autoplay starts |
| Safe zones | Keep text out of top and bottom 14% | UI overlays cover those bands in Reels and Stories |
Two habits save more money than any spec tweak. Export at the ratio the placement wants instead of letting Meta letterbox a 16:9 file, and never ship a cut whose first frame is a logo card. Nielsen Norman Group's usability research on video is blunt about it: viewers abandon anything that delays the point.
How much Facebook video ads cost
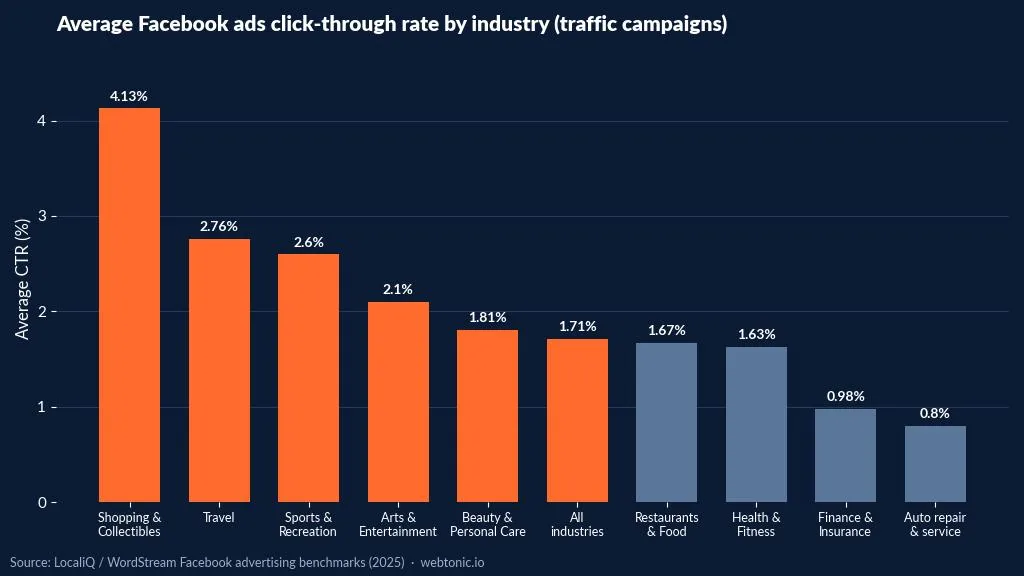
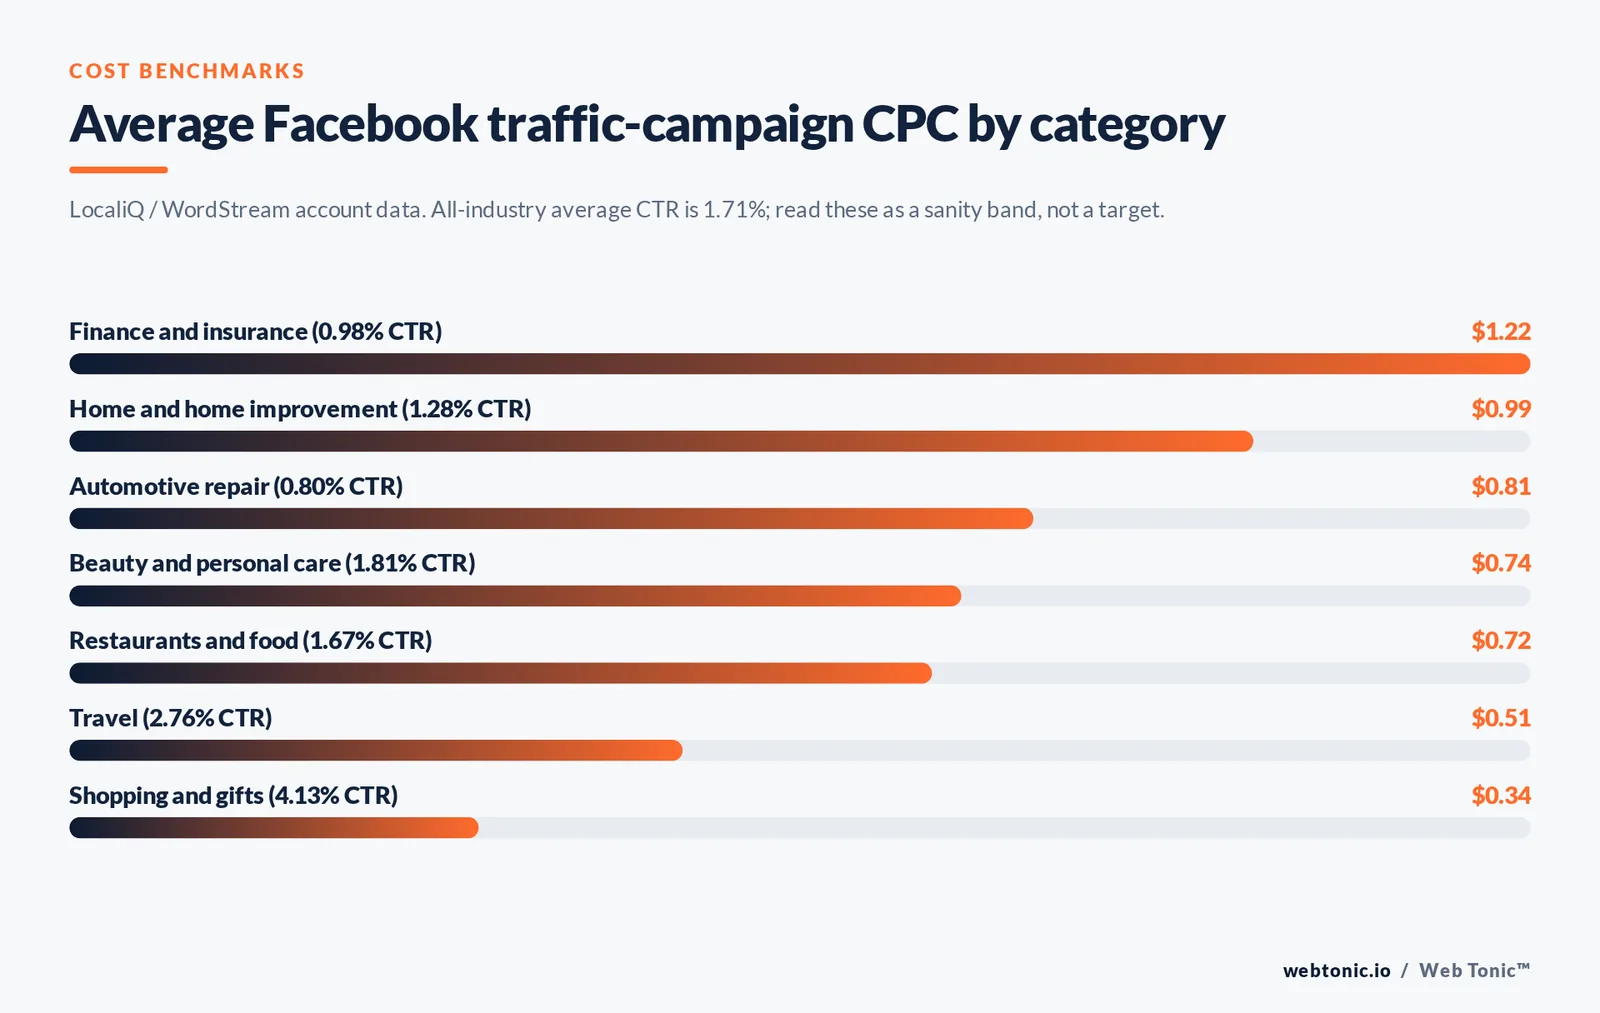
Facebook video ads are priced by auction, so there is no rate card — but there are published benchmarks worth planning against. The figures below come from LocaliQ's Facebook advertising benchmarks, built with WordStream account data for traffic campaigns.
| Business category | Average CPC | Average CTR | What it implies for video |
|---|---|---|---|
| All industries | $0.83 | 1.71% | A 2%+ CTR is genuinely above average |
| Shopping, collectibles and gifts | $0.34 | 4.13% | Product-in-use footage does the selling |
| Travel | $0.51 | 2.76% | Aspirational b-roll still outperforms offers |
| Restaurants and food | $0.72 | 1.67% | Close-up food motion beats storefront shots |
| Beauty and personal care | $0.74 | 1.81% | Before-and-after and UGC formats dominate |
| Home and home improvement | $0.99 | 1.28% | Transformation timelapses carry the hook |
| Finance and insurance | $1.22 | 0.98% | Trust signals and plain-spoken presenters |
| Automotive repair and service | $0.81 | 0.80% | Local proof beats production value |
Read those numbers as a sanity band, not a target. A video ad running at $0.60 CPC in a category that averages $1.22 is not automatically healthy if nothing converts after the click — cost per result is the only metric that pays wages.
The eight video ad formats worth testing
Nearly every high-performing Facebook video ad is a variation on a small number of shapes. Build a rotation from this list rather than inventing a concept each time.
| Format | Structure | Best for | Typical length |
|---|---|---|---|
| 1 — Problem-agitate-solve | Show the friction, twist the knife, present the product | Cold audiences, functional products | 20-30 seconds |
| 2 — UGC testimonial | Real customer, phone camera, unscripted delivery | Ecommerce, apps, services with social proof | 15-30 seconds |
| 3 — Product demo | Hands doing the thing, one benefit per beat | Physical products, software | 12-20 seconds |
| 4 — Before and after | Open on the after, reveal the before, close on how | Home services, beauty, fitness | 10-20 seconds |
| 5 — Founder direct-to-camera | One person, one claim, one call to action | B2B, high-ticket services | 20-40 seconds |
| 6 — Listicle motion graphic | Three to five numbered benefits with kinetic text | Retargeting, feature-rich products | 15-25 seconds |
| 7 — Unboxing or arrival | Package, reveal, first reaction | DTC ecommerce, subscription boxes | 10-18 seconds |
| 8 — Offer-led promo | Deal on screen in second one, urgency to close | Warm audiences, seasonal pushes | 6-12 seconds |
What makes the best Facebook video ads work
Across accounts, the difference between an ad that scales and one that stalls is almost never resolution or edit polish. It is the first three seconds, the clarity of the single claim, and whether the call to action is unmissable. Think with Google's video research and Sprout Social's social video analysis converge on the same point from different data sets.
| Creative lever | What good looks like | Common failure |
|---|---|---|
| Hook (0-3s) | Motion, a face or the problem on screen instantly | Logo sting or slow establishing shot |
| Single claim | One benefit repeated in visual and caption | Four features crammed into 15 seconds |
| Social proof | A real customer voice or a specific number | Generic "loved by thousands" text card |
| Pacing | A visual change every 2-3 seconds | One static shot for the full runtime |
| Captions | Large, high-contrast, inside safe zones | Small grey subtitles behind the UI overlay |
| Call to action | Spoken, captioned and matched to the button | CTA only in the ad copy nobody expands |
| Sound design | Works muted, better with sound | Punchline depends entirely on audio |
| Landing page match | Same offer, same visual, same words | Video promises a discount the page never mentions |
Facebook video ad examples by business type
Rather than a gallery of brand ads you cannot replicate, here is the concept that reliably performs first for each business type, and the one to test against it.
| Business type | First concept to shoot | Second concept to test | Primary metric |
|---|---|---|---|
| DTC skincare | 30-day before-and-after with dated clips | Customer UGC applying the product | Cost per purchase |
| Restaurant or cafe | Slow-motion signature dish, 8 seconds | Owner inviting people in, direct to camera | Cost per reservation click |
| Home services | Timelapse of one completed job | Technician explaining a common fault | Cost per qualified lead |
| Fitness studio | Member story, 6 weeks in | First-session walkthrough to reduce anxiety | Trial sign-ups |
| B2B SaaS | Screen-recorded workflow with voiceover | Founder naming the exact problem | Cost per demo booked |
| Ecommerce apparel | Fit and movement on three body types | Unboxing with fabric close-ups | Return on ad spend |
| Professional services | Answer to the most-asked client question | Case outcome told as a 30-second story | Cost per consultation |
| Local retail | New-arrivals reel shot in store | Staff pick with a reason to visit today | Store visits or clicks |
| Events and ticketing | Last year's crowd energy in 10 seconds | Lineup or agenda as kinetic text | Cost per ticket |
| Education and courses | Two-minute mini-lesson clipped to 20 seconds | Graduate outcome testimonial | Cost per enrolment |
Every one of those concepts can be shot on a phone. Wyzowl's 2026 survey found 59% of marketers make video in-house and 63% have used AI tools to help, so the production-cost excuse has largely disappeared.
The metrics that predict whether a video will scale
Cost per result tells you what happened. Watch-through metrics tell you why, and they tell you within hours rather than days. Set these thresholds in a saved Ads Manager view and diagnose from left to right.
| Metric | How to read it | Healthy signal | What to fix if weak |
|---|---|---|---|
| Hook rate | 3-second views divided by impressions | Above 25-30% | Re-cut the first 2 seconds only |
| Hold rate | ThruPlays divided by impressions | Above 8-10% | Shorten the cut, tighten the middle |
| Click-through rate | Link clicks divided by impressions | At or above 1.71% all-industry average | Make the offer and CTA explicit on screen |
| Cost per result | Spend divided by the optimised action | Inside your target CPA | Audience or landing page, not the edit |
| Frequency | Impressions per person in the window | Under 2.5 per week on cold traffic | Add creative variants or widen targeting |
| Landing page views | Views divided by link clicks | Above 80% | Page speed and mobile layout |
A video with a strong hook rate and a weak cost per result is a targeting or landing-page problem. A video with a weak hook rate is a creative problem, and no bid adjustment will rescue it. That split is the fastest triage available and it is where our growth marketing reviews always start.
Launching a Facebook video ad campaign in seven steps
- Step 1 — Pick one objective per campaign. Sales, leads, or awareness; mixing them inside one campaign starves the smaller signal.
- Step 2 — Confirm measurement before spend. Pixel plus server-side events, and a test purchase or form fill you can trace end to end.
- Step 3 — Start broad on audience. Broad targeting with strong creative now beats 6 narrow interest stacks in most accounts.
- Step 4 — Upload 3-5 distinct concepts in one ad set so the auction can find the winner instead of splitting budget across ad sets.
- Step 5 — Set placements to automatic first, then export placement-native ratios so no surface gets a letterboxed file.
- Step 6 — Give the ad set enough budget to exit the learning phase — roughly 50 optimised events per week is the working benchmark.
- Step 7 — Read results at 72 hours minimum, then act on hook rate first, offer second, audience third.
Five traps that waste Facebook video budget
- Trap 1: Repurposing a 16:9 YouTube ad untouched. It occupies roughly half the screen a 9:16 cut would claim on mobile.
- Trap 2: Judging creative on view counts. 10,000 three-second views with no clicks is a cost, not a result.
- Trap 3: Fragmenting into 8 ad sets with $10 each. Nothing exits learning and every result is noise.
- Trap 4: Testimonial ads with no disclosure. The FTC's disclosure guidance applies to paid creator video too.
- Trap 5: Assuming organic reach will carry the concept. Facebook organic engagement averages 0.15% per Socialinsider's analysis of 25M posts, so paid distribution is doing the work.
Tools for producing and testing video ads
| Job | Practical option | When it is worth it |
|---|---|---|
| Shooting | Modern phone, clip-on mic, window light | Almost always for UGC and demo formats |
| Editing | CapCut, Premiere Pro, DaVinci Resolve | Resolve's free tier covers most ad edits |
| Captions | Auto-caption in the editor, then hand-correct | Every single cut, without exception |
| Hosting and review | Vimeo or a shared drive with timecoded comments | Any approval chain with more than 2 people |
| AI variants | AI voiceover, b-roll and text-overlay tools | Producing 5+ variants of a proven concept |
| Audience research | DataReportal and Pew's social media fact sheet | Before committing to a platform mix |
| Platform changes | Meta's newsroom | Quarterly, to catch format and policy shifts |
FAQ
How long should a Facebook video ad be?
For direct response, 7 to 30 seconds. Reels and Stories cuts perform best at 7 to 20 seconds, feed cuts at 15 to 30. Longer videos only earn their runtime when there is a genuine demo or story to tell, and even then the value proposition should land before second 10.
What is the best aspect ratio for Facebook video ads?
Build the master edit at 4:5 for the feed and export a 9:16 version for Reels and Stories. Square 1:1 is a reasonable single-file compromise, and 16:9 should be reserved for in-stream placements. Letterboxing one horizontal file across every surface is the most common avoidable mistake.
Do Facebook video ads need sound?
They need to work without it and improve with it. A large share of feed impressions autoplay muted, so the claim must be readable through captions and visuals alone. Reels and Stories are far more sound-on, which is why a dedicated vertical cut with clear dialogue usually outperforms a silent one there.
How much do Facebook video ads cost?
Cost is set by auction, but published benchmarks put the average traffic-campaign cost per click between roughly $0.34 and $1.22 depending on industry, with an all-industry average click-through rate of 1.71%. Plan a test budget that can produce at least 50 optimised events per week per ad set, then judge on cost per result rather than CPC alone.
How many video ads should I test at once?
Three to five genuinely different concepts inside one ad set. Different means a different hook and format — a UGC testimonial against a product demo against a before-and-after — not five colour grades of the same clip. Once one wins, produce variants of that concept and retire the rest.
Are Facebook video ads still worth it?
Yes, for most businesses with a clear offer and a working measurement setup. Video is used by 91% of businesses, organic reach on the platform is thin at 0.15% average engagement, and paid video remains one of the cheapest ways to reach a broad audience at scale. The risk is not the channel; it is running it without creative volume or conversion tracking. If you want a second opinion on an existing account, get in touch or browse more playbooks on the Web Tonic blog.
Sources
Wyzowl, Video Marketing Statistics 2026 · LocaliQ and WordStream, Facebook advertising benchmarks · Socialinsider, 2026 Facebook engagement benchmarks (25M posts, 130K pages) · Sprout Social, social media video insights · Think with Google, video marketing strategies · Nielsen Norman Group, video usability research · DataReportal, global social media users · Pew Research Center, social media fact sheet · FTC, Disclosures 101 for social media influencers · Meta newsroom · Vimeo blog. Figures current as of August 2026.