Table of contents
The honest answer to Meta ads vs Google ads is a split, not a winner: search harvests people actively searching today, social creates the demand that fills that search box next week. This page prices both, shows where each wins, and gives a budget split by business model.
Key Takeaways
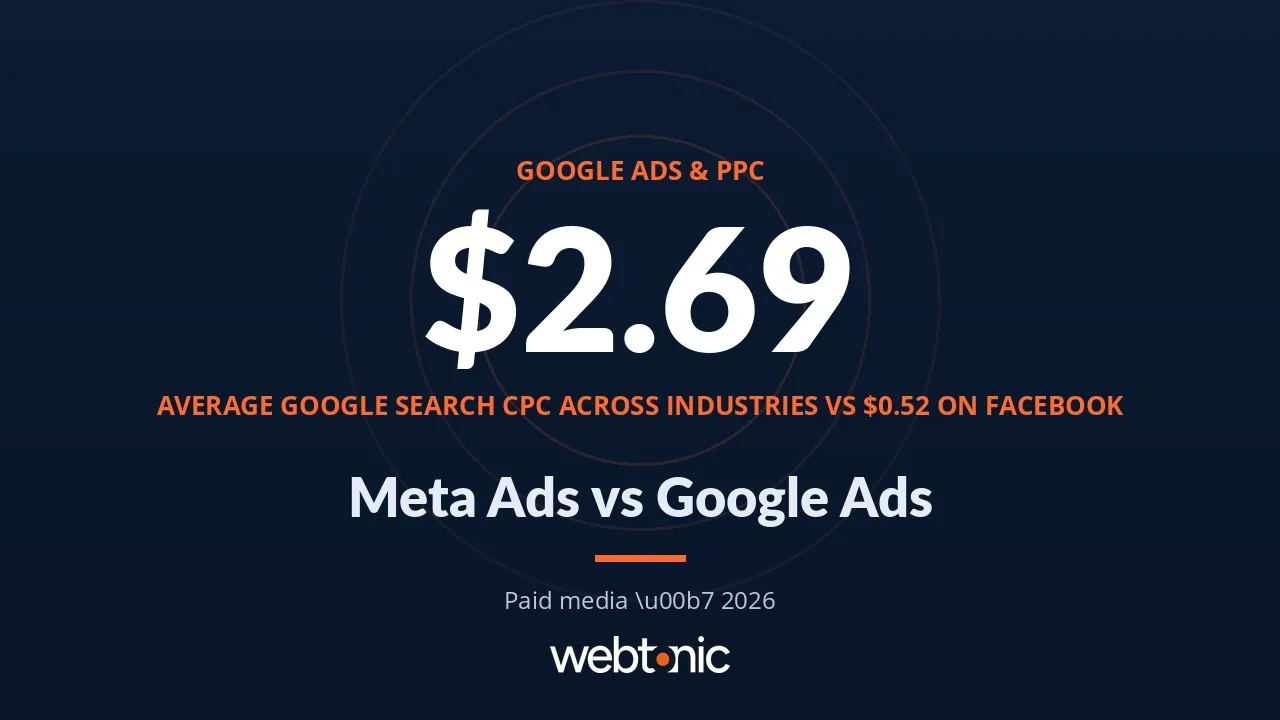
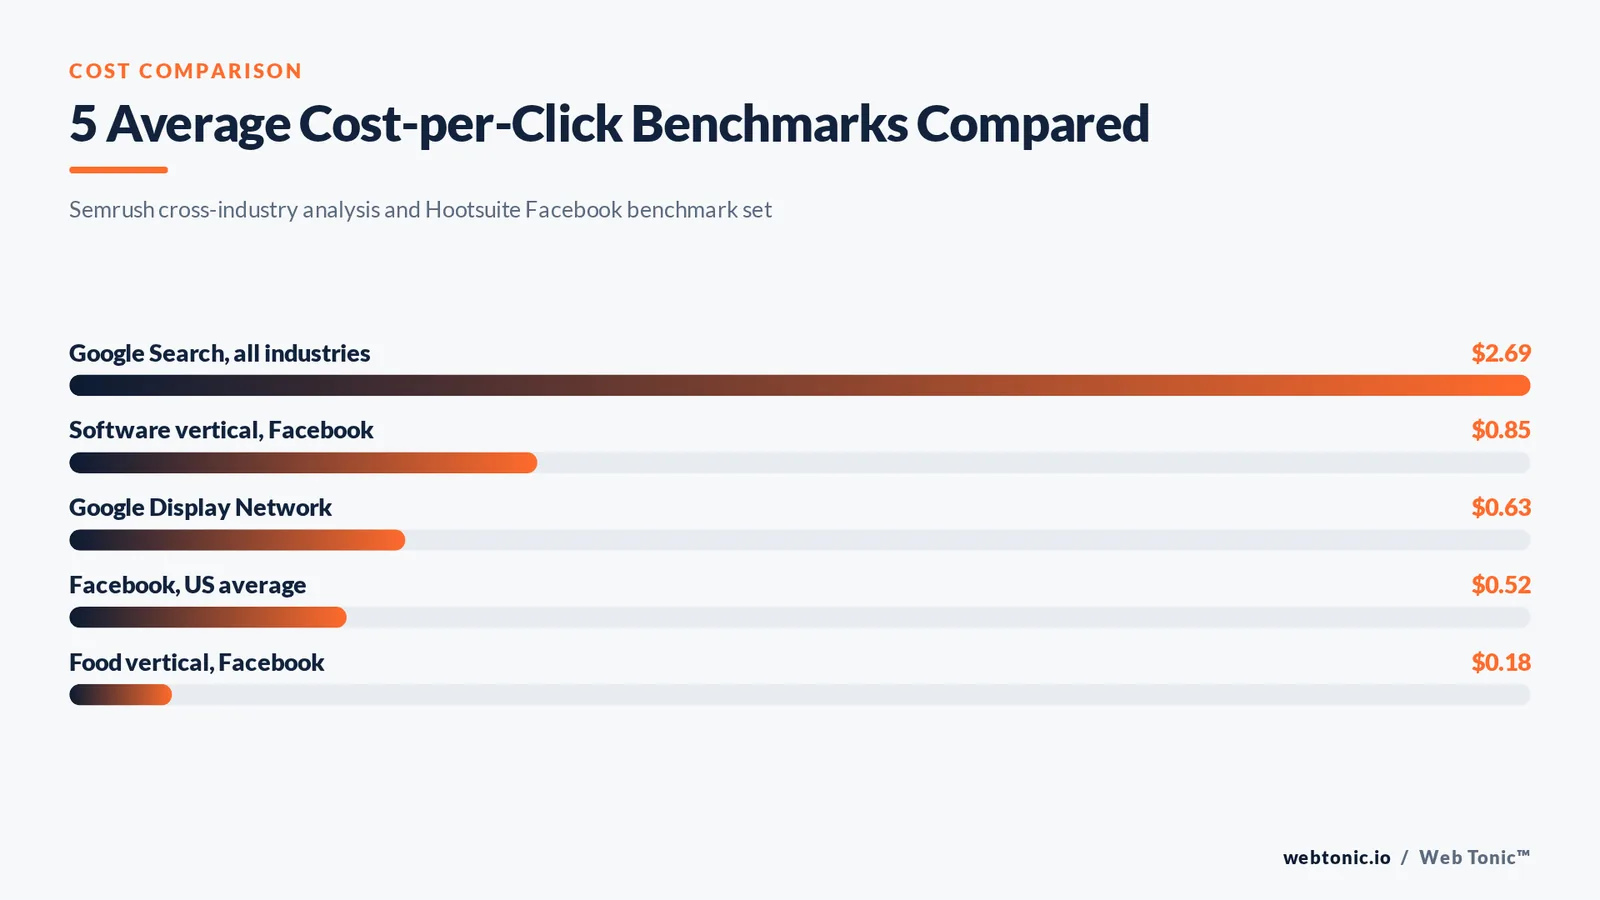
- Average cost per click across industries is $2.69 on Google Search and $0.63 on the Display Network (Semrush).
- Average Facebook CPC in US campaigns was $0.52 in mid-2024, with CPM around $5.61-$8.96 depending on the data set (Hootsuite).
- Click-through rates run 4-6% on paid search versus roughly 1.49% in the Facebook feed (WordStream) — intent, not creative, explains most of that gap.
- Meta's automated audience option is reported to cost about 28% less per result than manual interest stacks in Hootsuite's benchmark set.
- Search Quality Score is judged on exact searches over the last 90 days, which is why a relevance problem cannot be bid away (Google Ads Help).
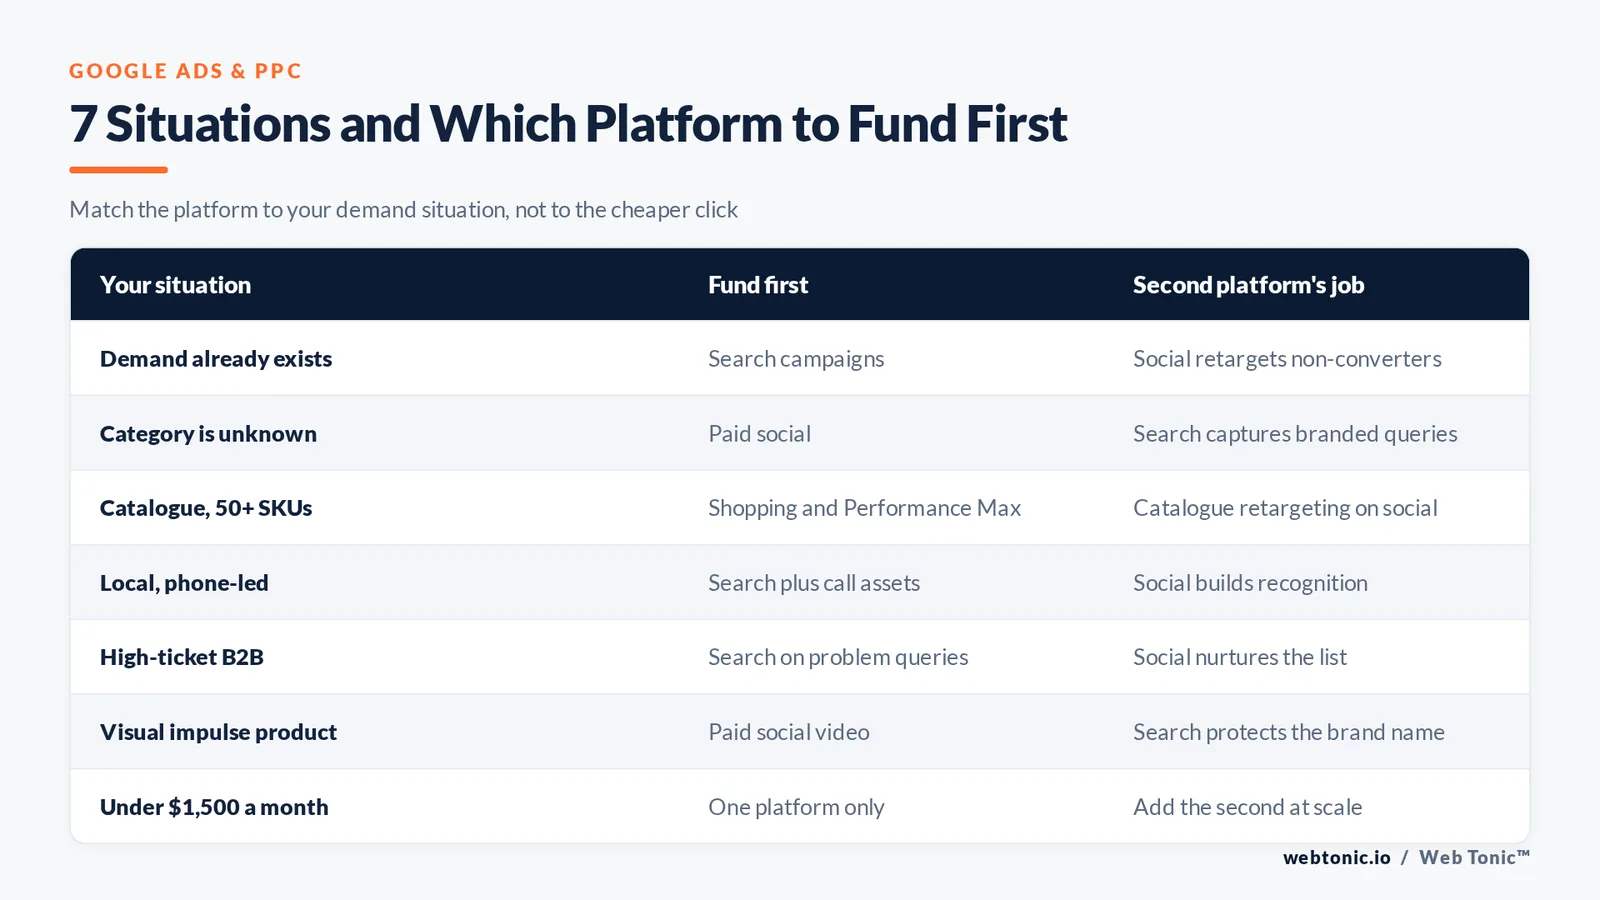
Decision table: which platform to fund first
Start here. Rule 1 — fund the platform that matches your demand situation, not the one with the lower cost per click.
| Your situation | Fund first | Why | Second platform's job |
|---|---|---|---|
| People already search for what you sell | Search campaigns | Harvest existing high intent searches | Social retargets non-converters |
| Nobody knows the category exists | Paid social | Create demand with video | Search captures branded queries later |
| Ecommerce catalogue, 50+ SKUs | Shopping and Performance Max | Feed does the targeting | Catalogue retargeting on social |
| Local services, phone-led | Search plus call assets | Immediate need, small radius | Social builds recognition |
| High-ticket B2B, long cycle | Search on problem queries | Small volume, high value | Social nurtures the list |
| Impulse or visual product | Paid social video | Discovery is the purchase trigger | Search protects the brand name |
| Under $1,500 per month total | One platform only | Two half-funded accounts learn nothing | Add the second at scale |
How each platform actually works
Google sells access to a stated need. Its inventory spans search results, the Display Network, Shopping, YouTube and Gmail placements, and Performance Max blends all of them from one asset set. Meta sells access to attention across Facebook, Instagram, Messenger and its Audience Network, where the system infers interest from behaviour rather than a typed query. Fact 2 — that single difference drives cost, creative and measurement decisions on both sides.
| Mechanic | Search side | Social side |
|---|---|---|
| Trigger | A typed query | A scroll session |
| Targeting unit | Keyword and match type | Signals, lookalikes, broad targeting |
| Winning input | Relevance and landing page | Creative hook and volume |
| Primary auction metric | Ad Rank including Quality Score | Estimated action rate and bid |
| Placement spread | Results, Shopping, Display, YouTube, Gmail, Maps | Feeds, Stories, Reels, Messenger, Audience Network |
| Time to learn | Days once conversions arrive | Days per creative, then fatigue |
| Creative refresh need | Low, copy-led | High, video-led |
Cost per click and cost per thousand compared
Media rates are the least useful comparison, but they anchor a budget. Limit 3: never compare a search CPC to a social CPC without comparing conversion rates in the same table.
| Metric | Search benchmark | Facebook and Instagram benchmark | Source |
|---|---|---|---|
| Cost per click, all industries | $2.69 | $0.52 US average, mid-2024 | Semrush, Hootsuite |
| Cost per click, display or network | $0.63 | $0.18 food to $0.85 software by vertical | Semrush, Hootsuite |
| CPM | Varies by vertical and format | $5.61 to $8.96 average | Hootsuite |
| CPM, lead generation objective | Higher than average | $9.78 to $31.58 seasonal range | Hootsuite |
| CPM, awareness objective | Lowest on display placements | $0.74 to $2.58 | Hootsuite |
| Click-through rate | 4-6% paid search | 1.49% feed average | WordStream, Hootsuite |
| Peak-season inflation | Auction-driven | Up to 145% above baseline on retail peaks | Hootsuite |
Vendor benchmarks describe other advertisers, not you. Use them once, to sanity-check a plan, then compare only against your own trailing 90 days; the vertical splits published by Socialinsider show how wide the spread inside a single platform can be. Semrush's cost per click explainer is the shortest primer on how the number is actually derived.
Audience intent is the real key difference
The intent gap explains almost every performance surprise. Someone typing an emergency query has already decided; someone watching a Reel has not. Fact 4 — a 4-6% click rate against a 1.49% click rate is a roughly threefold gap that no creative refresh closes. Social reach is enormous — DataReportal tracks billions of active identities and Pew Research shows how usage splits by age in the US — but reach is not readiness.
| Intent level | Typical query or signal | Best platform | Expected conversion behaviour |
|---|---|---|---|
| Emergency | 24 hour plumber near me | Search | Same-session conversion |
| Comparison | best crm for small teams | Search plus retargeting | Multi-visit, days |
| Category curiosity | Watches a product video | Social | Weeks, needs nurture |
| Passive fit | Matches a lookalike profile | Social | Low intent, cheap reach |
| Brand name | Types your company name | Search, defensively | Highest rate, cheapest click |
| Cart abandoner | Left checkout yesterday | Both, retargeting | Highest incremental value |
Ad formats and creative requirements
Creative cost is a hidden budget line. Search needs writing; social needs shooting. Limit 5: a responsive search ad accepts up to 15 headlines of 30 characters and 4 descriptions of 90 characters, and lifting its strength from Poor to Excellent is associated with about 15% more clicks and conversions (Google Ads Help).
| Format family | Platform | Production input | Refresh cadence |
|---|---|---|---|
| Responsive text ad | Search | Copywriter, 15 headlines | Quarterly |
| Shopping and catalogue listing | Search and social | Clean product feed | Continuous feed hygiene |
| Short vertical video | Social, YouTube | Editor plus footage | Every 2-4 weeks |
| Static image | Social, display | Designer | Monthly |
| Carousel | Social | 3-10 assets | Monthly |
| Automated blended campaign | Performance Max | Full asset library | Asset-level, ongoing |
Budget split models by business type
These splits are starting points that assume tracking already works. Rule 6 — move no more than 20% of a budget per fortnight so neither system re-enters learning.
| Business model | Search share | Social share | Reasoning |
|---|---|---|---|
| Local services | 70% | 30% | Demand exists and is geographically capped |
| Ecommerce, established brand | 55% | 45% | Catalogue works in both auctions |
| Ecommerce, new brand | 35% | 65% | Nobody searches the brand yet |
| B2B SaaS | 60% | 40% | Problem queries are high value |
| Course or info product | 30% | 70% | Video sells the transformation |
| App install | 25% | 75% | Social and video placements dominate |
| Marketplace, two-sided | 50% | 50% | Supply from search, demand from social |
Our growth marketing team runs this split as a rolling test rather than a fixed rule, and our performance creative team supplies the video volume the social half needs.
Measurement: why the two platforms never agree
Both platforms report conversions they believe they caused, so the sum usually exceeds real orders. Trap 7 — reconciling reported conversions to actual revenue is a weekly job, not a one-off setup. Treat platform numbers as directional and back-office revenue as truth.
| Discrepancy | Cause | Practical fix |
|---|---|---|
| Both claim the same sale | Different attribution models and windows | Compare each against total blended revenue |
| Social reports more than analytics | View-through and cross-device modelling | Report view-through separately |
| Search reports fewer than the CRM | Offline conversions not imported | Upload offline conversion data |
| Totals exceed real orders | Overlapping claims | Use a single source of truth for revenue |
| Volatile daily numbers | Small conversion counts | Read 14-day rolling windows |
The practical guardrail is a blended efficiency number: total spend across both platforms divided by total new revenue. If that improves while a platform-reported figure worsens, the platform figure is the one to distrust.
Common ways each platform gets wasted
Fact 8 — most underperformance is a structure problem, not a platform problem. Google's own documentation notes that near-duplicate keywords are deduplicated and only the higher Ad Rank version serves, so a sprawling keyword list buys nothing extra (Google Ads Help).
| Waste pattern | Platform | Cost of the mistake | Fix |
|---|---|---|---|
| No negative keyword list | Search | Spend on irrelevant queries | Weekly search term review |
| Broad match with weak tracking | Search | Unmeasured spend | Fix conversions before loosening match |
| One creative per ad set | Social | Fatigue within days | 3-5 hooks per concept |
| Over-segmented ad sets | Social | Nothing exits learning | Consolidate budgets |
| Automated campaigns with no exclusions | Both | Brand and junk traffic mixed in | Add brand exclusions and placement rules |
| Landing page mismatch | Both | Clicks bounce | One page per promise |
| Ignoring peak-season inflation | Both | Blown budget in one week | Pre-book seasonal budget lifts |
A 30-day test that answers the question for your business
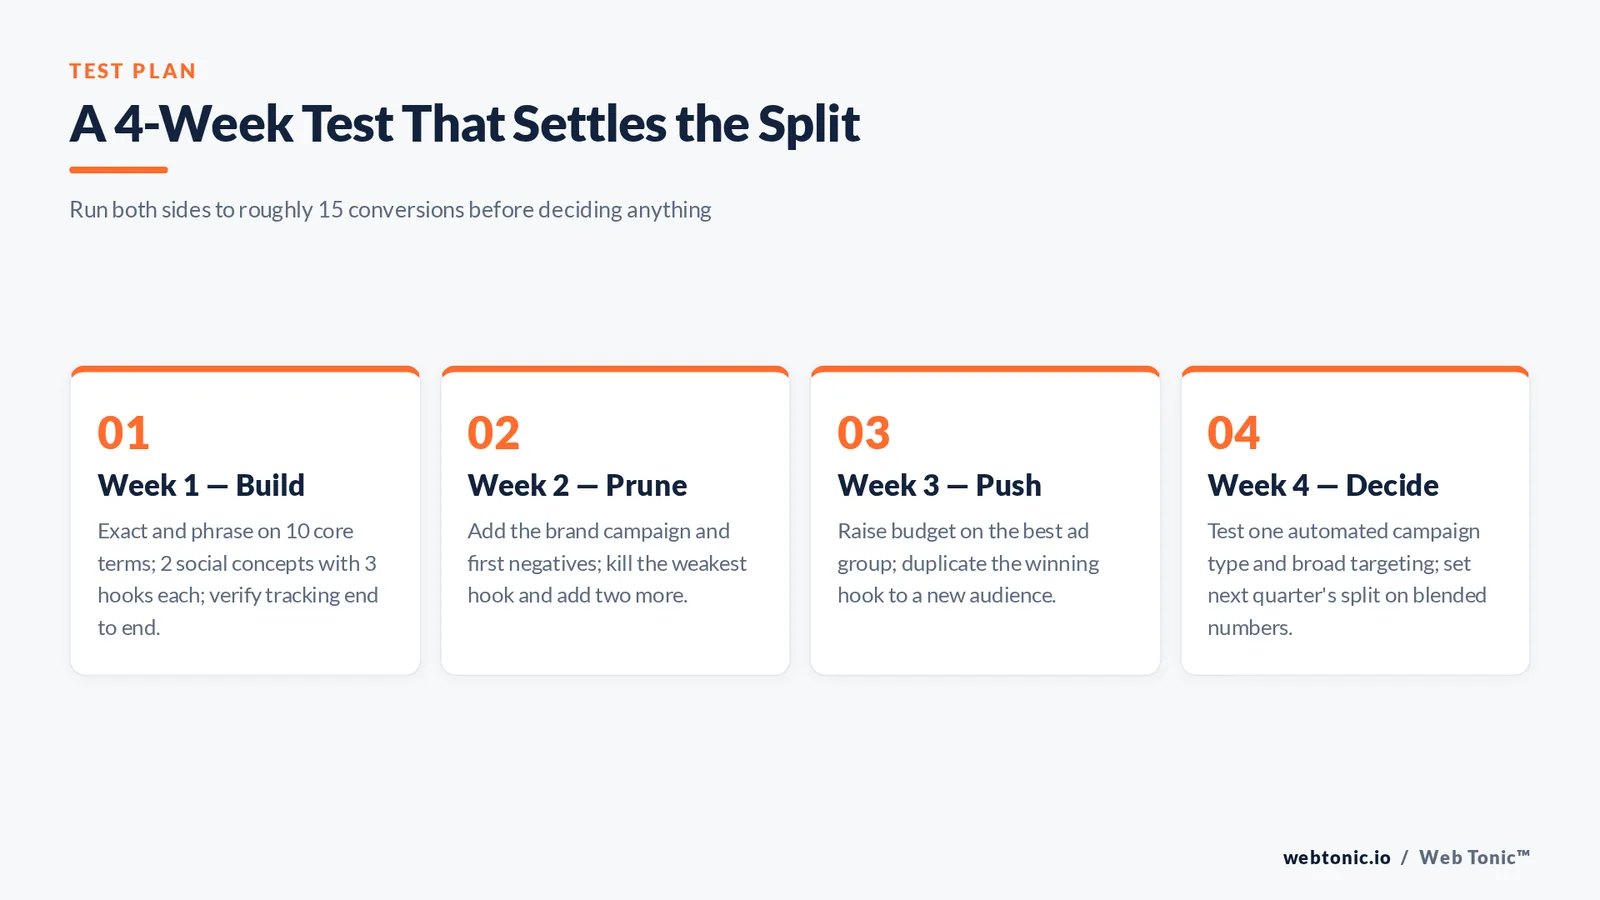
Benchmarks cannot tell you which platform suits your product; a controlled month can. Rule 9 — spend enough on each side to clear roughly 15 conversions in 30 days, or the test proves nothing. Google's guidance for automated bid strategies uses a similar volume threshold before targets become reliable.
| Week | Search side | Social side | Decision checkpoint |
|---|---|---|---|
| 1 | Exact and phrase on 10 core terms | 2 concepts, 3 hooks each | Tracking verified end to end |
| 2 | Add brand campaign, first negatives | Kill the bottom hook, add 2 | Cost per lead visible on both |
| 3 | Raise budget on the best ad group | Duplicate winning hook to a new audience | Blended efficiency compared |
| 4 | Test one automated campaign type | Test broad targeting against interests | Split decided for next quarter |
Record the result in one place; the reporting layer our data intelligence team builds exists precisely so this decision is made on blended numbers. More worked breakdowns sit on the Web Tonic blog, and you can bring an account for review through contact.

Full-funnel strategy: what each platform does at every stage
The comparison stops being a contest once you place both inside one funnel. Awareness is cheap on social, decision is cheap on search, and a digital marketing strategy that ignores either pays twice for the same customers. Fact 10 — awareness-objective CPMs bottom out near $0.74 while lead-generation CPMs reach $31.58 in the same platform, which is the clearest proof that the objective, not the platform, sets the price.
| Funnel stage | What the platform is good at | Audiences to build | Objective to select | ROI signal to read |
|---|---|---|---|---|
| Awareness | Social video reaches users who are not searching yet | Broad, interest, video viewers | Reach or awareness | Cost per thousand and view rate |
| Interest | Both: social discovery plus non-brand search | Engagers, site visitors, keyword-based groups | Traffic or engagement | Cost per qualified session |
| Consideration | Search comparison queries, social carousels | Product-page viewers, comparison keyword audiences | Leads or add to cart | Cost per micro-conversion |
| Decision | Search harvests users actively searching to buy | Brand terms, cart abandoners, customer match | Sales or conversions | Cost per acquisition |
| Retention | Social retargeting and email-matched audiences | Existing customers, high value buyers | Catalogue sales | Repeat purchase rate and blended ROI |
Read the last column across the whole table rather than per platform: awareness spend that raises branded search volume is working even when its own dashboard shows no conversions.
How business size changes the answer
Small businesses and enterprise advertisers face different constraints on identical auctions. Trap 11 — copying an enterprise account structure at $2,000 a month starves every campaign of data.
| Advertiser size | Main constraint | Practical structure | Reporting cadence |
|---|---|---|---|
| Under $2k per month | Conversion volume | One platform, two campaigns, one audience each | Monthly |
| $2k-$10k per month | Creative supply | Both platforms, consolidated budgets | Fortnightly |
| $10k-$50k per month | Incrementality | Automated campaign types plus exclusions | Weekly |
| Over $50k per month | Measurement confidence | Geo holdout tests on top of both platforms | Weekly plus quarterly test read |
FAQ
Is Meta cheaper than Google?
Per click, usually yes: US Facebook campaigns averaged about $0.52 per click against $2.69 on paid search across industries. Per conversion the ranking often flips, because search traffic arrives with a stated need and converts at a far higher rate. Compare cost per acquisition, never cost per click alone.
Which platform is better for a small business with a $1,000 monthly budget?
Pick one. Two half-funded accounts never gather enough conversion data to optimise. If people already search for your service, fund search; if the category is unfamiliar or the product is visual, fund paid social and let it create the demand you capture later.
Should I run both platforms at the same time?
Once you clear roughly 15 to 30 conversions per month on the first platform, yes. Running both lets social create demand and search harvest it, and gives you retargeting inventory in two auctions. Below that volume, sequencing beats splitting.
Why do the two dashboards report different conversion totals?
Each platform credits conversions its own model believes it influenced, using different attribution windows and view-through rules, so the totals overlap. Reconcile both against back-office revenue weekly and judge the accounts on blended spend to revenue instead.
Does creative matter more on one platform?
Creative volume matters far more on social, where hooks fatigue in weeks. On search, copy still matters, and asset quality is measurable: lifting responsive ad strength from Poor to Excellent is associated with roughly 15% more clicks and conversions.
Sources
Semrush, Google Ads cost analysis and cost per click explainer. Hootsuite, Facebook advertising cost benchmarks, including Revealbot, Databox and Statista data sets. WordStream, average click-through rate. Socialinsider, Facebook ads benchmarks. Google Ads Help: Quality Score, responsive search ads and keyword deduplication documentation. DataReportal, global social media user data. Pew Research Center, social media fact sheet. All URLs verified live 2026-08-06.