Table of contents
Only 47% of dental practices use analytics or BI dashboards for marketing decisions, yet data-driven practices grow 2.4× faster than those relying on intuition. Below are the key statistics on dashboard adoption, KPI tracking, and marketing analytics that separate high-growth dental practices from those wasting budget on unmeasured channels.
Key Takeaways
- 47% of DSOs now use practice analytics/BI dashboards, up 10 points year-over-year, making dashboards the third most adopted AI/analytics tool after patient engagement (55%) and scheduling (31%) (DSO News).
- Data-driven dental practices grow 2.4× faster than those relying on assumptions and intuition for marketing decisions (Dental Marketing Guy).
- Nearly half of dental practices invest less than $2,500/month in marketing despite industry benchmarks calling for 10–15% of revenue (Amplify360).
- Practices spending $1,500–$3,000/month report 6.7/10 marketing satisfaction, while those spending $5,000+ average 7.1/10 — the biggest jump happens between $0–$500 and $500–$3,000 (Click-Vision).
- Only 22% of practice owners consider digital marketing their most effective tactic, suggesting dashboards and measurement gaps are driving underinvestment (Amplify360).
- 69% of healthcare marketers now use a CRM system for tracking patient engagement and campaign performance (Marketing LTB).
Marketing Dashboard and Analytics Adoption Rates
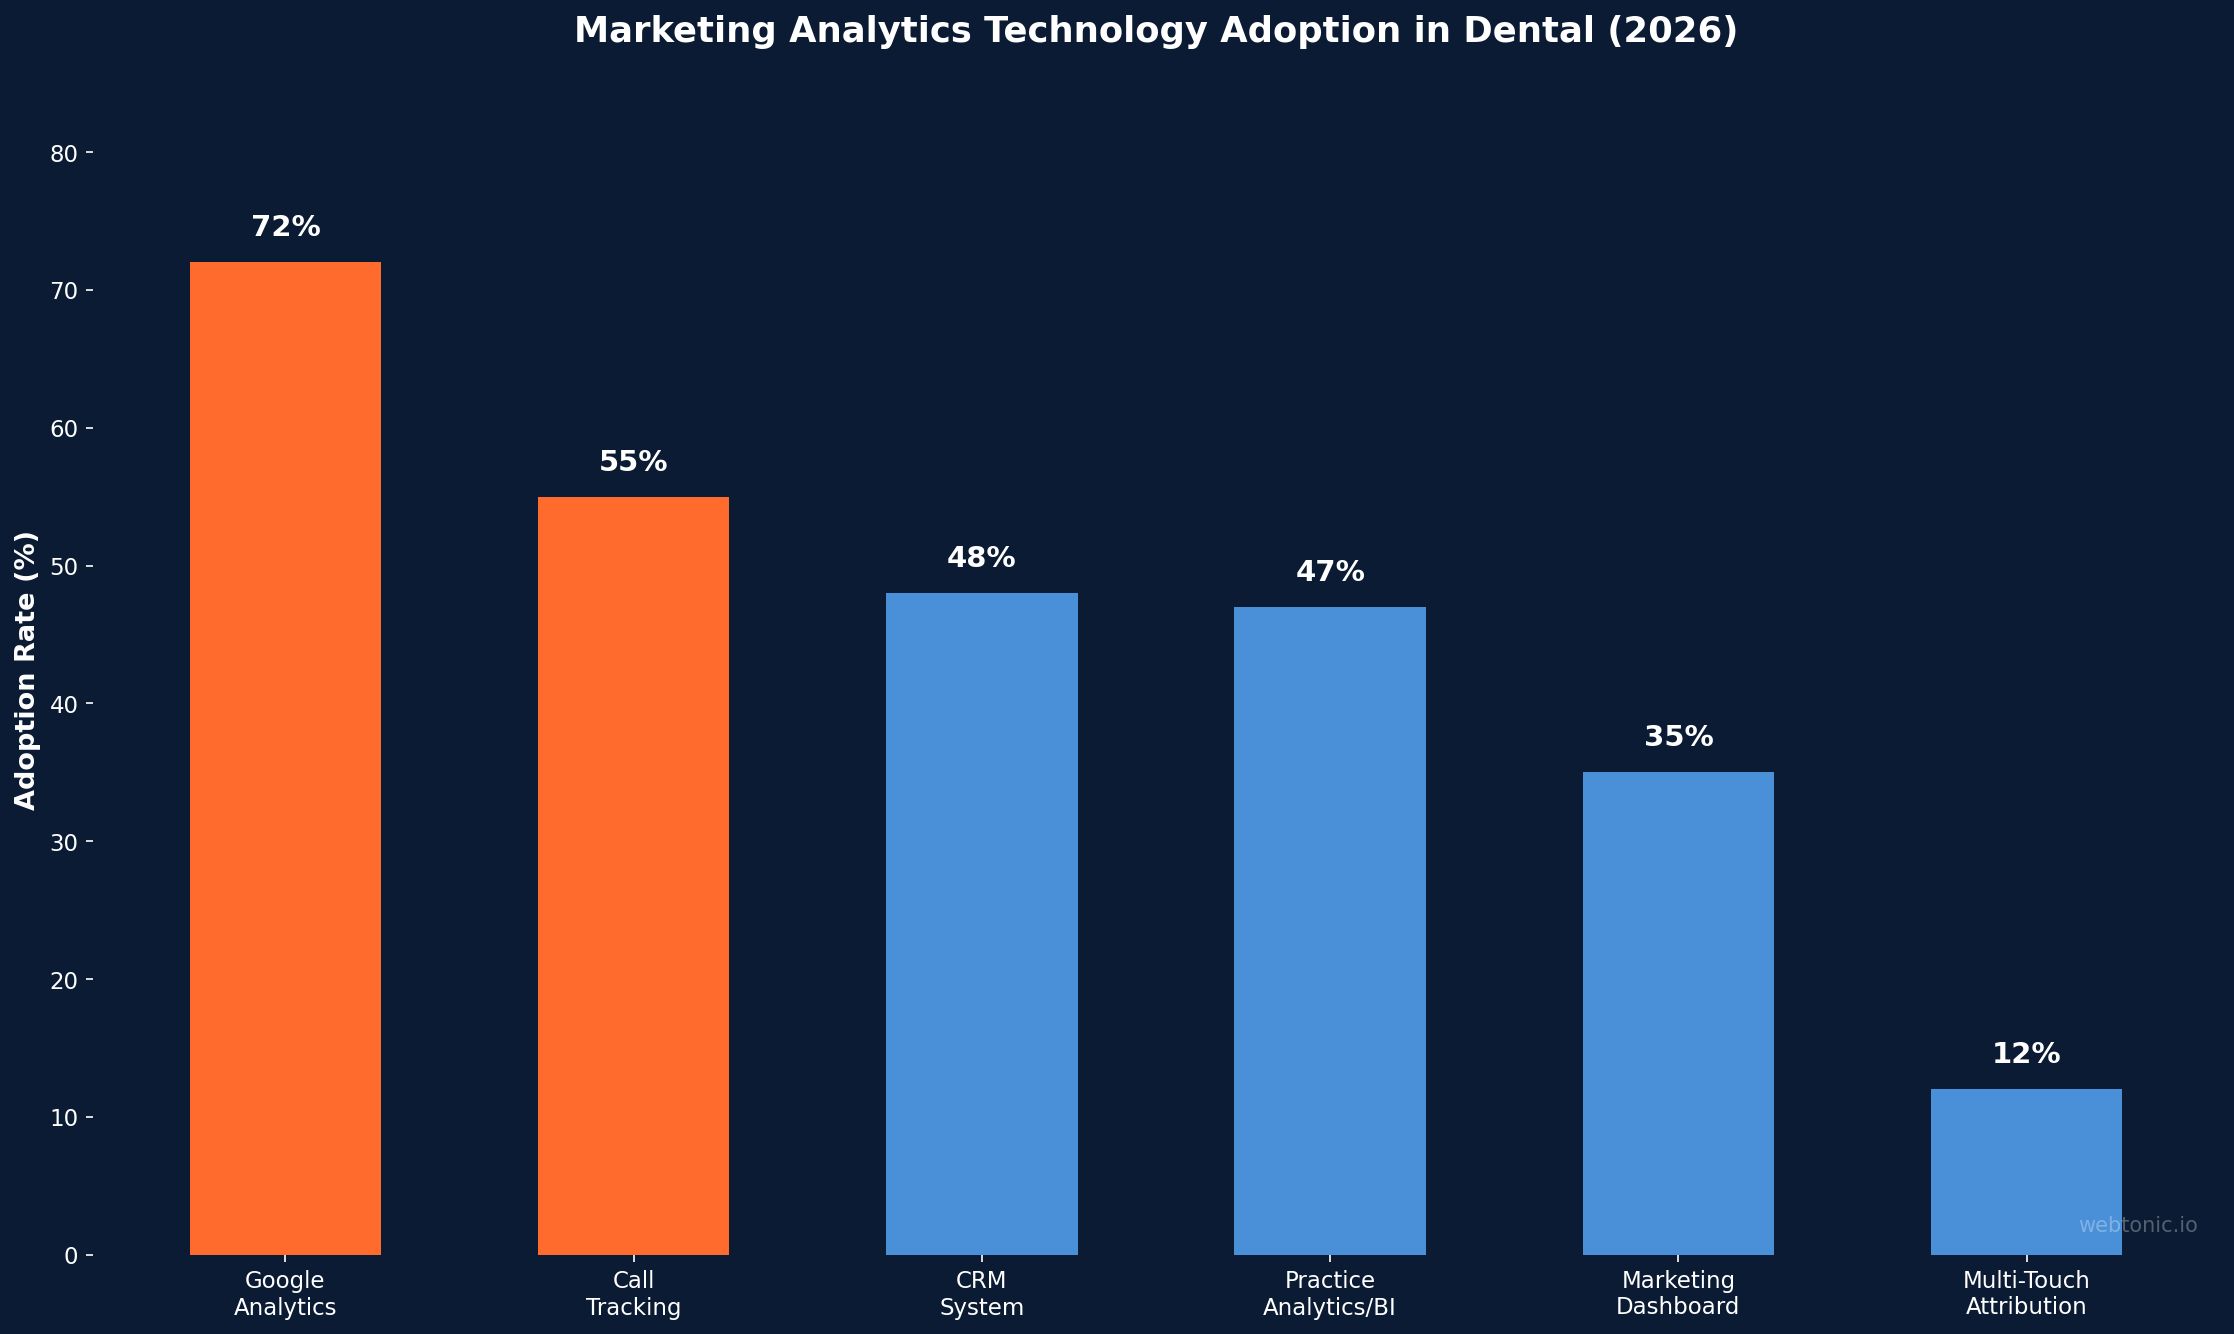
The adoption of marketing analytics technology in dental practices varies significantly by practice size, DSO affiliation, and marketing budget. Larger practices and DSOs lead adoption, but even solo practitioners are increasingly investing in dashboard solutions.
| Technology | Adoption Rate | YoY Change | Top Provider |
|---|---|---|---|
| Google Analytics (GA4) | 72% | +5 pts | Google (free) |
| Call tracking | 55% | +7 pts | CallRail, Liine |
| CRM system | 48% | +6 pts | HubSpot, Dentrix, PMS integrations |
| Practice analytics / BI dashboards | 47% | +10 pts | Practice by Numbers, ConvertLens |
| Unified marketing dashboard | 35% | +8 pts | AgencyAnalytics, SmileTrak |
| Patient engagement automation | 55% | +7 pts | Weave, RevenueWell |
| Multi-touch attribution | 12% | +3 pts | GA4 DDA, custom builds |
The 2026 State of AI in DSOs report shows the fastest growth in scheduling optimization (+12 pts) and practice analytics/BI dashboards (+10 pts) — reflecting the industry's shift toward data-driven decision-making.
Essential Marketing KPIs Tracked on Dental Dashboards
High-performing dental practices track a core set of marketing KPIs that connect marketing spend directly to patient production revenue. According to Direction.com, seven metrics form the foundation of any effective dental marketing measurement system.
| KPI | Benchmark | Tracking Frequency | Dashboard Priority |
|---|---|---|---|
| Cost per lead (CPL) | $25–$150 | Weekly | Critical |
| Cost per new patient | $150–$400 | Monthly | Critical |
| New patient volume by source | 15–50/month | Weekly | Critical |
| Patient lifetime value (LTV) | $3,000–$5,000 | Quarterly | High |
| Treatment acceptance rate | 60–80% | Monthly | High |
| Show rate | 75–90% | Weekly | Medium |
| Production per lead source | $500–$2,000 | Monthly | High |
| Patient retention rate | 78% | Monthly | Medium |
| ROAS by channel | 3.5–12:1 | Monthly | Critical |
| Marketing spend as % of revenue | 4–15% | Monthly | High |
The most effective dental dashboards correlate upstream marketing metrics (CPL, CTR, impressions) with downstream practice metrics (show rate, treatment acceptance, production) to reveal the true cost per producing patient — not just the cost per lead.
Marketing Spend, Satisfaction, and Dashboard Correlation
Research from 448 dental practices reveals a clear correlation between marketing investment and satisfaction with results. Importantly, the biggest improvement happens at lower spend levels — going from nothing to something generates more satisfaction gain than doubling a large budget.

According to Click-Vision, dental practices typically invest 4–7% of annual revenue in marketing. Practices spending 2–4% experience healthy growth, while those investing 10–15% align with industry benchmarks for aggressive expansion. The data shows that spending more doesn't automatically produce better results — practices with dashboards tracking ROI by channel optimize their spend more effectively at every budget level.
Types of Marketing Dashboards Used in Dental Practices
Dental marketing dashboards fall into four categories, each serving different needs and practice sizes. Understanding the landscape helps practices choose the right solution for their growth stage and budget.
| Dashboard Type | Examples | Monthly Cost | Best For |
|---|---|---|---|
| Free analytics platforms | Google Analytics 4, Google Looker Studio | $0 | Solo practices, basic web tracking |
| Call tracking dashboards | CallRail, Liine, CallSource | $45–$300 | Practices where phone is primary conversion |
| Practice analytics suites | Practice by Numbers, ConvertLens | $200–$800 | Multi-location, DSO-lite practices |
| Agency reporting platforms | AgencyAnalytics, DashThis, SmileTrak | $100–$500 | Practices working with marketing agencies |
| Enterprise BI dashboards | InsightsBridge, custom Tableau/Looker | $500–$2,000+ | DSOs with 10+ locations |
Data Integration Challenges for Dental Marketing Dashboards
The biggest obstacle to effective dental marketing dashboards is data fragmentation across disconnected systems. A typical dental practice generates marketing data in 5–8 separate platforms that must be unified for meaningful analysis.
- Practice management system (PMS) — Dentrix, Eaglesoft, or Open Dental stores patient records, production, and collections data but rarely connects natively to marketing platforms
- Google Ads and Meta Ads — each platform reports its own metrics in isolation, often claiming overlapping credit for the same conversions
- Google Analytics 4 — tracks website behavior and some conversions but cannot attribute phone calls without third-party integration
- Call tracking platforms — CallRail or Liine capture phone attribution but need manual or API-based reconciliation with PMS data
- Review platforms — Google Business Profile, Yelp, and Healthgrades each report engagement separately
- Social media — organic social metrics live in platform-native dashboards that rarely connect to paid advertising measurement
According to Dentist Decoded, the most effective dashboards are evaluated based on their integration capabilities with PMS systems and marketing platforms, ease of use for non-technical practice owners, and actionable alert capabilities that surface problems before they waste budget.
ROI of Marketing Dashboard Investment for Dental Practices
Dental practices that implement comprehensive marketing dashboards consistently report improved ROI through better budget allocation and faster identification of underperforming channels. The return on dashboard investment comes from three primary sources:
- Waste elimination. Dashboards that track CPL and ROAS by channel help practices cut 15–25% of wasted spend by identifying channels with declining returns before the waste accumulates.
- Faster optimization. Real-time dashboards reduce the response time from "something isn't working" to "we adjusted the campaign" from 30 days (monthly reporting) to 3–5 days (weekly dashboard review).
- Budget justification. Practices with clear marketing ROI data are more likely to maintain or increase marketing budgets during downturns. The Pete Johnson benchmark report shows that practices allocating 30–40% to Google Ads and 20–30% to SEO see the strongest combined returns.
- Staff accountability. When front desk staff know that call handling metrics (answer rate, scheduling rate, hold times) are tracked on a dashboard, scheduling conversion rates improve by 10–20% without any process changes.
Dashboard Best Practices for Dental Marketing Teams
- Start with GA4 and call tracking. These two free/low-cost tools capture 80%+ of meaningful marketing data for most single-location dental practices.
- Set automated alerts for cost spikes. Configure dashboard alerts when CPL exceeds 2× the 30-day average — this catches campaign problems within days instead of weeks.
- Review dashboards weekly, not monthly. Monthly reporting delays are the single biggest cause of wasted dental marketing spend. Weekly 15-minute dashboard reviews produce 3–5× faster optimization cycles.
- Track source-level production, not just leads. A $200 Google Ads lead who books a $15,000 implant case is far more valuable than a $50 Facebook lead who books a cleaning. Dashboards must connect to PMS production data.
- Benchmark against industry data. Use resources like CuFinder's dental benchmarks and Marketing LTB to compare practice performance against industry averages.
- Include patient journey metrics. Track the full funnel from impression → click → call → appointment → show → treatment acceptance → production to identify where patients drop off by source.
AI-Powered Analytics and Automation Trends in Dental Dashboards
Artificial intelligence is transforming how dental practices analyze and act on marketing data. The 2026 DSO AI report reveals that AI adoption in dental analytics has accelerated significantly, with several key trends reshaping how practices use dashboards.
- AI-powered call scoring automatically classifies inbound calls as new patient inquiries, existing patient calls, or non-patient calls with 90%+ accuracy. This eliminates the manual call review process and provides real-time lead quality data on dashboards.
- Predictive patient value models use historical treatment data to estimate the lifetime value of incoming leads at the point of first contact, enabling practices to prioritize high-value opportunities.
- Automated budget alerts notify practice owners when cost per lead exceeds historical norms, campaign performance drops below target thresholds, or monthly spend pacing deviates from budget by more than 10–15%.
- Natural language reporting translates complex dashboard metrics into plain-language summaries. Instead of reading charts, practice owners receive automated reports stating: "Google Ads generated 23 new patients at $142 each this month — 8% better than your 90-day average."
- Cross-channel attribution AI identifies which combinations of marketing touchpoints most frequently lead to high-value patient conversions, optimizing budget allocation beyond what rule-based attribution models can achieve.
Clinical decision support (22% adoption, +8 pts YoY) and scheduling optimization (31%, +12 pts YoY) are also being integrated into marketing dashboards, creating unified practice intelligence platforms that connect marketing inputs to clinical and operational outputs.
Dashboard Adoption and Performance by Practice Size
Dashboard adoption and the marketing metrics tracked vary significantly based on practice size and organizational structure. Solo practitioners, group practices, and DSOs each face different challenges and require different dashboard configurations.
| Practice Type | Dashboard Adoption | Avg Marketing Budget | Key Challenge |
|---|---|---|---|
| Solo practice (1 location) | 25% | $1,000–$3,000/mo | Time to review data; limited tech resources |
| Small group (2–5 locations) | 45% | $3,000–$10,000/mo | Comparing performance across locations |
| Mid-size DSO (6–25 locations) | 65% | $10,000–$50,000/mo | Standardizing reporting and KPIs |
| Enterprise DSO (25+ locations) | 85% | $50,000+/mo | Data integration at scale; real-time visibility |
Enterprise DSOs with 85% dashboard adoption lead the industry in measurement sophistication, but even solo practices can achieve meaningful insights with basic free or low-cost tools. The critical factor is not the dashboard platform but the consistency of weekly review and data-driven decision-making — practices that review dashboards weekly outperform those that check monthly by a significant margin in both patient acquisition efficiency and marketing ROI.
Frequently Asked Questions
What KPIs should dental practices track on marketing dashboards?
Every dental practice should track cost per lead, cost per new patient, new patient volume by source, ROAS by channel, treatment acceptance rate, show rate, and patient lifetime value. These seven KPIs connect marketing spend to patient production revenue. Critical metrics should be reviewed weekly, while others can be tracked monthly or quarterly.
How much does a dental marketing dashboard cost?
Dental marketing dashboard costs range from $0 (Google Analytics + Looker Studio) to $2,000+ per month for enterprise BI solutions. Most single-location practices can build an effective measurement stack for $45–$300/month using call tracking and free analytics tools. Multi-location practices and DSOs typically invest $200–$800/month in dedicated practice analytics platforms.
What percentage of dental practices use marketing dashboards?
Approximately 35% of dental practices use unified marketing dashboards, while 47% use some form of practice analytics or BI tool. Google Analytics adoption is highest at 72%, and call tracking is used by 55% of practices. Only 12% implement multi-touch attribution, leaving significant optimization opportunity for practices willing to invest in measurement infrastructure.
How do marketing dashboards improve dental practice ROI?
Marketing dashboards improve dental ROI through three mechanisms: waste elimination (15–25% spend reduction) by identifying underperforming channels, faster optimization (3–5 day response time vs. 30 days) through real-time monitoring, and budget justification that maintains marketing investment during uncertain periods. Data-driven practices grow 2.4× faster than those relying on intuition.
What is the best marketing dashboard for a solo dental practice?
For solo dental practices, the best starting point is Google Analytics 4 (free) combined with CallRail ($45–$150/month). This setup captures both web-based and phone conversions with source-level attribution. As the practice grows, adding a dedicated dental analytics platform like Practice by Numbers or ConvertLens provides deeper integration with the practice management system.
Sources
https://www.dsonews.ai/2026-state-of-ai-in-dental-service-organizations/
https://dentalmarketingguy.co/blog/dental-practice-analytics-roi-tracking-2026/
https://click-vision.com/dental-marketing-statistics
https://www.amplify360.com/why-dental-practices-are-spending-more-on-marketing-and-getting-less-what-the-data-shows/
https://direction.com/how-to-measure-dental-marketing-roi/
https://dentistdecoded.com/articles/best-marketing-dashboards-for-dental-clinics/
https://cufinder.io/blog/benchmarks/dentists/
https://marketingltb.com/blog/statistics/dental-marketing-statistics/
https://petejohnsoniv.com/blog/dental-marketing-benchmarks-2026