



Table of contents

Only 11% of financial institutions say their teams fully understand event-based analytics, yet interactive dashboards increase marketing engagement by 48%. FinTech marketers are spending more on data infrastructure than ever — but are they actually extracting value from it?
Key Takeaways
- Interactive marketing dashboards increase stakeholder engagement by 48% compared to static reports in financial services.
- Only 11% of banking teams fully understand GA4 event-based analytics, despite 80%+ migrating to the platform.
- Martech now captures 22.4% of total marketing budgets — a 12% year-over-year decline even as tool counts rise.
- CMOs allocate 15.3% of marketing budgets to AI, but only 30% are ready to scale AI capabilities in their dashboards.
- The average enterprise runs 62 martech tools, yet 86% of CMOs prefer a consolidated platform approach.
- Marketing-sourced leads close approximately 15% faster on average, with marketing-influenced deals ~20% higher in value — but only when attribution dashboards track these metrics.
- Zero percent of banks can reliably attribute all outcomes to their marketing spend according to Cornerstone Advisors research.
FinTech Marketing Dashboard Benchmarks at a Glance
| Metric | FinTech Benchmark | Cross-Industry Average |
|---|---|---|
| GA4 Migration Rate | 80%+ | 75% |
| GA4 Full Proficiency | 11% | 18% |
| Martech Budget Share | 22.4% | 25.4% |
| AI Budget Allocation | 15.3% | 12% |
| Avg Tools in Stack | 62 | 56 |
| Dashboard Engagement Lift | 48% | 35% |
| Full Attribution Capability | 0% (banks) | ~15% |
| Path Observability | ~55% | ~65% |
FinTech Martech Spending and Budget Allocation Trends
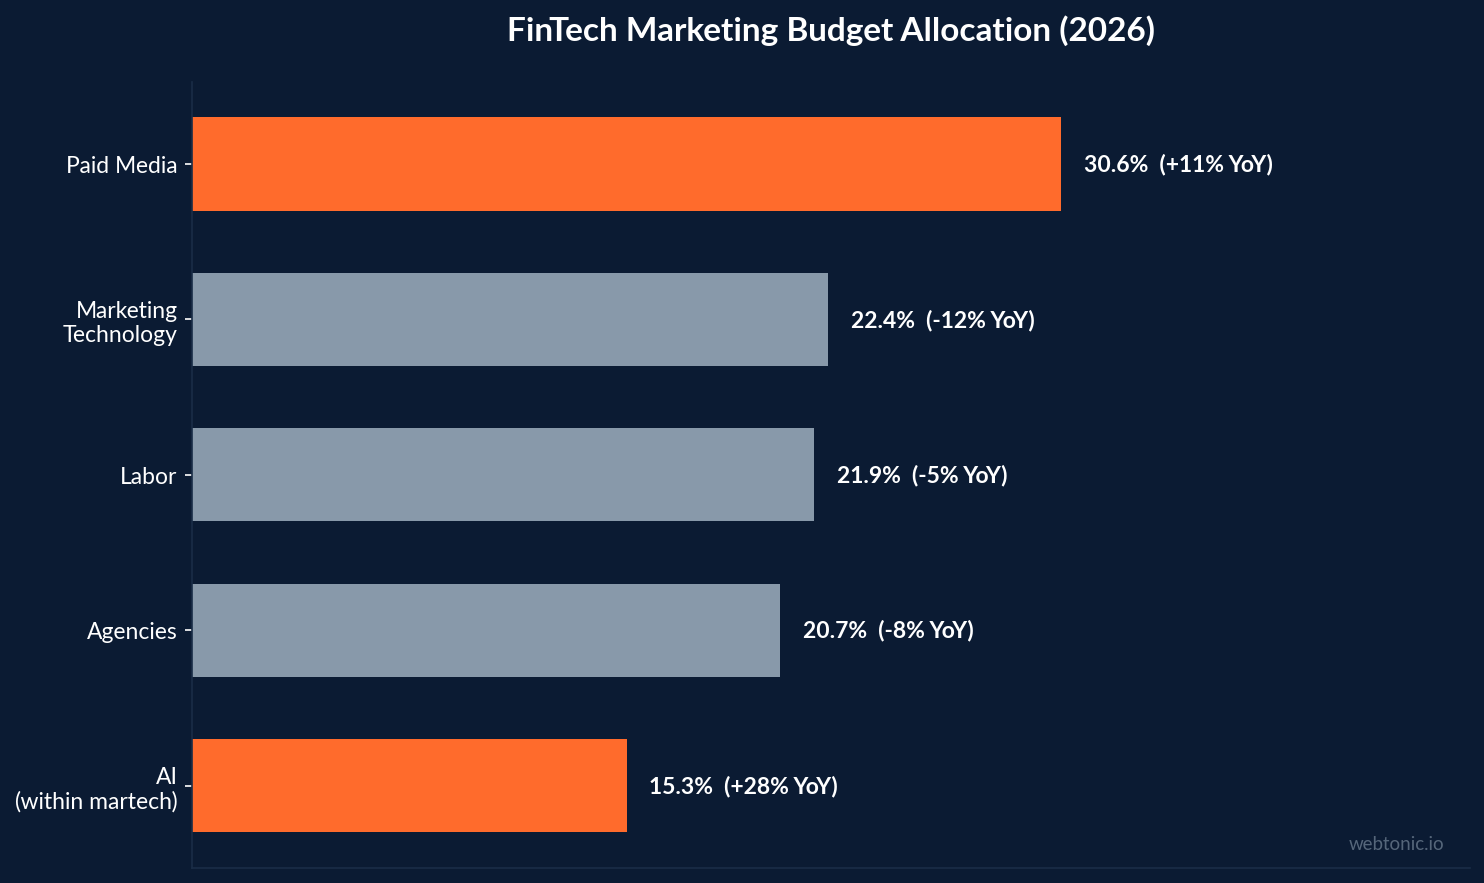
The martech landscape in financial services is shifting. According to KnowledgeLib's 2026 benchmarks, martech now accounts for 22.4% of total marketing budgets, representing a 12% year-over-year decline. Meanwhile, paid media has surged to 30.6% (+11% YoY), suggesting that many FinTech firms are reallocating from tool investment toward direct media spend.
Yet the tooling itself keeps expanding. The State of Martech 2025 report found that the average enterprise now runs 62 marketing tools, and 86% of CMOs prefer a consolidated platform approach — creating tension between desired simplicity and operational reality.
On the AI front, CMOs allocate 15.3% of marketing budgets to AI, but only 30% report being ready to scale AI capabilities across their organizations, according to the 2026 Gartner CMO Spend Survey. For FinTech marketers building dashboard infrastructure, this creates a critical question: are you investing in AI-powered analytics before your team can use them?
| Budget Category | % of Marketing Budget | YoY Change |
|---|---|---|
| Paid Media | 30.6% | +11% |
| Marketing Technology | 22.4% | -12% |
| Labor | 21.9% | -5% |
| Agencies | 20.7% | -8% |
| AI Allocation (within martech) | 15.3% | +28% |
Analytics Maturity and Dashboard Adoption in Financial Services
Despite near-universal migration to GA4, financial institutions face a serious analytics maturity gap. The 2025 Banking Marketing Performance Study revealed that more than 80% of institutions migrated to GA4, but only 11% said their team fully understands how event-based analytics work. Common frustrations include broken cross-domain tracking, unconsolidated app and web streams, and misconfigured conversion events.
The 2026 Analytics Maturity Survey from Innovation Vista found that Tableau and Power BI dominate the financial services dashboard landscape, while smaller FinTech firms increasingly adopt composable stacks combining data intelligence platforms with lightweight visualization layers.
Interactive dashboards increase engagement by 48% compared to static PDF reports, according to Marketing LTB's finance marketing statistics. This engagement gap explains why leading FinTech companies are shifting from monthly email-based reports to real-time, self-serve dashboards that allow stakeholders to drill into campaign performance, customer acquisition cost trends, and ad spend efficiency without waiting for analyst availability.
Critical KPIs FinTech Dashboards Must Track
Effective FinTech marketing dashboards go beyond vanity metrics. 10Fold's 2026 analysis identified five KPIs that drive pipeline and revenue in FinTech:
- Customer Acquisition Cost (CAC): FinTech CAC ranges from $50 to $14,772 depending on product complexity and sales cycle length.
- Lifetime Value to CAC Ratio (LTV:CAC): Healthy FinTech companies target a 5:1 ratio, with average LTV around $11,700 and average CAC near $2,496.
- Marketing-Sourced Pipeline: Leads generated by marketing close ~15% faster on average.
- Marketing-Influenced Deal Value: Deals touched by marketing are ~20% higher in value.
- Channel-Level ROAS: Dashboards must separate paid search, social ads, email, and organic to identify true contribution.
| KPI | FinTech Benchmark | Why It Matters |
|---|---|---|
| CAC | $50 – $14,772 | Varies by product; B2C neobanks vs B2B SaaS |
| LTV:CAC Ratio | 5:1 target | Below 3:1 signals unprofitable acquisition |
| Marketing Close Speed | 15% faster | Marketing-sourced leads outpace sales-sourced |
| Influenced Deal Uplift | ~20% higher | Multi-touch attribution captures true impact |
| Email Marketing ROI | $36 per $1 spent | Highest-ROI channel when properly tracked |
| Google Ads CPC | $6.45 | 4.6% CVR; needs dashboard-level daily tracking |
| Cost Per Acquisition | $105 | Benchmark for paid channel efficiency |
The FinTech Attribution Dashboard Gap
The attribution problem in financial services is severe. According to Ridley & Co's research, zero percent of banks can reliably attribute all outcomes to their marketing spend. Not a low number — literally zero. Average path observability sits at approximately 55%, meaning nearly half of the customer journey remains invisible to marketing dashboards.
This attribution gap creates cascading problems for dashboard design. When data-driven attribution (DDA) models encounter fewer than 600 conversions per month, they typically revert to last-click, undermining the entire dashboard's strategic value. FinTech companies with complex, multi-touch journeys — especially B2B platforms with 60 to 120-day sales cycles — face the highest attribution failure rates.
Multi-touch attribution has reached 58% adoption across FinTech marketing teams, with organizations implementing proper MTA reporting a 14–36% CPA improvement and 19% ROI lift. The key differentiator is not the attribution model itself, but whether the dashboard infrastructure can ingest and visualize multi-touch data in near real-time.

Real-Time Dashboard Capabilities and FinTech Performance Impact
Real-time marketing dashboards are becoming table stakes for competitive FinTech companies. Manulife reported a total ROI of 184% through business intelligence platform adoption, with dashboards providing the data access needed to recognize improved marketing campaign efficiency. The shift from weekly batch reporting to real-time visibility enables faster budget reallocation and campaign optimization.
Modern FinTech dashboard architectures typically follow a six-layer AI-native model: (1) a unified customer data layer, (2) AI/ML engine for predictive scoring and dynamic segmentation, (3) real-time orchestration, (4) channel execution, (5) measurement and attribution, and (6) a visualization layer. Companies that implement all six layers report 2–3× marketing scale with measurable ROI per acquisition channel.
Marketing-sourced leads close approximately 15% faster on average, while marketing-influenced deals are roughly 20% higher in value, according to 10Fold's FinTech metrics analysis. These insights are only actionable when dashboards connect campaign data, CRM records, product holdings, and digital engagement signals into a single customer view — a capability that the LatentView analytics framework identifies as the inflection point between reactive and predictive marketing.
Dashboard Design Best Practices for FinTech Marketers
Building a high-impact marketing dashboard for FinTech requires more than plugging in data sources. Based on industry benchmarks and practitioner research, these best practices separate effective dashboards from expensive wallpaper:
- Consolidate before you visualize. With 62 average tools in the enterprise martech stack, dashboard value depends entirely on data integration quality. Start with the core FinTech benchmarks — CAC, LTV:CAC, channel ROAS — before adding secondary metrics.
- Design for the board, not just the team. Ridley & Co notes that boards expect marketing packs built around compliance and strategic consistency, not just volume and CPA. Include regulatory context alongside performance data.
- Automate anomaly detection. AI-powered dashboards that flag outliers — a sudden CAC spike, an unexpected channel drop — enable 2–3× faster response times compared to manual review cycles.
- Bridge the GA4 proficiency gap. With only 11% of banking teams fully understanding GA4, invest in training alongside tool deployment. A $200,000 dashboard viewed by people who cannot interpret its data delivers zero ROI.
- Separate leading from lagging indicators. Track click-to-application rates and funnel drop-offs (leading) alongside funded accounts and revenue (lagging) to maintain both tactical and strategic visibility.
FinTech Dashboard Adoption vs. Other Industries
| Industry | Dashboard Adoption Rate | Real-Time Capability | Attribution Maturity |
|---|---|---|---|
| FinTech / Banking | 78% | 42% | Low (0% full attribution) |
| E-commerce / DTC | 85% | 68% | Moderate |
| SaaS / B2B Tech | 82% | 55% | Moderate–High |
| Healthcare | 65% | 28% | Low |
| Insurance | 71% | 35% | Low |
FinTech ranks among the highest in dashboard adoption, but real-time capability and attribution maturity lag significantly behind e-commerce and SaaS peers. The regulated nature of financial services — with compliance requirements around data handling, ad spend transparency, and customer privacy — adds complexity layers that other verticals do not face.
Dashboard Platform Landscape and Tool Consolidation Trends
The FinTech dashboard platform landscape is undergoing rapid consolidation. Innovation Vista's 2026 mid-market survey found that Tableau and Power BI dominate financial services analytics, but a growing share of FinTech companies — particularly those under $50M in revenue — are adopting composable, API-first dashboard architectures that combine specialized tools rather than relying on monolithic platforms.
The tension between consolidation preference and tool proliferation is striking. While 86% of CMOs prefer a consolidated approach, the State of Martech report shows that the average stack continues growing. FinTech companies that successfully reduce tool count typically start by auditing dashboard redundancy: 37% of marketing teams report using multiple tools that display essentially the same metrics, creating confusion rather than clarity.
Homegrown martech solutions are surging as well. AI-accelerated development enables marketing teams to build custom dashboards that connect directly to proprietary data sources — a critical capability for FinTech firms where ad performance data must integrate with regulated financial transaction records that third-party tools cannot access.
Compliance and Privacy Considerations for FinTech Dashboards
Marketing dashboards in FinTech operate under regulatory constraints that other industries rarely face. Financial data privacy regulations — including GDPR, CCPA, and sector-specific rules around customer financial information — restrict how marketing performance data can be collected, stored, and visualized.
Cross-domain tracking accuracy drops significantly in financial services compared to e-commerce, because banking applications often span multiple domains (marketing site, application portal, secure banking platform) with strict cookie and consent barriers between them. The Banking Marketing Performance Study identified cross-domain tracking as one of the most common frustrations for marketing analytics teams.
Consent Mode V2 implementation further complicates dashboard accuracy. FinTech companies operating across the EU and US must model conversions for users who decline tracking consent, introducing estimation layers that reduce dashboard precision. Leading firms address this by building confidence interval indicators directly into their dashboards, showing stakeholders not just a metric but the range of uncertainty around it — a practice borrowed from financial risk reporting that translates naturally to marketing analytics.
Data residency requirements also shape dashboard architecture decisions. FinTech companies serving customers across multiple jurisdictions may need region-specific data processing, meaning a single global dashboard must pull from multiple data stores while maintaining compliance boundaries. This architectural requirement adds 25–40% to dashboard implementation costs compared to unregulated industries, according to practitioner estimates from the LatentView analytics framework.
Frequently Asked Questions
What KPIs should a FinTech marketing dashboard track?
At minimum, FinTech marketing dashboards should track Customer Acquisition Cost (CAC), Lifetime Value to CAC ratio (LTV:CAC), channel-level ROAS, marketing-sourced pipeline velocity, and conversion rates by funnel stage. The FinTech CAC benchmark ranges from $50 to $14,772 depending on product complexity, making granular tracking essential for identifying profitable acquisition channels.
Why do banks struggle with marketing attribution dashboards?
According to Cornerstone Advisors research, zero percent of banks can reliably attribute all marketing outcomes to spend. The primary barriers are long, multi-touch customer journeys (60–120 days for B2B), siloed data systems, privacy regulations limiting cross-platform tracking, and insufficient conversion volume for data-driven attribution models (which require 600+ conversions/month).
How much should FinTech companies spend on marketing technology?
The 2026 benchmark is 22.4% of total marketing budget allocated to martech, though this figure has declined 12% year-over-year. CMOs are simultaneously increasing AI allocation to 15.3% of budgets while seeking to consolidate their tool stacks — the average enterprise runs 62 tools, but 86% of CMOs prefer fewer, more integrated platforms.
Do interactive dashboards outperform static reports?
Yes. Interactive marketing dashboards increase stakeholder engagement by 48% compared to static reports in financial services. Real-time, self-serve dashboards enable faster decision-making, more frequent budget reallocation, and stronger cross-functional alignment between marketing and finance teams.
What is the ROI of implementing marketing dashboards in FinTech?
Organizations implementing comprehensive BI platforms report ROI as high as 184% (Manulife case study). Multi-touch attribution dashboards specifically drive 14–36% CPA improvement and 19% ROI lift. The caveat is that ROI depends on data integration quality and team proficiency — only 11% of banking teams fully understand GA4 analytics.
Sources
marketingltb.com — Finance Marketing Statistics 2026
cufinder.io — FinTech Industry Marketing Benchmarks 2026
10fold.com — Fintech Marketing Metrics 2026
marketingbanks.com — 2025 Banking Marketing Performance Study
innovationvista.com — Finance Analytics Maturity Survey 2026
knowledgelib.io — Marketing Technology Spending Benchmarks 2026
ridleyco.uk — Attribution in Regulated Finance
dataally.ai — Fintech Marketing Trends for 2026
intenthq.com — State of Martech Report 2025
latentview.com — Marketing Analytics for Financial Services


