



Table of contents
Franchise systems that centralize analytics across locations grow up to 74% faster than fragmented networks. This page compiles the most current franchise dashboard and reporting statistics — covering adoption rates, KPI benchmarks, automation savings, and predictive analytics trends shaping multi-location growth marketing performance management in 2026.
Key Takeaways
- 62.4% of the franchise operations platform market is software (including analytics dashboards), growing at 12.1% CAGR through 2034
- Franchises with centralized analytics grew up to 74% faster than fragmented networks in 2025
- 41% of franchisors cite data and analytics as their biggest technology priority
- Reporting automation reduces manual effort by 60–80% within the first quarter of implementation
- 58% of franchise systems have implemented predictive analytics models for performance forecasting
- Regional franchise systems (50–200 locations) show the highest analytics adoption growth at 89% year-over-year
- AI-powered review automation cuts reporting time by up to 89%, from 90 minutes to 10 minutes per location
Franchise Dashboard Adoption at a Glance
| Metric | Value | Source |
|---|---|---|
| Franchise ops platform software share | 62.4% of market (2025) | Dataintelo |
| Platform market CAGR (2025–2034) | 12.1% | Dataintelo |
| Centralized analytics growth advantage | Up to 74% faster | Autymate |
| Franchisors prioritizing data/analytics | 41% | Gitnux |
| AI adoption in franchise systems | 9.5% current, 72% planned within 3 years | Gitnux |
| Predictive model implementation rate | 58% | OS For Your Business |
| Manual reporting effort reduction | 60–80% | OS For Your Business |
| Regional system adoption growth (YoY) | 89% | OS For Your Business |
Franchise Analytics Market Size and Adoption Trends
The franchise operations platform market is expanding rapidly, with software components (including analytics dashboards, CRM, compliance tools, and royalty engines) commanding a 62.4% share in 2025, growing at a 12.1% CAGR through 2034 according to Dataintelo. This growth reflects how mission-critical real-time reporting has become for multi-location operators.
Franchises that centralized their analytics, SEO, and social data in 2025 grew up to 74% faster than fragmented networks, per Autymate's 2026 franchise analytics guide. Meanwhile, 41% of franchisors cite data and analytics as their single biggest technology priority (Gitnux), ahead of customer-facing tools and operational automation.
Adoption patterns differ by network size. Regional franchise systems with 50–200 locations show the highest analytics adoption growth rate at 89% year-over-year, per OS For Your Business. Larger enterprise systems already have mature reporting stacks, while smaller operators often lack the budget — mid-market networks are in the steepest adoption curve.

Essential Franchise KPIs Tracked in Dashboards
Modern franchise dashboards converge on a standard set of KPIs. According to Qvinci's franchisor dashboard guide, the five essential KPIs every franchise dashboard should track are Revenue Growth, EBITDA Margin, Labor Cost Percentage, Prime Cost, and Same-Store Sales. These cover financial health, operational efficiency, and growth trajectory across the network.
FieldPie's 2026 benchmark analysis adds that franchise metrics capture raw data (sales volume, labor cost, customer count), while KPIs filter that into actionable signals tied to business outcomes — a distinction dashboard design must respect. Claromentis emphasizes that benchmarking and comparing KPIs across the network adds the context needed to rule out extraneous factors in location-level analysis.
| KPI | What It Measures | Typical Benchmark Range |
|---|---|---|
| Revenue Growth | Year-over-year sales increase per location | 3–8% YoY for mature networks |
| EBITDA Margin | Profitability before interest, taxes, depreciation | 15–25% for service, 8–15% for QSR |
| Labor Cost % | Labor expense as a share of revenue | 25–35% (varies by vertical) |
| Prime Cost | COGS + labor as % of revenue | 55–65% for food-service franchises |
| Same-Store Sales | Revenue change at locations open 12+ months | 2–5% positive growth signals health |
Reporting Automation and ROI Statistics
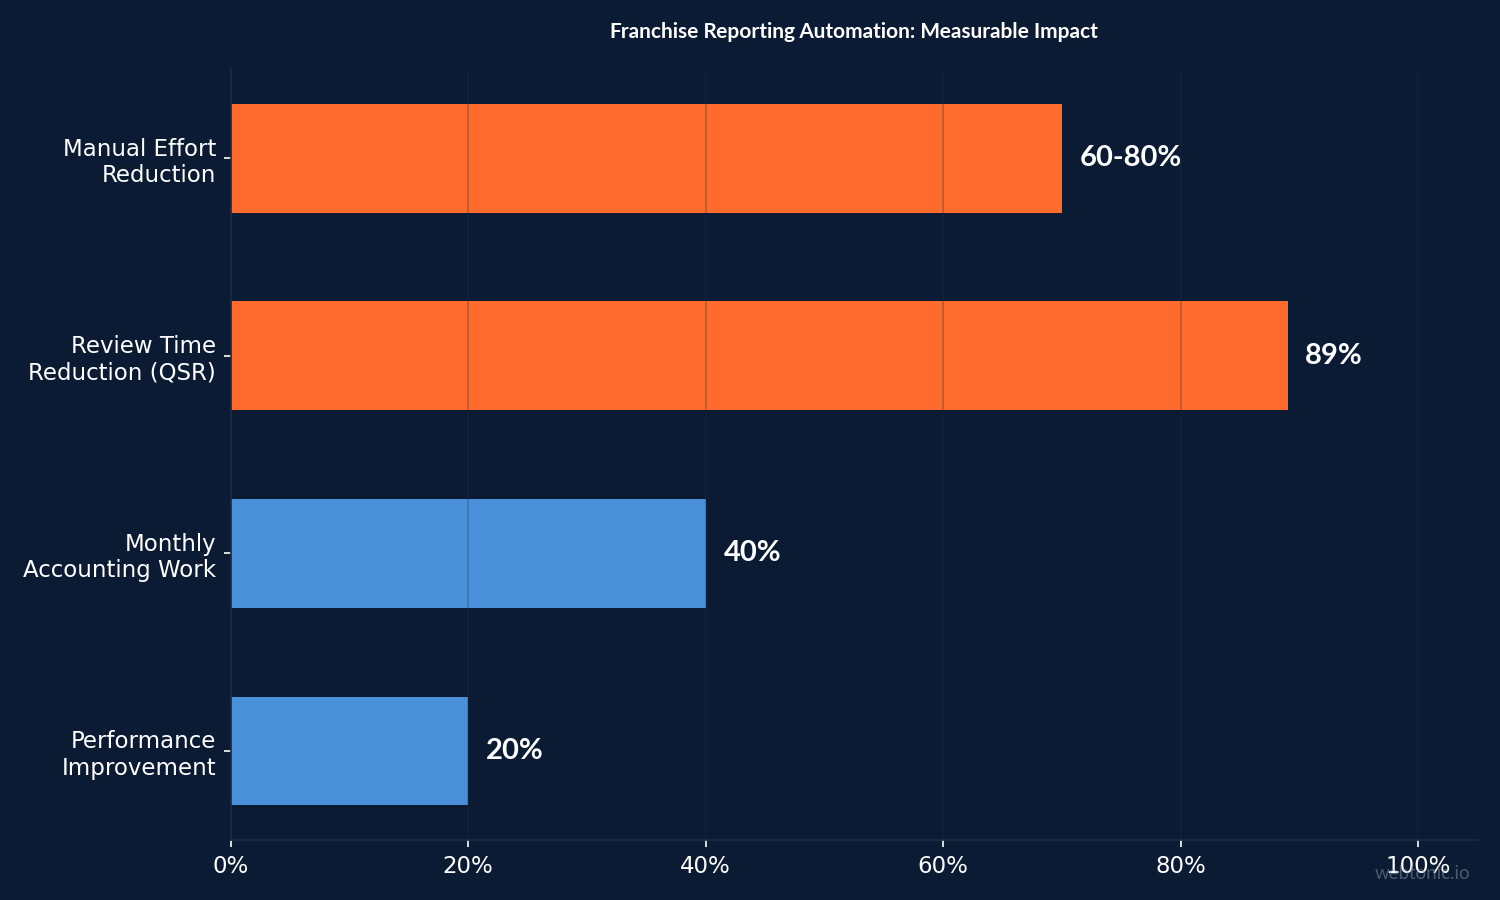
Automated reporting delivers measurable returns across franchise networks of every size. OS For Your Business reports that most organizations see a 60–80% reduction in manual reporting effort within the first quarter of full automation implementation. For large networks, the savings compound dramatically.
A 1,000+ location QSR franchise cut review time by 89% — from 90 minutes to 10 minutes per location after deploying AI-powered accounting automation, according to a Satva Solutions case study. At scale, this translates to thousands of hours saved monthly across the network.
At the mid-market level, a 15-store Jimmy John's operator saved $31,000 in labor costs and eliminated 20+ hours per week of manual data entry by automating financial reporting across all locations (Autymate). Separately, Minuteman Press achieved a 20% increase in franchise performance after streamlining its reporting and onboarding processes through automated dashboards (Autymate case study).
Franchisor-side, Autymate's franchisor platform reports a 40% reduction in monthly accounting work through automated daily data ingestion from QuickBooks, POS, and payroll systems across the network.
Predictive Analytics and AI in Franchise Dashboards
The shift from descriptive to predictive reporting is accelerating. 58% of franchise systems have implemented predictive analytics models for franchisee performance forecasting, per OS For Your Business. However, overall AI adoption in franchising remains early-stage: only 9.5% of U.S. franchise businesses currently use AI, though 72% plan to adopt it within three years (Gitnux).
71% of larger restaurant franchise operations are already using data-driven BI tools, compared to 53% of smaller venues, according to Push Operations' 2026 BI report. This gap underscores how scale justifies the investment — once a franchise passes roughly 50 locations, the cost of not having centralized analytics exceeds the cost of deployment.
AI-powered anomaly detection is one of the fastest-growing dashboard features. Rather than manually reviewing hundreds of locations, automated alerts flag when a location deviates beyond baseline thresholds, enabling immediate field team intervention (Autymate).
Digital Marketing Reporting for Franchise Networks
Marketing dashboards are a distinct reporting layer within the franchise analytics stack. 72% of franchises allocate significant budget to local SEO, and the average PPC ROI for franchise campaigns is 3.5x, according to BizIQ's 2026 franchise marketing statistics. These metrics need to roll up from individual locations into a network-wide view.
Marketing-specific dashboard platforms like Franify enable franchise owners to review digital advertising results in real-time dashboards that highlight key insights and trends for every location (Franify). The challenge is unifying data from Google Ads, Meta, local listings, email, and organic channels into a single actionable view.
Franchises with unified analytics dashboards make faster marketing decisions and are better positioned to reallocate budget across locations based on real-time performance data, per Marketing LTB's 2026 franchise marketing statistics. Without centralized dashboards, local performance gaps can persist for months before the franchisor identifies them.
Best Practices for Franchise Dashboard Implementation
- Standardize KPIs network-wide — Use the same definitions for revenue growth, labor cost %, and same-store sales across all locations to enable fair benchmarking (Qvinci).
- Automate data ingestion daily — Pull from POS, payroll, and accounting systems automatically rather than relying on franchisee-submitted reports, which introduce delays and inconsistencies.
- Benchmark across the network — Compare each location's performance against system averages and top-quartile operators to surface actionable improvement opportunities (Claromentis).
- Deploy anomaly detection — AI-powered alerts that flag deviations from baseline save weeks compared to manual monthly reviews (Autymate).
- Integrate marketing and operations data — Unify ad spend, lead volume, data intelligence, and unit economics in a single dashboard to connect marketing ROI with location-level profitability.
- Keep reports short and actionable — One-page scorecards with clear action items drive higher franchisee engagement than dense multi-tab reports.
- Measure dashboard adoption itself — Track how often franchisees log in and act on data. If adoption is not measured, it is not managed (Gerson Advisory Services).
Franchise Dashboard Platform Landscape
The franchise analytics market has matured significantly, with purpose-built platforms replacing generic BI tools. Franchise-specific dashboard providers like ZorScore, FranMetrics, ProfitKeeper, and Autymate now offer real-time KPI tracking, automated scorecards, and AI-powered insights designed specifically for multi-location operators. These platforms integrate directly with franchise POS systems, payroll providers, and accounting software — eliminating the data consolidation bottleneck that plagued earlier spreadsheet-based reporting.
The platform market segments into three tiers. Enterprise platforms (ZorScore, FranchiseSEE, The Retail Score) serve 200+ location networks with advanced benchmarking, predictive analytics, and compliance reporting. Mid-market solutions (Qvinci, Autymate, metiRi) target 20–200 location systems with automated financial consolidation and KPI scorecards. Marketing-specific platforms (Franify, TapClicks, Swydo) focus on unifying digital advertising data across locations with automated client-facing reports.
A key differentiator is franchisee-facing dashboards versus franchisor-only reporting. Systems that give franchisees direct access to their own performance data — benchmarked against network averages — see higher engagement and faster improvement cycles. The most effective platforms provide both: franchisor-level network intelligence and franchisee-level self-service scorecards.
How Franchise Analytics Compares to Other Industries
Franchise analytics adoption trails some sectors but leads others. While e-commerce and SaaS businesses have near-universal analytics adoption, franchise systems face the unique challenge of standardizing data across independently operated locations with different POS systems, accounting software, and operational processes.
The franchise industry's 12.1% CAGR in operations platform spending outpaces the broader enterprise BI market (approximately 8–10% CAGR), reflecting the catch-up investment required. Franchise networks that solve the data standardization problem gain a disproportionate advantage: the 74% faster growth rate for centralized systems is significantly higher than typical analytics-driven improvements in industries where data is already consolidated by default.
Restaurant franchises are particularly advanced in dashboard adoption, driven by the tight-margin, high-volume economics that make real-time labor cost tracking and same-store sales monitoring essential. Service-based franchises (cleaning, home repair, fitness) are in an earlier adoption phase, with greater emphasis on lead tracking and performance creative analytics than financial benchmarking.
Franchise Analytics Adoption by Network Size
| Network Size | BI/Dashboard Adoption Rate | Key Characteristics |
|---|---|---|
| Small (1–49 locations) | ~53% using formal BI tools | Budget-constrained; often rely on spreadsheets and basic POS reports |
| Regional (50–200 locations) | 89% YoY adoption growth | Steepest adoption curve; migrating from manual to automated reporting |
| Enterprise (200+ locations) | ~71% using advanced BI | Mature reporting stacks; focus on predictive analytics and AI augmentation |
Frequently Asked Questions
What KPIs should a franchise dashboard track?
The five essential KPIs are Revenue Growth, EBITDA Margin, Labor Cost Percentage, Prime Cost, and Same-Store Sales. These cover financial health, operational efficiency, and growth signals. Add marketing-specific metrics like PPC ROI, lead volume, and paid search benchmarks for a complete picture.
How much time does automated franchise reporting save?
Most organizations see a 60–80% reduction in manual reporting effort within the first quarter of implementation. A 1,000+ location QSR franchise cut per-location review time from 90 minutes to 10 minutes — an 89% reduction.
What percentage of franchises use analytics dashboards?
71% of larger franchise operations use formal BI tools, compared to 53% of smaller venues. Regional systems (50–200 locations) show the fastest adoption growth at 89% year-over-year.
How does centralized analytics impact franchise growth?
Franchises that centralized their analytics in 2025 grew up to 74% faster than fragmented networks. Centralized dashboards enable faster marketing decisions, real-time budget reallocation, and earlier identification of underperforming locations.
What is the ROI of franchise dashboard software?
A 15-store Jimmy John's franchise saved $31,000 in labor costs and 20+ hours per week through reporting automation. Minuteman Press saw a 20% increase in franchise performance after implementing automated dashboards. The ROI depends on network size, but mid-market operators typically see payback within 3–6 months. See our Google Ads strategy guide for more on tracking marketing ROI.
Sources
dataintelo.com/report/franchise-operations-platform-market
autymate.com/blog/franchise-analytics-the-complete-guide-to-growing-your-franchise-with-data-2026
gitnux.org/ai-in-the-franchise-industry-statistics
osforyour.business/franchise-operations/ai-adoption-in-franchise-operations
qvinci.com/5-kpis-every-franchisor-dashboard-needs
satvasolutions.com/case-study/ai-powered-accounting-automation-qsr
pushoperations.com/blog/why-restaurant-franchise-operators-cant-afford-to-ignore-business-intelligence-in-2026
biziq.com/blog/franchise-marketing-statistics-2026
fieldpie.com/blog/franchise-performance-metrics
claromentis.com/blog/top-kpis-you-should-track-in-your-franchise-performance-dashboards


