



Table of contents
Dental clinics that treat online visibility as a strategic investment consistently outpace those relying on word-of-mouth alone. 71% of prospective patients run a web search before booking an appointment, and the gap between top-performing offices and the average is widening every year. This page compiles 47+ verified data points covering acquisition cost, channel ROI, review influence, and budget allocation — everything a practice owner or agency needs to benchmark performance in 2026.
Key Takeaways
- 71% of individuals search online before booking a dental appointment, making web presence the primary driver of new-patient flow.
- Average patient lifetime value ranges from $3,000 to $40,000 depending on the treatment segment, producing LTV-to-CAC ratios of 8:1 or higher.
- 83% of Americans rely on online reviews to evaluate a dentist, and 52% will only consider a provider with 10+ ratings.
- Practices that allocate 4–12% of revenue to promotion see measurably higher year-over-year growth than those spending less.
- SEO delivers the highest long-term ROAS (5:1 to 20:1) after an initial 6–12 month investment window.
- Complete Google Business Profiles generate 7× more calls and up to $75K additional annual revenue per location.
Dental Online Promotion Benchmarks at a Glance
| Metric | Benchmark | Source |
|---|---|---|
| Average CPC (Google Ads) | $2.50–$6.85 | Zipdo / CuFinder 2026 |
| Google Ads CTR | 4.85–12.1% | Zipdo / CuFinder 2026 |
| Website Conversion Rate | 4.2% | CuFinder 2026 |
| Landing Page CVR | 12.5% | CuFinder 2026 |
| Cost Per Lead (Google Ads) | $116.10 | CuFinder 2026 |
| Cost Per Lead (Facebook) | $28–$80 | CuFinder / AdLibrary 2026 |
| Patient Retention Rate | 78% | CuFinder 2026 |
| Annual Patient Churn | 18% | CuFinder 2026 |
Patient Acquisition Cost by Channel
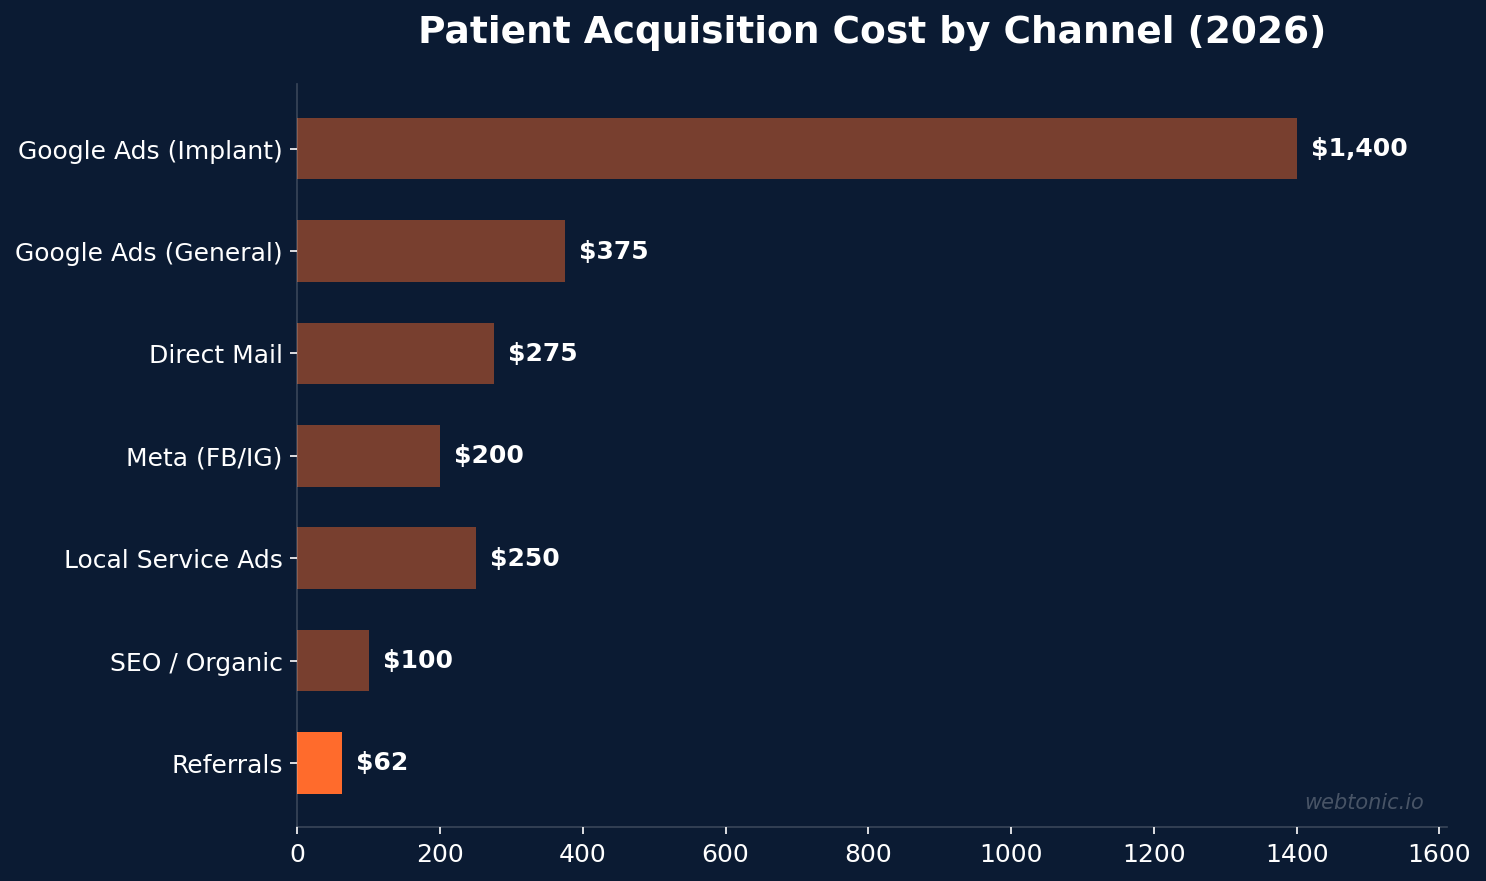
How much does it cost to win a new patient through each promotional channel? The range is enormous — from $25–$100 via referral programs to $800–$2,000 for implant-focused search ads. Understanding these benchmarks lets clinics allocate budget where the return-on-investment is strongest.
| Channel | Cost Per New Patient | Notes |
|---|---|---|
| Referral Programs | $25–$100 | Lowest cost; 80% of new patients originate here |
| SEO / Organic | $50–$150 | Requires 6–12 months; ROAS 5:1–20:1 |
| Local Service Ads | $150–$350 | Pay-per-lead model; high intent |
| Meta (FB / IG) | $100–$300 | Best for cosmetic procedures; demand creation |
| Direct Mail | $150–$400 | 4.5× higher open rate than email |
| Google Ads (General) | $250–$500 | CPA $150–$200 for general dentistry |
| Google Ads (Implants) | $800–$2,000 | High-value cases; LTV offsets cost |
Patient Lifetime Value and ROI Ratios
The reason dental online promotion delivers exceptional returns is patient lifetime value. Even at a $500 acquisition cost, a general preventive patient with a $4,000 LTV produces an 8:1 return. Implant cases acquired at $1,500 can yield a 16:1 return over the relationship.
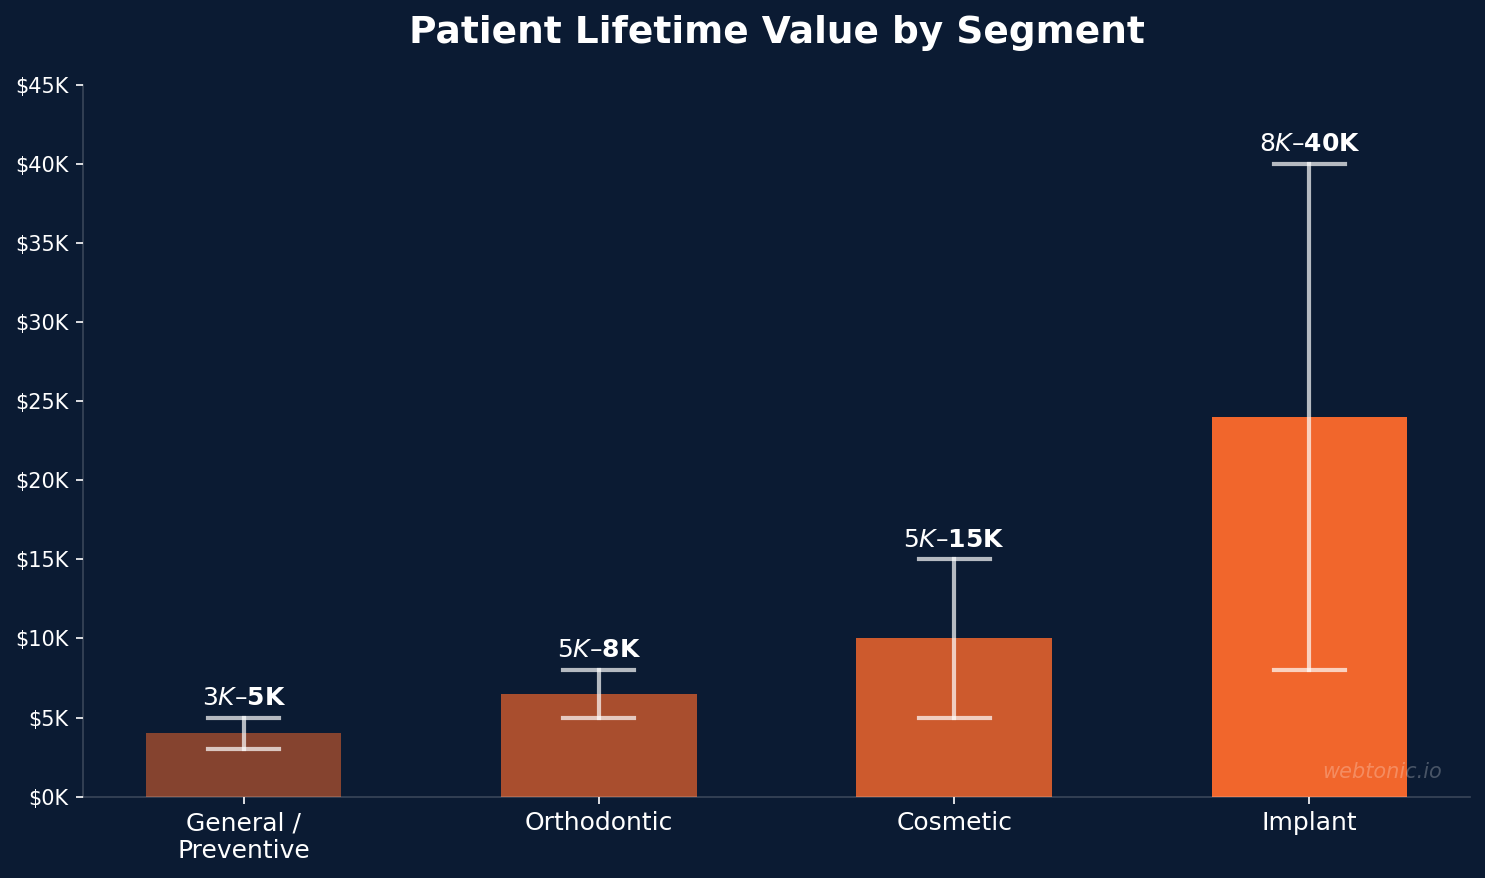
- General/preventive patient LTV: $3,000–$5,000 over 5–7 years of biannual visits.
- Cosmetic patient LTV: $5,000–$15,000 (initial procedure plus maintenance and referrals).
- Implant patient LTV: $8,000–$40,000 (initial case, follow-up, and additional procedures).
- Orthodontic patient LTV: $5,000–$8,000 (treatment plus retention phase).
- A healthy LTV-to-CAC ratio of 3:1 or higher indicates a sustainable growth engine. Above 5:1 may signal under-investment.
Online Reviews and Reputation Influence
Online reputation is now the single largest trust signal for prospective patients. 8 out of 10 Americans use reviews as their first step in choosing a new dentist, and the effect on booking decisions is measurable.
- 83% of Americans rely on online reviews to evaluate a provider (Dentaly).
- Google is the most trusted platform, used by 85% of respondents when selecting a dentist.
- 52% of individuals will only consider a provider with at least 10 reviews.
- 95% think twice after reading negative feedback, yet only 35% of dentists respond to unfavorable ratings.
- 77% of patients read reviews before choosing (Arch Dental Marketing).
- Top-performing profiles on Google carry 100–300+ reviews with ongoing activity.
Budget Allocation and Spending Benchmarks
How much should a clinic spend on promotion? The answer depends on practice size, maturity, and growth goals — but the data reveals clear patterns.
| Practice Stage | Monthly Budget | % of Revenue |
|---|---|---|
| Solo ($500K–$800K rev.) | $2,000–$4,000 | 4–6% |
| Two-Doctor ($1.2M rev.) | $5,000–$7,000 | 5–7% |
| Startup (Year 1) | $6,000–$14,000 | 15–20% |
| Multi-Location Group | $10,000–$25,000+ | 6–12% |
- 54% of practices spend between $1,000 and $5,000 per month on online promotion (Direction).
- Offices increasing budgets by 12% year-over-year are outpacing peers in new-patient volume (Zipdo).
- The 2025 DAG Financial Survey (224 clinics) found that those re-investing in advertising saw notably higher revenue growth compared to those that did not (Dental Accounting Group).
- Average clinics added $99,965 of new revenue in 2024, with promotion-heavy offices adding significantly more.
Website Performance and Mobile Behavior
A clinic's website is the conversion hub for every online channel. These data points reveal where most sites under-perform — and where optimization pays off fastest.
- 68.5% of traffic is mobile, yet 72% of dental websites have a mobile bounce rate exceeding 50% (Zipdo).
- Overall bounce rate averages 55.4%; mobile bounce rate sits at 61.2% (CuFinder).
- Average website CVR is 4.2%, but dedicated landing pages convert at 12.5% — nearly 3× higher.
- Call-only ad CVR reaches 18.2%, making it the highest-converting format for local providers.
- Pages with video content show a 40% higher conversion rate than those without.
- 60% of individuals use a mobile device to find a dentist, and 45% of mobile users book directly from the site.
Paid Advertising Performance Metrics
Paid search and social channels deliver the fastest path to new patients, but performance varies dramatically by format, keyword, and service type. These are the benchmarks dental offices should target when evaluating their paid search campaigns.
- Google Ads CPC for dental keywords ranges from $2.50 to $6.85, with 15% of competitive keywords exceeding $10 per click (Zipdo).
- Google Ads CTR for dental reaches 12.1%, which is 3 percentage points higher than the all-industry average — indicating strong intent from searchers.
- 75% of dental offices use Google Ads, and 60% of those report a positive return on investment.
- Facebook Ads CPC for dental averages $1.45, with a conversion rate of 1.8% and an average CPL of $80.55 (CuFinder).
- 40% of offices run Facebook Ads for local lead generation, and 25% see ROI within the first three months.
- Call-only ad conversion rates reach 18.2% — the highest conversion format available for local providers.
- 35% of dental website traffic comes from paid search, making it the second-largest traffic source after organic.
Dental Industry Growth and Spending Trends
The dental industry's investment in online promotion is accelerating, driven by increasing competition for patient attention and the proven economics of multi-channel strategies.
| Trend | Data Point | Implication |
|---|---|---|
| Budget Growth | 12% annual increase in ad spend | Rising competitive baseline |
| Mobile Search Growth | 35% YoY increase in mobile dental queries | Mobile-first optimization mandatory |
| Average New Revenue Added | $99,965 per clinic in 2024 | Growth is achievable with right spend |
| Video Adoption | 40% higher CVR with video content | Video should be core to web strategy |
| Social Media Presence | 97% use Facebook, 45% use TikTok | Platform diversification is underway |
- Dental advertising costs rose by an average of 8–12% across all channels in the last year, reflecting increased competition and platform auction pressure.
- Only 26% of dental offices offer online booking, creating a conversion bottleneck that undercuts ad performance. Offices adding online scheduling see immediate lift in conversion rates.
- SEO takes 6–12 months to produce returns, but delivers the strongest long-term economics at ROAS of 5:1 to 20:1 once momentum is established.
- 82% of patients say personalized follow-up messages increase their likelihood to return, highlighting how post-acquisition communication directly impacts retention and LTV.
Local Search and Google Business Profile Data
For neighborhood-focused providers, local visibility on Google is the growth engine. The gap between optimized and unoptimized profiles is staggering.
- 95% of dental offices already have a Google Business Profile, but only 15–20% achieve full completion (PractiWrite).
- Fully completed profiles are 70% more likely to attract location visits and 50% more likely to drive bookings.
- Top 10% of profiles generate 7× more clicks and calls and enjoy up to 18× more search visibility.
- These top performers carry 30–50 photos, 100+ reviews, and regular Google Post activity.
- 95% of offices ranking in the local Maps pack have full profile completion.
- Optimized profiles contribute up to $75,000 in additional annual revenue per location.
Channel ROI Comparison for Dental Offices
Not every promotional channel delivers the same return. This comparison helps dental clinics prioritize spend based on cost-efficiency and scalability.
| Channel | Typical ROAS | Time to ROI | Best For |
|---|---|---|---|
| SEO / Organic | 5:1–20:1 | 6–12 months | Long-term patient flow |
| Google Ads | 4:1–8:1 | Immediate | High-intent searches |
| Meta Ads (FB/IG) | 2.8:1–5:1 | 1–3 months | Cosmetic demand creation |
| Email Campaigns | 36:1–44:1 | Immediate | Retention and reactivation |
| Referral Programs | 10:1+ | Ongoing | Trust-based acquisition |
What Top-Performing Clinics Do Differently
Data from audits of 2,000+ dental Google Business Profiles and the 2025 DAG Financial Survey reveals what separates high-growth offices from the rest.
- They invest in multi-channel strategies. Relying on a single channel caps growth. The strongest clinics combine paid search, organic optimization, and reputation management.
- They track patient-level ROI. 75% of offices use Google Ads, but only 60% report a positive return — the gap is attribution. Clinics that tie ad spend to booked appointments make faster, better decisions.
- They pre-schedule the next visit. Pre-scheduled patients return at 80–90% versus 35–45% for those who leave without an appointment, making in-office booking the cheapest retention lever available.
- They respond to reviews. Only 35% of dentists respond to negative feedback, yet nearly 80% of prospective patients expect a response. Closing this gap lifts trust and conversion.
- They maintain Google Business Profiles actively. Monthly posts, fresh photos, and Q&A engagement keep profiles in the local pack where 95% of ranked offices have full completion.
Choosing a Dental Marketing Partner
Many dental practices turn to external partners to implement effective dental marketing strategies. Whether hiring a dental marketing company or building an in-house team, the decision should be guided by the data above. The best dental marketing companies combine local SEO expertise with paid search management and social media marketing under one roof. An effective dental marketing approach requires consistent execution across multiple channels — search engine optimization, Google Business Profile management, content creation, and media marketing through platforms like Facebook and Instagram.
- Dental marketing requires a minimum 6-month commitment for SEO and content strategies to produce measurable returns.
- The best-performing dental marketing strategies combine 3–4 channels rather than relying on a single tactic.
- Practices working with a dedicated dental marketing company report 30–50% faster growth than those managing campaigns internally without specialized expertise.
- When evaluating dental marketing companies, prioritize those with documented ROAS, dentist-specific case studies, and transparent reporting on patient acquisition cost and lifetime value.
Related reading
- Evaluating Dental Account-Based Marketing ROI
- Education & Coaching Digital Marketing Statistics: 2026 Trends, Benchmarks & Strategy Data
- Electrical Digital Marketing Statistics 2026
- Marketing Strategy Consulting services at Web Tonic
FAQ
How much should a dental practice spend on online promotion?
Most offices allocate 4–12% of gross revenue, which translates to roughly $2,500–$14,000 per month depending on size. Startups in their first year often invest 15–20% to build initial patient volume, while established multi-location groups typically operate at 6–12%. The key metric is cost per acquired patient relative to lifetime value, not the percentage itself.
Which promotional channel delivers the best ROI for dentists?
SEO delivers the highest long-term ROAS at 5:1–20:1, but requires a 6–12 month runway. For immediate results, Google Ads produces a 4:1–8:1 return on qualified, high-intent searches. Email campaigns offer the best retention ROI at $36–$44 for every $1 spent. A balanced strategy combining all three outperforms any single-channel approach.
How important are online reviews for dental patient acquisition?
Extremely. 83% of Americans use online reviews to evaluate a dentist, 85% rely on Google specifically, and 52% will not consider a provider with fewer than 10 ratings. Negative reviews deter 95% of prospective patients — yet only 35% of dentists respond to them. Active review management is one of the highest-impact, lowest-cost growth tactics available.
What is the average patient lifetime value for a dental clinic?
It varies dramatically by treatment type. General/preventive patients average $3,000–$5,000 over 5–7 years. Cosmetic cases reach $5,000–$15,000, orthodontic patients sit at $5,000–$8,000, and implant patients can generate $8,000–$40,000 in total revenue. These figures make even a $500 acquisition cost highly profitable when viewed through an LTV lens.
Is Google Business Profile optimization really worth the effort?
Yes — the data is unambiguous. Fully completed profiles are 70% more likely to drive location visits and 50% more likely to convert into bookings. Top 10% profiles get 7× more calls and up to 18× the search visibility of incomplete listings. Given that 95% of offices ranking in the Maps pack have full completion, it is effectively a requirement for local discoverability.
Sources
zipdo.co/dental-marketing-statistics
cufinder.io/blog/benchmarks/dentists
dentalprice.ai/resources/guides/dental-marketing-roi
direction.com/dental-marketing-budget-costs
practiwrite.com/dental-practice-google-business-profile-statistics
dentaly.org/us/research/dentist-reviews-online
archdentalmarketing.com/blog/dental-marketing-statistics
dentalaccountingpros.com/dag-financial-survey-dashboard
petejohnsoniv.com/blog/dental-marketing-benchmarks-2026


