



Table of contents
"Customer retention rate" is reported three incompatible ways across 2026 benchmark data, and comparing across them without adjusting is the single most common retention-reporting mistake. Churn rate, net revenue retention and repeat purchase rate all describe loyalty, but they are built from different denominators and cannot share one target number.
Key Takeaways
- Median annual SaaS churn is 3.22% in 2026 (Recurly).
- Top-quartile SaaS churn is 1.78% or below.
- Ecommerce subscription churn runs higher, at a 4.25% median.
- Voluntary SaaS churn is 2.16%; involuntary churn is 1.06%.
- Enterprise accounts (USD 250+ ARPC) see involuntary churn of just 0.18%.
- Median net revenue retention across 105 public SaaS companies is 122% (Cust).
- Top-decile net revenue retention clears 155%.
- Median gross revenue retention is 84% (Benchmarkit CY-2025).
- 40% of SaaS companies at USD 15-30M ARR post negative net churn (ChartMogul).
- Chewy's Autoship customer sales are 84.6% of net sales in Q2 2026.
- That repeat-purchase measure grew 9.3% year over year.
- Median CAC payback period is 16 months across 342 SaaS companies (Benchmarkit).
- Median LTV:CAC ratio is 4.1x.
- 38% of consumers prefer pausing a subscription over canceling it (Recurly).
- Education has the highest voluntary churn of any Recurly vertical, at 3.30%.
Three measurements, one word: "retention"
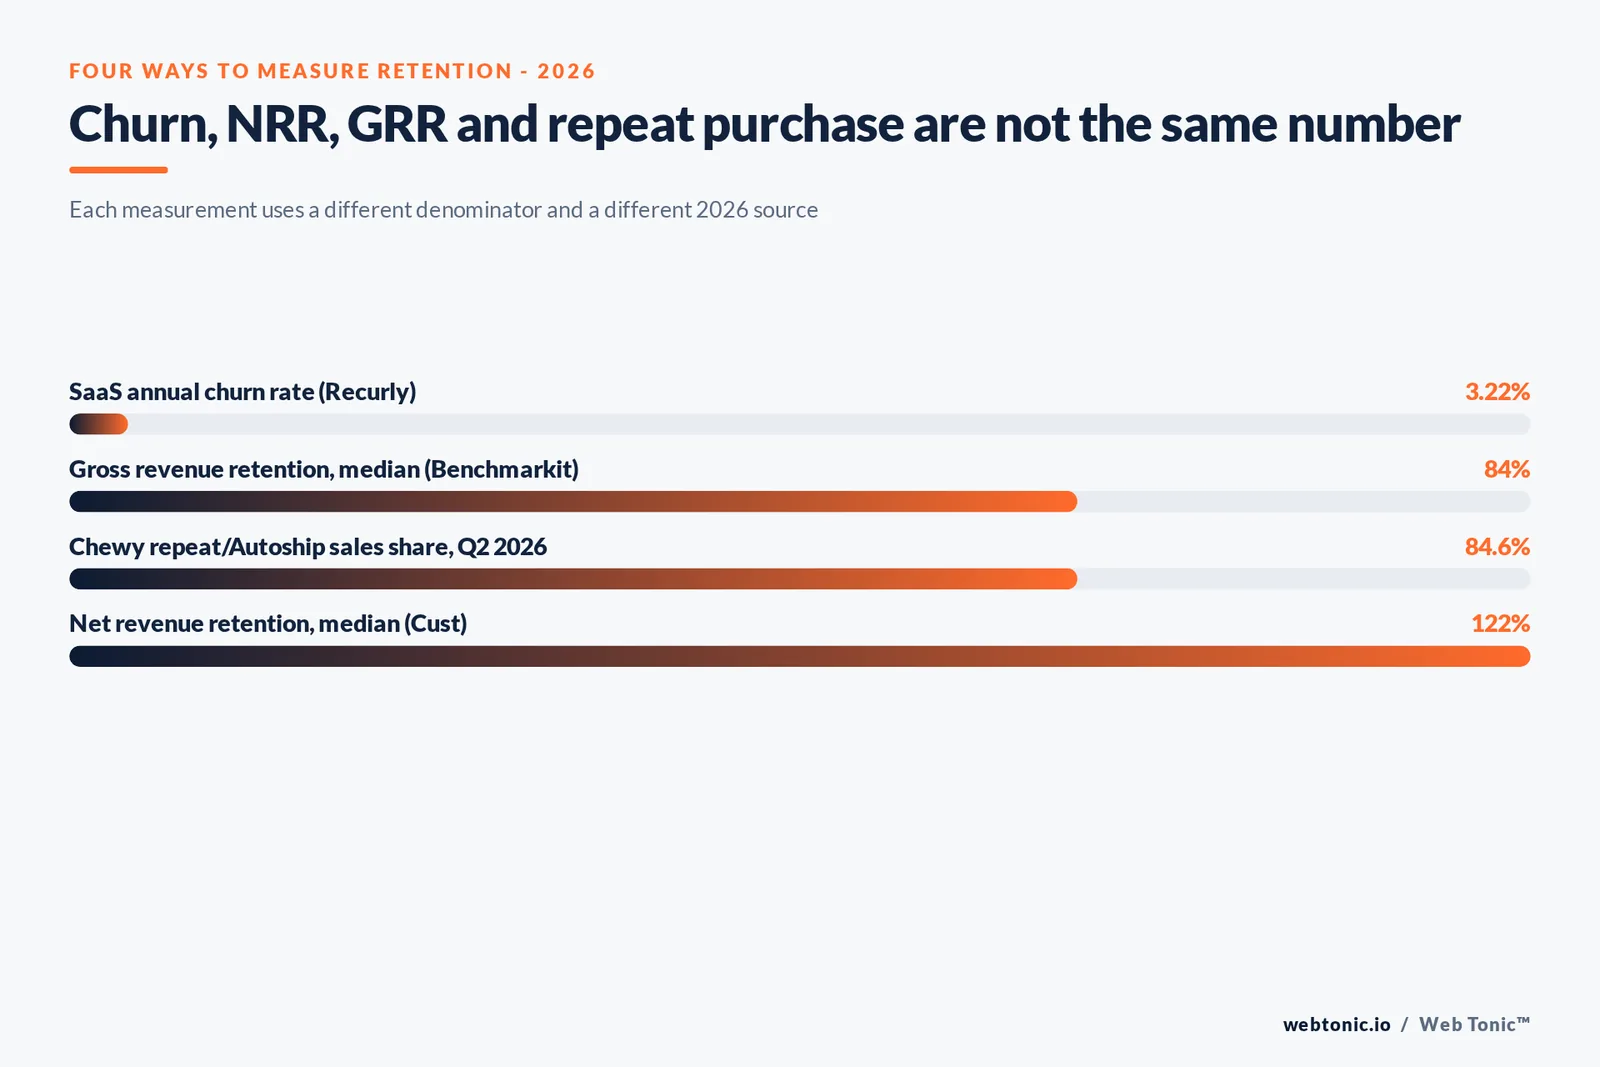
Churn rate, net/gross revenue retention and repeat purchase rate all get reported under the single banner of "customer retention," and benchmark tables that blend them without labeling the method produce comparisons that are not valid. Recurly's 2026 churn data, Cust's SEC-sourced retention data, and Chewy's own Q2 2026 earnings call each report a different kind of retention, and this page keeps them separate on purpose.
| Measurement | What it counts | 2026 benchmark | Source |
|---|---|---|---|
| Churn rate (SaaS) | Share of customers/revenue lost | 3.22% median annual | Recurly |
| Net revenue retention | Churn netted against expansion | 122% median | Cust |
| Gross revenue retention | Churn only, no expansion credit | 84% median | Benchmarkit |
| Repeat purchase / Autoship rate | Share of sales from repeat buyers | 84.6% (Chewy, Q2 2026) | Chewy earnings call |
Churn rate: the SaaS baseline
Recurly's July 2026 network data puts median annual SaaS churn at 3.22% (voluntary 2.16%, involuntary 1.06%), with top-quartile performers at 1.78% or below. By vertical, Business and Professional Services churns at 3.44%, Travel, Hospitality and Entertainment at 3.91%, Digital Media at 4.14%, Ecommerce at 4.25%, and Education at 4.99% - the highest voluntary rate in the dataset at 3.30%, pointing to an engagement problem rather than a billing one.
Recurly's guidance is blunt about thresholds: below 2% annual churn is strong performance almost anywhere, 2% to 4% is where most well-run subscription businesses sit, and above 5% is worth investigating regardless of vertical.
| Vertical (Recurly, 2026) | Total annual churn | Voluntary | Involuntary |
|---|---|---|---|
| SaaS (overall) | 3.22% | 2.16% | 1.06% |
| Business & professional services | 3.44% | 2.27% | 1.18% |
| Travel, hospitality & entertainment | 3.91% | 2.63% | 1.28% |
| Digital media & entertainment | 4.14% | 2.55% | 1.59% |
| Ecommerce (subscription) | 4.25% | 2.87% | 1.38% |
| Education | 4.99% | 3.30% | 1.69% |
Enterprise accounts churn differently, not just less
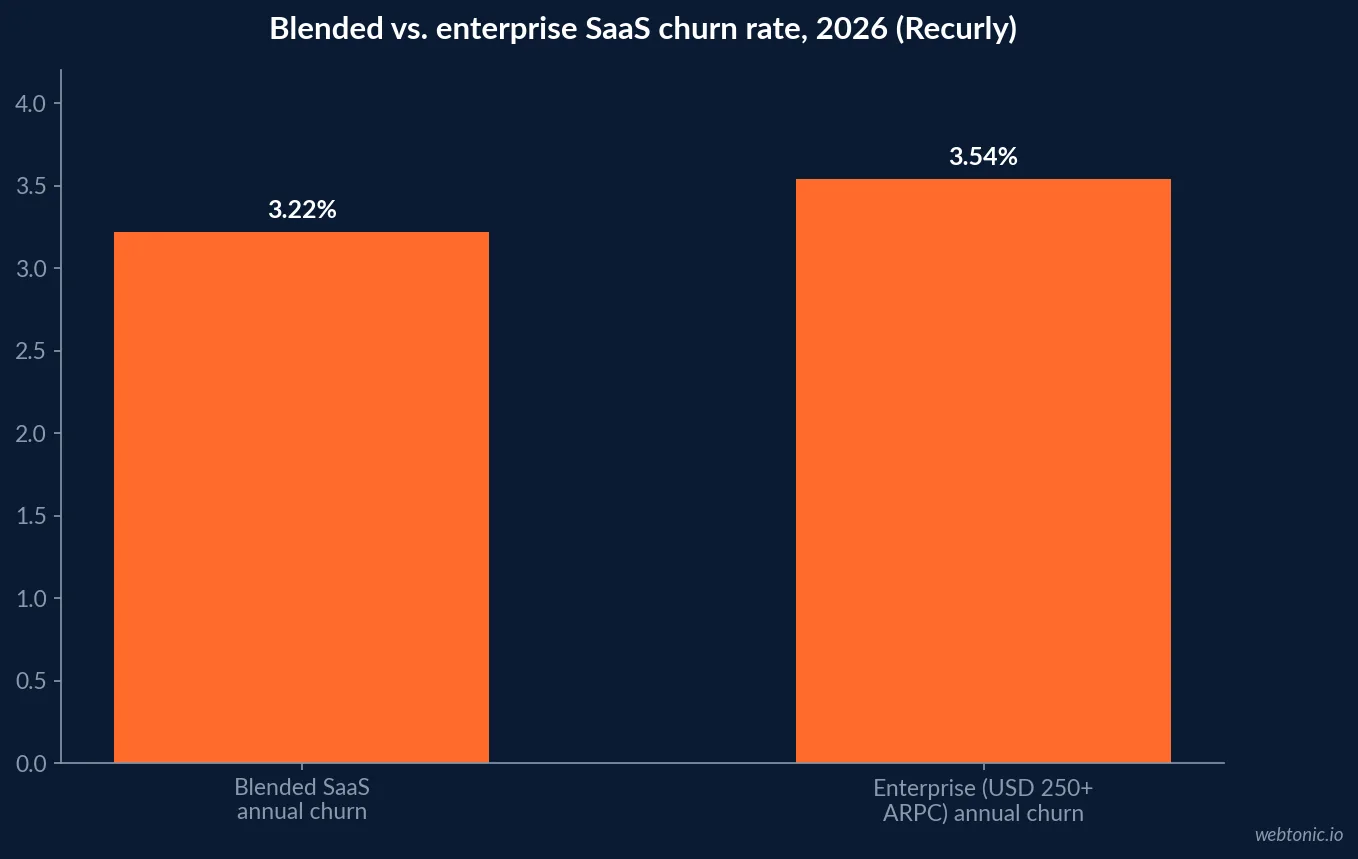
Inside the USD 250-plus average revenue per customer cohort, Recurly reports median annual churn of 3.54% but involuntary churn of only 0.18% - enterprise buyers use better payment methods and fix failed charges before they lapse, so almost all enterprise churn is a genuine decision to leave. A retention program aimed at enterprise accounts should treat involuntary churn as close to zero and put the entire program budget against the voluntary rate.
Net and gross revenue retention: the SaaS finance view
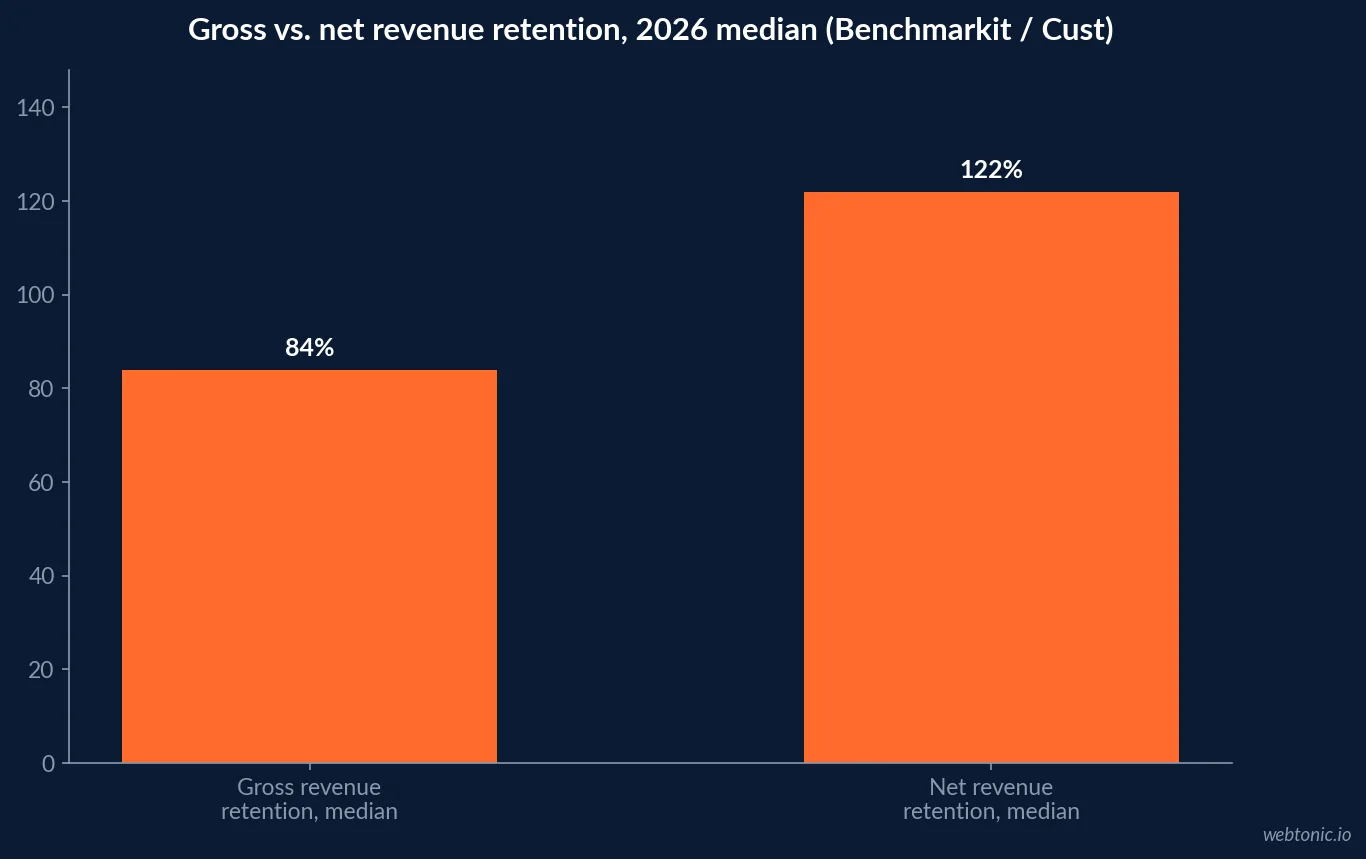
Revenue retention answers a different question than churn rate: not "how many customers left" but "did the revenue base grow or shrink." Cust's dataset of 105 public B2B SaaS companies, built from SEC filings, finds median net revenue retention (NRR) at 122%, with the top decile clearing 155% - companies like CoreWeave and DLocal post NRR above 150% in their most recent disclosed period. Benchmarkit's CY-2025 report puts median gross revenue retention (GRR) at 84% across 342 companies - GRR strips out expansion credit, so the gap between an 84% GRR and a 122% NRR at the same company is almost entirely expansion revenue.
ChartMogul's SaaS Benchmarks Report adds the sharpest version of this idea: 40% of SaaS businesses in the USD 15-30M ARR range already run negative net MRR churn, meaning expansion revenue exceeds churn and contraction combined every month.
| Retention metric (2026) | Median | Top decile/quartile | Source |
|---|---|---|---|
| Net revenue retention | 122% | 155% (top decile) | Cust (105 public SaaS companies) |
| Gross revenue retention | 84% | 91% (top quartile) | Benchmarkit |
| SaaS companies (USD 15-30M ARR) at negative net churn | 40% | - | ChartMogul |
| CAC payback period | 16 months | - | Benchmarkit |
| LTV:CAC ratio | 4.1x | - | Benchmarkit |
Repeat purchase rate: the non-subscription measure
Non-contractual retail and ecommerce cannot use a churn rate at all, because there is no subscription to cancel - retention shows up instead as a repeat purchase rate, the share of sales or customers that come from people who already bought before. Chewy's own Q2 2026 earnings call reports Autoship customer sales of USD 2.8 billion, representing 84.6% of total net sales, growing 9.3% year over year - a genuine repeat/recurring-purchase figure, not a churn rate, and not comparable to the SaaS churn numbers above without translation.
That is also why a pet-replenishment retailer's repeat rate cannot be used as a retail-wide benchmark: most categories do not have a true consumable, recurring-need product at their core the way pet food does.
| Repeat/recurring purchase signal (2026) | Figure | Source |
|---|---|---|
| Chewy Autoship customer sales, share of net sales | 84.6% | Chewy Q2 2026 earnings call |
| Chewy Autoship sales growth, year over year | 9.3% | Chewy Q2 2026 earnings call |
| Chewy total net sales, Q2 2026 | USD 3.33 billion | Chewy Q2 2026 earnings call |
| Chewy net sales growth, year over year | 7.3% | Chewy Q2 2026 earnings call |
Why the pause button matters more than the cancel button
Recurly's 2026 State of Subscriptions data finds that 38% of consumers prefer pausing a subscription over canceling it outright - a lever most retention dashboards do not track separately from a full cancellation. A subscriber who pauses is not a churn event in most billing systems, but a retention program that cannot see the difference between a pause and a return will systematically undercount how much churn it actually prevented.
Loyalty is the leading indicator no churn number captures
Every measurement above is a lagging one - it reports a decision the customer already made. Bain & Company's NPS Prism service surveys more than 20,000 consumers per industry across 10-plus industries to separate relationship-level loyalty, episode-level loyalty and channel loyalty into distinct scores. A relationship score sliding while episode scores stay flat is the kind of early signal that shows up in an NPS program months before it shows up as churn, NRR compression or a repeat-purchase dip in any of the tables above.
Retention math is only as good as the record behind it
Every retention formula on this page reads from a customer or billing record, and 2026 data on the state of that record is not reassuring. Validity's survey of 602 CRM users and administrators found 76% saying less than half of their organization's CRM data is accurate and complete, and 37% reporting lost revenue tied directly to poor data quality. A churn rate, an NRR figure or a repeat-purchase rate calculated on top of a record that is wrong half the time is not a benchmark problem - it is a data-hygiene problem wearing a retention number's clothes.
AI adoption raises the stakes rather than lowering them. Salesforce's 2026 State of Sales report, surveying 4,050 sales professionals, finds 94% of sales leaders with AI agents already in place call them essential to hitting retention and revenue targets - which only works if the underlying account data those agents read is trustworthy in the first place.
| Data-quality signal behind retention math (2026) | Figure | Source |
|---|---|---|
| CRM users saying <50% of their data is accurate/complete | 76% | Validity |
| Businesses reporting lost revenue from poor CRM data | 37% | Validity |
| Sales leaders with AI agents calling them essential to targets | 94% | Salesforce State of Sales 2026 |
| Consumers surveyed per industry for NPS Prism benchmarking | 20,000+ | Bain & Company |
A cross-check before you publish a retention number
Run every retention figure through the same four questions before it goes in a deck: which of the three measurements is it (churn, revenue retention, or repeat purchase); is the denominator logos or revenue; does it include or exclude expansion; and is it blended across segments that churn at genuinely different rates, the way Recurly's enterprise cohort (0.18% involuntary churn) and blended SaaS average (1.06% involuntary) do. A number that cannot answer all four questions is not ready to be compared against anything on this page.
How to benchmark your own retention number honestly
Name the measurement before quoting the number: churn rate for subscription cancellations, net revenue retention for the finance view of the same base, and repeat purchase rate for non-contractual retail. Segment churn by ARPC before averaging it, since a blended figure hides the enterprise-versus-SMB gap that Recurly's data shows clearly. Our data and analytics practice builds retention cohorts split this way, and our growth marketing practice can tie the acquisition side back to whichever retention metric your board actually reports. See our related breakdown of paid media ROI when retention is the real constraint, or talk to us about building the measurement layer.
Frequently Asked Questions
What is a good customer retention rate?
It depends entirely on which of the three retention measurements is being used. Recurly's 2026 network data puts median annual SaaS churn at 3.22%, which is a 96.78% retention rate on that basis. Chewy's public Q2 2026 results report Autoship customer sales - a repeat-purchase measure, not a churn measure - at 84.6% of net sales. Neither number is wrong; they measure different things and cannot be placed on the same scale without saying so.
What is the difference between churn rate and repeat purchase rate?
Churn rate measures the share of existing customers or revenue that leaves in a period - Recurly's median SaaS churn is 3.22% annually. Repeat purchase rate measures the share of customers or revenue that comes from people who have already bought before, which is a discrete-transaction measure rather than a continuous-subscription one. Chewy's Autoship customer sales, at 84.6% of net sales in Q2 2026, is a repeat/recurring-purchase figure, not a churn figure, even though both numbers describe loyalty.
What is net revenue retention and how is it different from churn?
Net revenue retention (NRR) nets churned and contracted revenue against expansion revenue from the same customer base, so it can exceed 100%. Cust's 2026 dataset of 105 public B2B SaaS companies, sourced from SEC filings, finds median NRR at 122%, with the top decile clearing 155%. Gross revenue retention (GRR), which ignores expansion, sits lower - Benchmarkit's CY-2025 data puts median GRR at 84%. The gap between the two numbers is the entire expansion-revenue story.
How much does a small increase in retention change customer value?
Recurly's churn data implies the mechanism directly: a SaaS company churning at the top-quartile rate of 1.78% instead of the median 3.22% roughly doubles the modeled customer lifespan (1 divided by churn rate). ChartMogul's SaaS Benchmarks Report finds that 40% of SaaS businesses in the USD 15-30M ARR range already operate at negative net churn, where expansion revenue exceeds all losses and the existing customer base compounds in value every month.
Is ecommerce retention comparable to SaaS retention?
Not directly. Recurly's ecommerce subscription cohort shows a 4.25% median annual churn rate, higher than SaaS's 3.22%, reflecting lower price points and more discretionary purchase behavior. Non-subscription ecommerce retention is usually reported as a repeat purchase rate instead of a churn rate, and public DTC anchors vary enormously by category - Chewy's Autoship rate of 84.6% sits at one extreme because pet food is a true replenishment category, which most retail is not.
Sources
Recurly - Churn rate benchmarks by industry, 2026
Cust - 2026 State of Customer Success, SaaS retention benchmarks
Benchmarkit - CY-2025 B2B SaaS performance metrics benchmarks
ChartMogul - SaaS Benchmarks Report
The Motley Fool - Chewy (CHWY) Q2 2026 earnings call transcript
Bain & Company - NPS Prism benchmarking
Validity - The State of CRM Data Management in 2025
Salesforce - State of Sales Report, 2026 (7th edition)


