



Table of contents
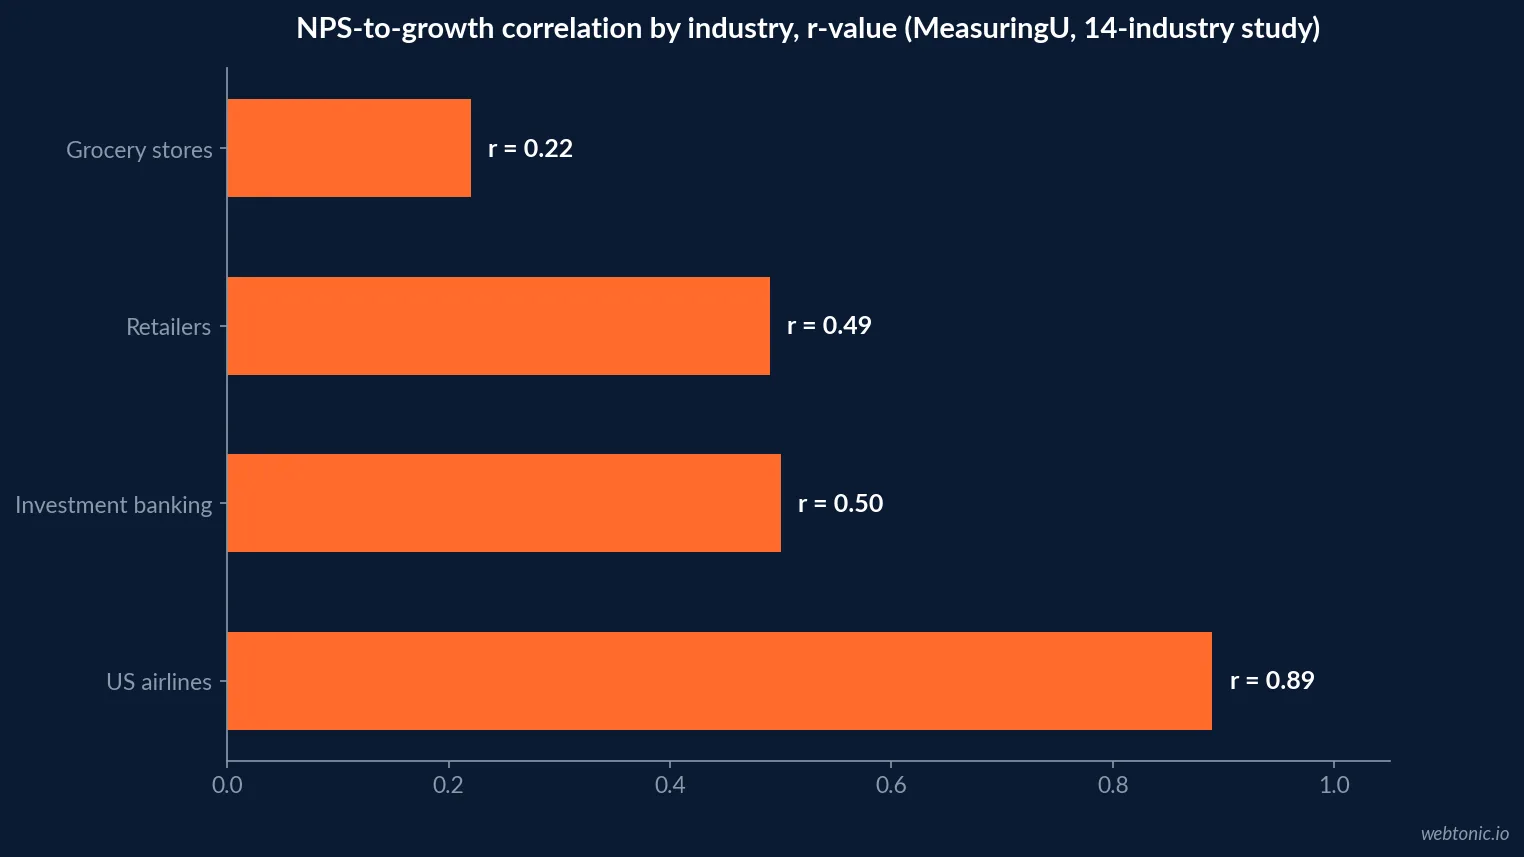
Net Promoter Score correlates with future revenue growth in 11 of 14 industries, but the strength of that link ranges from r = .89 in airlines to r = .22 in grocery stores - so a single NPS number means very different things depending on the category it sits in.
Key Takeaways
- NPS positively correlated with future growth in 11 of 14 industries studied.
- The average correlation across all 14 industries was r = .35.
- For the 11 positive industries, two-year growth correlation rose to r = .44.
- US airlines showed the strongest link at r = .89.
- Grocery stores showed the weakest positive link at r = .22.
- 149 companies across 14 industries were tracked from 2013 to 2017.
- Forrester's 2026 rankings covered 462 brands across 13 industries and 13 countries.
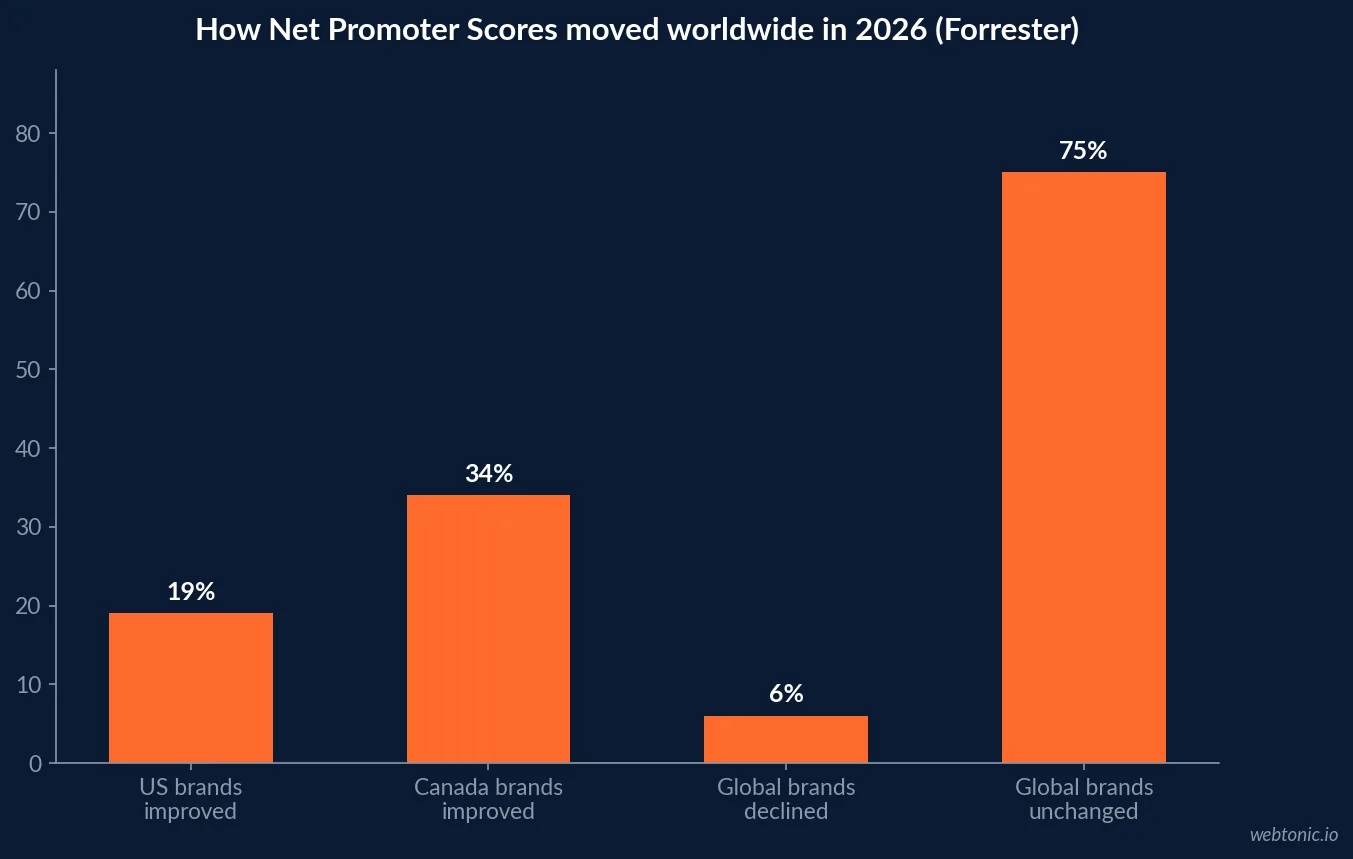
- Nearly one in five (19%) of measured US brands improved their score.
- More than one-third of measured Canadian brands improved.
- 75% of brands globally were statistically unchanged year over year.
- Bain's NPS Prism benchmarks 10 industries on five continents.
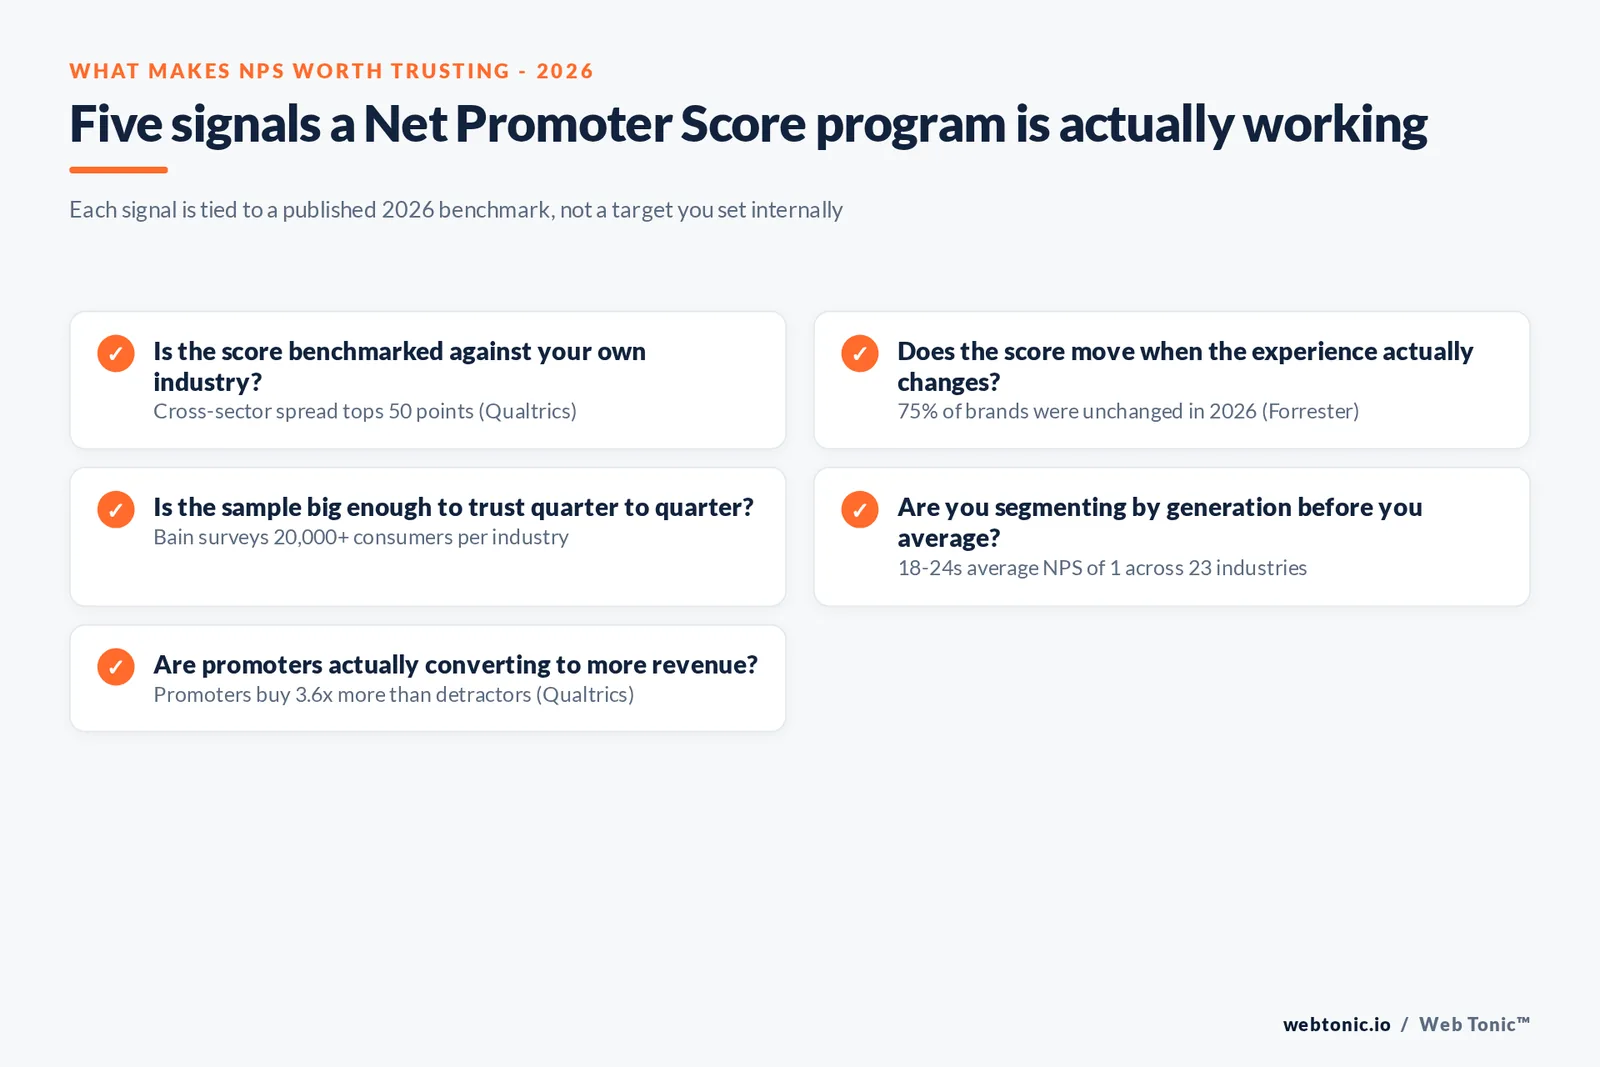
- Bain surveys 20,000-plus consumers per industry, refreshed quarterly.
- Retently's 2026 data puts average scores between 19 and 34 by sector.
- Promoters are 4.2 times more likely to trust a brand than detractors.
- Promoters are 3.6 times more likely to purchase more.
- Promoters are 4.4 times more likely to forgive a bad experience.
- Consumers aged 18 to 24 average a blended NPS of just 1 across 23 industries.
NPS at a glance: the numbers behind the metric
| Metric | 2026 figure | Source |
|---|---|---|
| What Promoters score | 9-10 out of 10 | Qualtrics XM Institute |
| What Passives score | 7-8 out of 10 | Qualtrics XM Institute |
| What Detractors score | 0-6 out of 10 | Qualtrics XM Institute |
| NPS formula | % Promoters minus % Detractors | Reichheld, HBR, 2003 |
| Score range | -100 to +100 | Reichheld, HBR, 2003 |
| Spread within one sector, top vs bottom | 50-plus points | Qualtrics |
The metric was introduced by Frederick Reichheld in the December 2003 Harvard Business Review article The One Number You Need to Grow, which argued a single recommendation question could substitute for complex satisfaction surveys. Over two decades later the question has not changed; what has changed is how much benchmark data now exists to test whether it delivers on that promise.
Does NPS actually predict growth? The correlation data
MeasuringU revisited Fred Reichheld's original claim by pulling 2013 Temkin Group NPS benchmark data on 269 companies and matching it against actual growth metrics for 149 of those companies across the following four years. The exercise found a positive correlation between NPS and growth in 11 of 14 industries (79%) - almost exactly the 11-of-14 hit rate Reichheld reported with his own historical data.
Academic research backs the direction, if not always the strength: a study in the Journal of the Academy of Marketing Science analyzing seven US sportswear brands over five years confirmed NPS predicts sales growth in that category, while flagging that the relationship is context-dependent rather than universal.
| Industry | Correlation with growth (r) | Direction |
|---|---|---|
| US airlines | 0.89 | Strong positive |
| Investment banking | 0.50 | Moderate positive |
| Retailers | 0.49 | Moderate positive |
| Grocery stores | 0.22 | Weak positive |
| All 14 industries, average | 0.35 | Positive |
| 11 positive industries, 2-year growth average | 0.44 | Positive |
Where global loyalty stands in 2026 (Forrester)
Forrester's Global Net Promoter Score Rankings, 2026 scored 462 brands across 13 industries and 13 countries. The accompanying analysis found loyalty sentiment recovering after several uneven years: nearly one in five US brands and more than a third of Canadian brands improved significantly, reversing a multiyear decline. Europe was mixed but mostly stable; Asia Pacific saw more declines than gains. Globally, 75% of brands were statistically unchanged - most scores are stuck, and the ones that moved, moved because the underlying experience actually changed.
| Region | 2026 signal | Source |
|---|---|---|
| United States | ~19% of brands improved significantly | Forrester |
| Canada | More than one-third of brands improved | Forrester |
| Global | 6% of brands declined | Forrester |
| Global | 75% of brands statistically unchanged | Forrester |
| Global | 462 brands across 13 industries, 13 countries scored | Forrester |
Benchmarking methodology: how Bain and Retently build their numbers
Bain's NPS Prism, the benchmarking platform run by the metric's own inventors, covers 10 industries on five continents, tracks 30-plus customer journeys per industry, and surveys 20,000-plus consumers per industry on a rolling quarterly basis. That scale is why Bain-derived benchmarks carry more weight than a single company's internal survey: the sample size smooths out short-term noise.
Retently's 2026 NPS Benchmark, built from its own customer base across a five-year span, illustrates how wide the range runs: Healthcare averages around 34 (with a low of 20), while Communication & Media averages around 19 (with a low of -6). Neither industry dipped negative on average, but the low end shows how easily a single weak segment can pull a category score down.
| Industry (Retently 2026) | Average NPS | Lowest observed |
|---|---|---|
| Healthcare | ~34 | 20 |
| Communication & Media | ~19 | -6 |
| Cross-industry median (Qualtrics) | ~28 | n/a |
| Spread, top vs bottom performer in one sector | 50-plus points | n/a |
Why the score moves markets: promoter behavior
The commercial case for NPS rests on what promoters actually do differently. Qualtrics XM Institute research finds promoters are 4.2 times more likely to trust the organization, 3.6 times more likely to purchase more, and 4.4 times more likely to forgive a bad experience than detractors. That is the behavioral engine behind every growth correlation above - it is not that a high score causes growth, it is that the trust and forgiveness a high score reflects makes customers spend more and defect less.
The same research is a caution against reading one blended number too literally: consumers aged 18 to 24 average a blended NPS of just 1 across 23 industries measured, making that cohort net-neutral-to-detractor almost everywhere. A brand with an otherwise healthy score can be masking a generational loyalty problem underneath.
Why the same score means different things in different industries
The airline-versus-grocery gap in the correlation table above is not an accident of the sample. MeasuringU's researchers found that industries with fewer real alternatives for the customer - airlines, investment banking - show a much tighter link between recommendation intent and switching behavior, because a promoter genuinely has other options and a detractor genuinely leaves. In categories like grocery, where geography and habit dominate the purchase decision more than sentiment, a detractor may keep shopping at the same store anyway, which flattens the correlation even when the underlying feeling is real. That is the single biggest reason a generic "good NPS" number is close to meaningless without the category attached to it.
This is also why Bain built NPS Prism as a competitive, not absolute, benchmark. The platform's value is in comparing you against named competitors inside your own 20,000-consumer sample, not in comparing your score against a number from a different industry's press release.
| Category trait | Effect on NPS-growth correlation | Example from the data |
|---|---|---|
| Low switching cost, many competitors | Correlation runs stronger | US airlines, r = 0.89 |
| High switching cost or habit-driven purchase | Correlation runs weaker | Grocery stores, r = 0.22 |
| Score benchmarked within one category only | More reliable comparison | Bain NPS Prism, Retently |
| Score benchmarked across unrelated categories | Comparison loses meaning | Any blended cross-industry average |
What a benchmarking program should track beyond the headline number
Given how much the correlation depends on category dynamics, a program built only around the headline NPS number is working with roughly half the available signal. The more useful layer sits underneath it: relationship NPS at the brand level, episode NPS tied to specific experiences, and channel NPS comparing in-person against digital, which is exactly how Bain structures NPS Prism's benchmark reporting. Programs that only track the single blended number tend to discover a problem months after a competitor already fixed it in a specific channel or journey.
The generational data reinforces the same point from a different angle. A blended average that folds a net-neutral 18-to-24 cohort into an otherwise healthy 40-plus base can look stable for years while masking a slow-motion loyalty failure with the next generation of buyers - the kind of gap that shows up first in acquisition cost, not in the topline score.
| NPS Prism benchmark layer | What it isolates | Why it matters |
|---|---|---|
| Relationship NPS | Brand-level score vs. named competitors | The number most teams already track |
| Episode NPS | Which specific experiences create promoters vs. detractors | Points at the fix, not just the symptom |
| Channel NPS | In-person vs. online performance | Flags a channel-specific problem early |
| Segment NPS (e.g. age 18-24) | Loyalty by cohort rather than blended average | Surfaces a generational gap before it hits revenue |
Turning correlation into a growth plan
The practical read on all of this data: NPS is a useful growth signal inside a category, not across categories, and it only pays off when the score change reflects a real experience change. Teams that want the loyalty signal to translate into pipeline should pair it with the same growth-marketing discipline used everywhere else - segment the number by cohort before averaging it away, and route the customer intelligence into data intelligence and growth marketing programs rather than a quarterly slide. For teams weighing where loyalty data should influence paid acquisition, our team breaks down channel-level ROI in this comparison of email marketing agencies, a channel where promoter behavior shows up fastest. Questions about applying this to your own retention numbers can go straight to our team.
Frequently Asked Questions
Does a higher Net Promoter Score actually predict revenue growth?
In most industries, yes, but the strength varies a lot. MeasuringU tracked 149 companies across 14 industries and found NPS positively correlated with future growth in 11 of them (79%), with an average correlation of r = .35 across all 14 and r = .44 across the 11 positive industries for two-year growth. The relationship ranged from r = .89 in US airlines down to r = .22 in grocery stores, so treat NPS as a directional signal within your own category rather than a universal growth dial.
What counts as a good Net Promoter Score in 2026?
It depends entirely on the industry you are benchmarked against. Qualtrics XM Institute data shows the spread between top and bottom performers in a single sector can exceed 50 points, and Retently's 2026 benchmark puts average scores as low as 19 in Communication & Media and as high as the mid-30s in Healthcare. A score of 35 can be a market leader in one category and below average in another.
How is Net Promoter Score calculated?
Customers answer one question - how likely are you to recommend us to a friend or colleague - on a 0 to 10 scale. Scores of 9 to 10 are Promoters, 7 to 8 are Passives, and 0 to 6 are Detractors. NPS is the percentage of Promoters minus the percentage of Detractors, producing a number from -100 to +100.
Do promoters really behave differently from detractors?
Qualtrics XM Institute research finds promoters are 4.2 times more likely to trust the organization, 3.6 times more likely to purchase more, and 4.4 times more likely to forgive a bad experience than detractors. That behavioral gap is the mechanism behind the NPS-to-growth correlation, not the score itself.
Is NPS becoming less reliable as a growth predictor?
Forrester's Global Net Promoter Score Rankings 2026, covering 462 brands across 13 industries and 13 countries, found 75% of brands statistically unchanged year over year and only 19% of US brands improving. That plateau does not break the underlying correlation, but it does mean most brands need a bigger experience change than last year to move their score at all.
Sources
MeasuringU - Assessing the Predictive Ability of NPS in 14 Industries
Journal of the Academy of Marketing Science - NPS and sales growth
Forrester - Global Net Promoter Score Rankings, 2026
Forrester Blog - A Turn in Customer Loyalty
Bain & Company - NPS Prism
Retently - What is a Good Net Promoter Score? (2026 Benchmark)
Qualtrics - Customer Experience Benchmarking
Harvard Business Review - The One Number You Need to Grow


