Table of contents
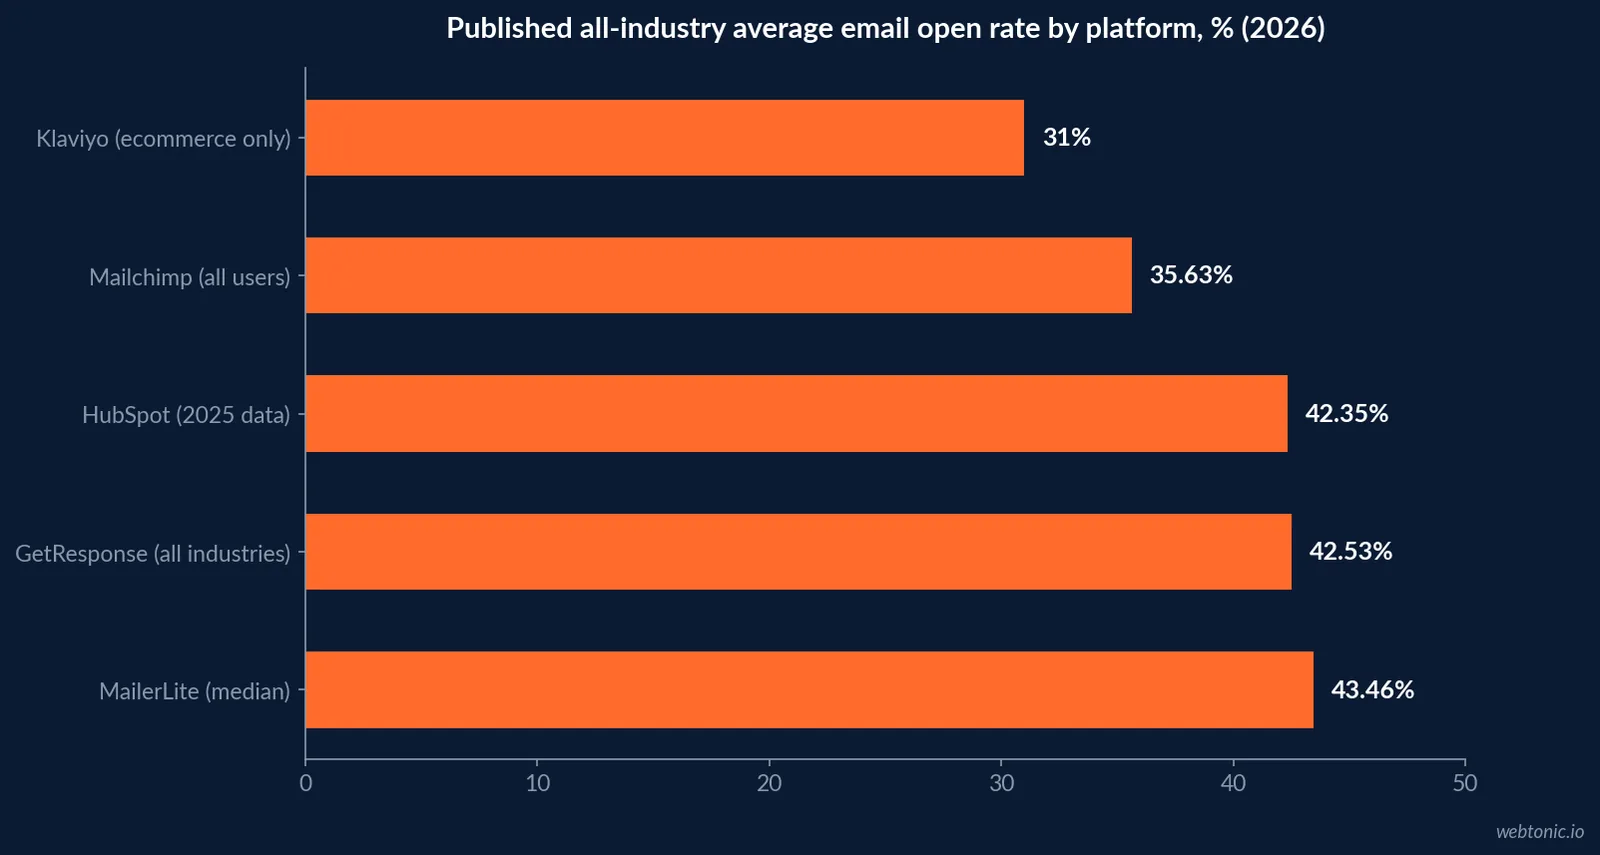
Published industry open-rate benchmarks range from 29.8% to 65.1% depending on the source, and even the "all industries" average moves from 31% to 43.5% across five major email platforms. None of the numbers below is wrong - each comes from a different sender base, reporting year and definition, which this page states for every row.
Key Takeaways
- GetResponse's all-industry average open rate is 42.53%, its most recent published figure.
- Mailchimp's all-users average open rate is 35.63%, a different sender base.
- HubSpot's cross-platform all-industries figure is 42.35% for 2025 data.
- Klaviyo's ecommerce-only average campaign open rate is 31% across 183,000+ brands.
- MailerLite's median open rate across 3.6 million campaigns is 43.46%.
- Communications tops GetResponse's table at 65.14% open rate.
- Non-profits average 54.54% (GetResponse) or 40.04% to 46.49% (Mailchimp, HubSpot).
- Ecommerce sits near the bottom everywhere it's measured: 29.81% to 31%.
- Legal Services shows the widest click gap: a 12.11% CTR against a 47.26% open rate (GetResponse).
- GetResponse's Communications open rate jumped from 48.8% to 65.1% year over year.
- Klaviyo's top 10% of ecommerce senders hit a 45.1% open rate, 14 points above its average.
- Apple Mail Privacy Protection has inflated reported open rates industry-wide since 2021.
The industry breakdown: 18 sectors, one source, ranked
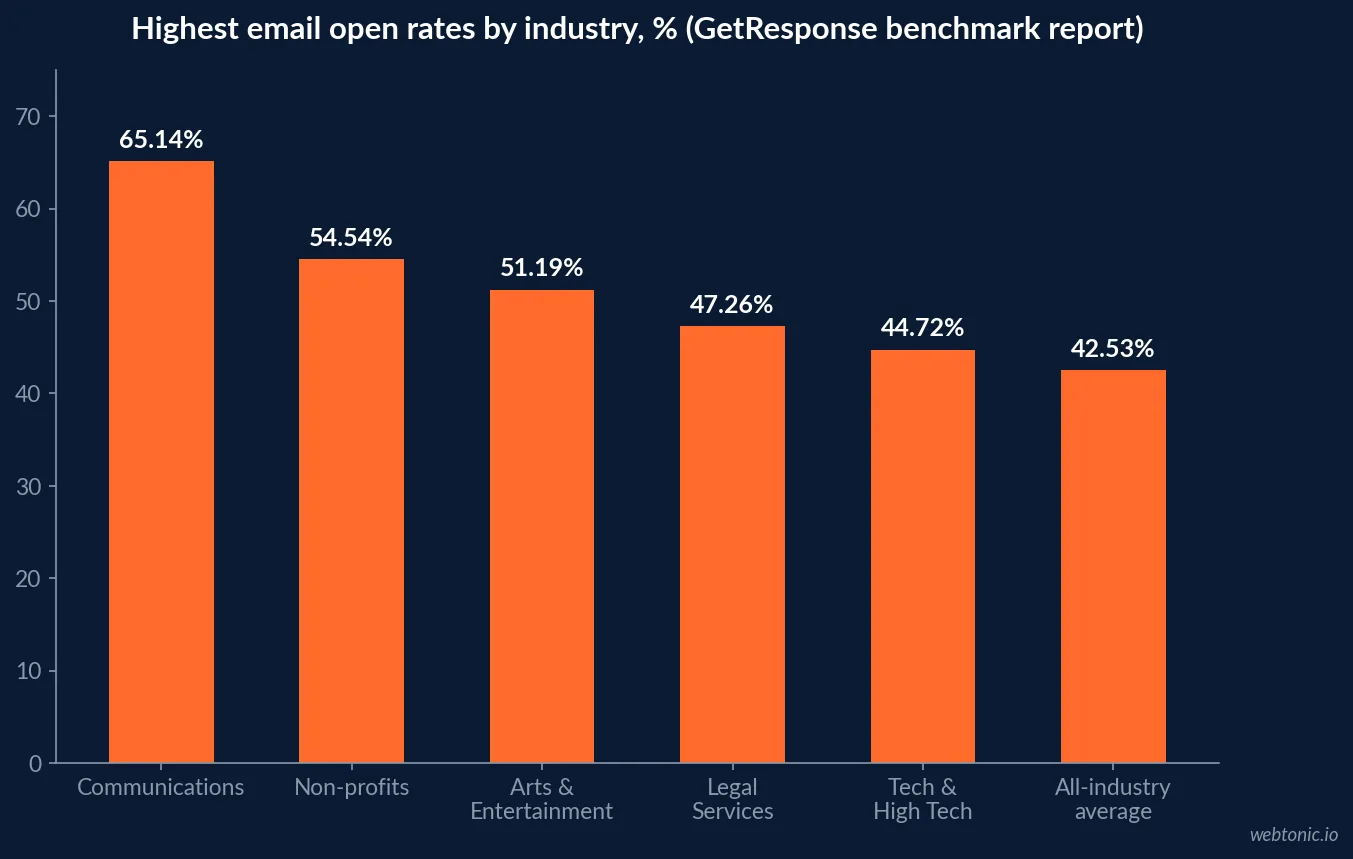
The most complete single-source industry table comes from GetResponse's own published benchmark report, which breaks out 18 named industries against one consistent methodology and reporting period. Communications leads every metric it publishes; ecommerce-adjacent categories such as Retail and Restaurants & Food sit closer to the bottom.
| Industry | Open rate | Click-through rate | Click-to-open rate | Source |
|---|---|---|---|---|
| Communications | 65.14% | 8.66% | 13.29% | GetResponse |
| Non-profits | 54.54% | 6.70% | 12.29% | GetResponse |
| Arts & Entertainment | 51.19% | 4.16% | 8.13% | GetResponse |
| Legal Services | 47.26% | 12.11% | 25.63% | GetResponse |
| Technology & High Tech | 44.72% | 7.40% | 16.54% | GetResponse |
| Health Care | 43.95% | 3.08% | 7.01% | GetResponse |
| Real Estate | 42.71% | 3.51% | 8.23% | GetResponse |
| Retail | 41.77% | 5.10% | 12.22% | GetResponse |
| Education | 41.33% | 3.17% | 7.68% | GetResponse |
| Publishing | 39.89% | 5.76% | 14.43% | GetResponse |
| Automotive | 39.69% | 5.76% | 14.51% | GetResponse |
| Agencies | 39.26% | 4.69% | 11.96% | GetResponse |
| Restaurants & Food | 38.52% | 2.44% | 6.33% | GetResponse |
| Health & Beauty | 38.16% | 2.14% | 5.62% | GetResponse |
| Sports and Activities | 37.28% | 6.87% | 18.43% | GetResponse |
| Financial Services | 34.70% | 5.34% | 15.40% | GetResponse |
| Travel | 32.83% | 2.52% | 7.69% | GetResponse |
| Internet Marketing | 32.62% | 3.18% | 9.74% | GetResponse |
Why the same industries score differently across platforms
Cross-check any single row against a second source and the number moves, because the denominator moves. Mailchimp's own published table covers only four named industries plus an all-users average, each drawn from its own sender base: Non-Profits at 40.04%, Education + Training at 35.64%, Business + Finance at 31.35% and Ecommerce at 29.81%, against an all-users average of 35.63%. HubSpot's 2025 table reports Nonprofit at 46.49% and Retail at 38.58%, but its own methodology note discloses that each metric is sourced from a different underlying platform (Brevo for Nonprofit's open rate, Klaviyo for Retail's), not a single unified panel.
| Metric | Mailchimp | HubSpot (2025) | GetResponse | Klaviyo | MailerLite |
|---|---|---|---|---|---|
| All-industry / all-users open rate | 35.63% | 42.35% | 42.53% | 31.0% (ecommerce only) | 43.46% (median) |
| Nonprofit / Non-Profits open rate | 40.04% | 46.49% | 54.54% | n/a | 52.38% |
| Ecommerce / Retail open rate | 29.81% | 38.58% | 41.77% | 31.0% | n/a |
| Reporting basis | Own send volume | Multi-platform blend per metric | Own send volume, 2023 data | 183,000+ brands, campaign-level | 3.6M campaigns, Dec'24-Nov'25 |
The methodology gap: what "open rate" doesn't mean anymore
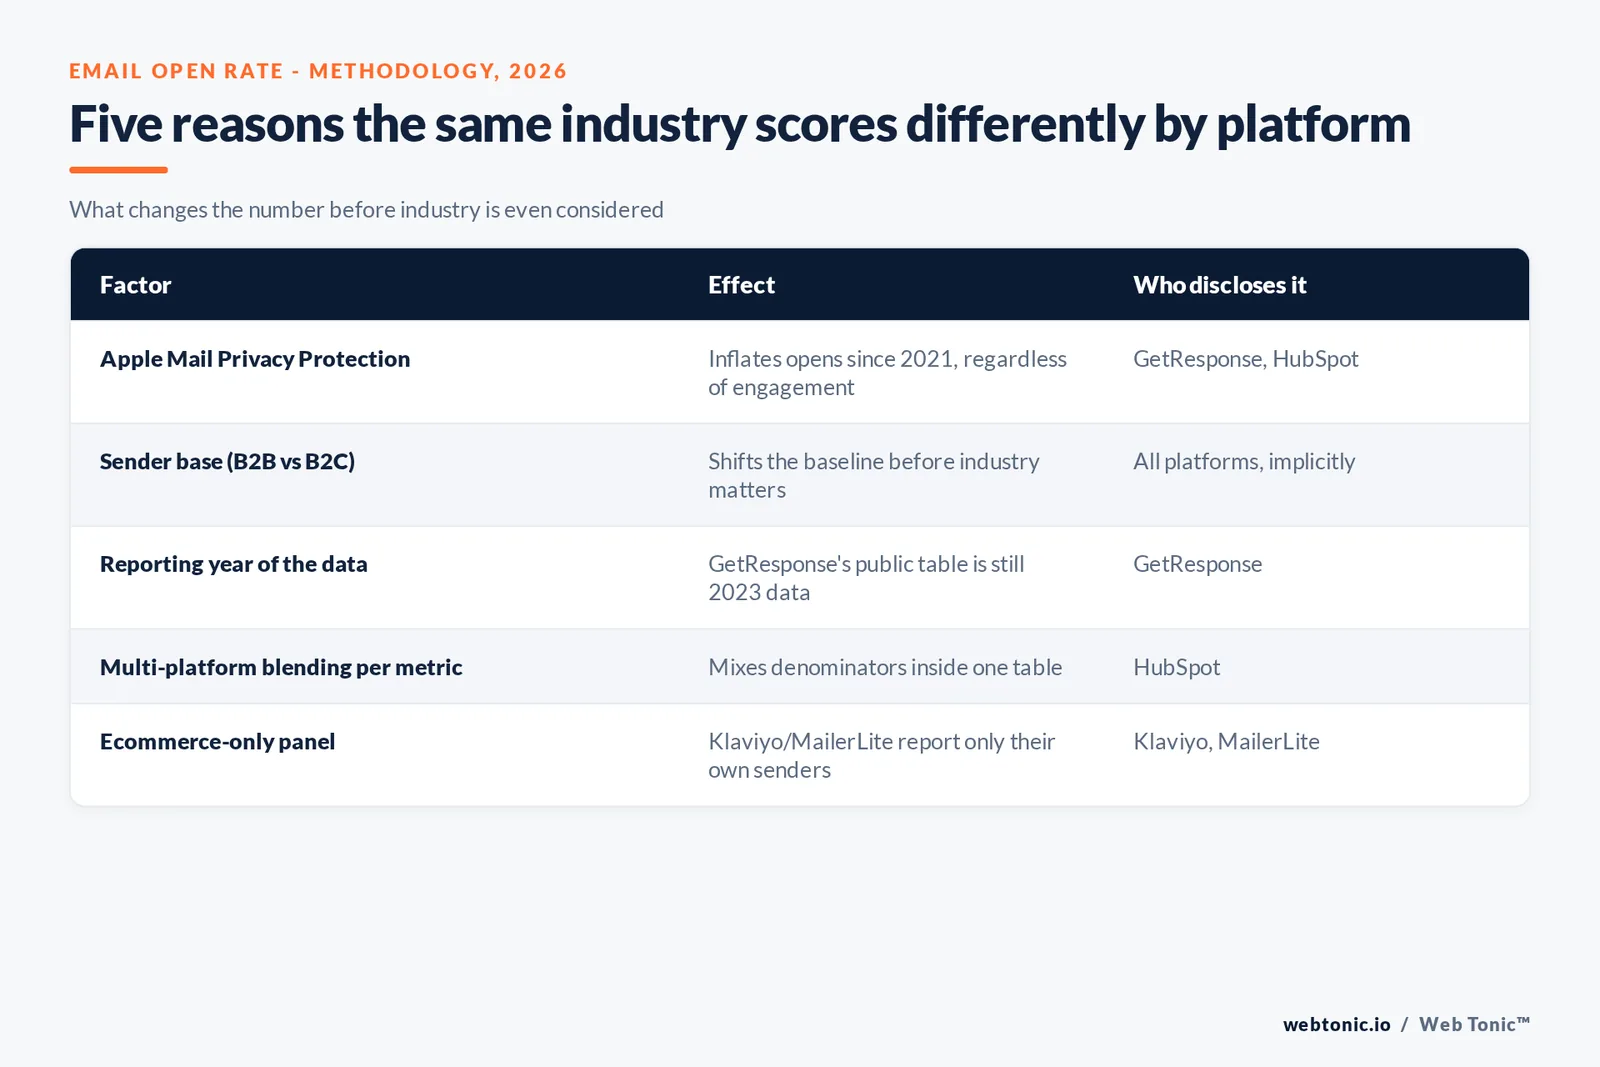
Every source above should be read alongside one caveat that all of them share: Apple's Mail Privacy Protection, live since 2021, pre-fetches images for a large share of Apple Mail users and registers an "open" whether or not a human read the message. GetResponse's own report notes that "email open rates have become less reliable since Apple's introduction of Mail Privacy Protection," which is one reason its report leans on click-through rate trends - Legal Services' CTR nearly quadrupled from 3.2% to 12.1% year over year - as the more trustworthy engagement signal.
Sender-base composition matters just as much as the privacy feature. A platform whose customers skew toward consumer brands with heavy Apple Mail audiences will report structurally higher open rates than one whose base skews B2B and Gmail-heavy, independent of actual engagement.
| Definition or sample factor | Effect on reported open rate | Who discloses it |
|---|---|---|
| Apple Mail Privacy Protection (2021+) | Inflates opens regardless of human engagement | GetResponse, HubSpot |
| Sender base composition (B2B vs B2C) | Shifts the baseline before industry is even considered | All sources, implicitly |
| Reporting year of the underlying data | GetResponse's public table is 2023 data as of 2026 | GetResponse |
| Multi-platform blending per metric | Mixes different denominators within one table | HubSpot |
| Ecommerce-only vs cross-industry panel | Klaviyo and MailerLite report only their own senders | Klaviyo, MailerLite |
Click-through rate as the more honest signal
Because open rate is the metric most distorted by Apple's privacy feature, several sources point to click-through rate as the more trustworthy engagement number. GetResponse's own report highlights Legal Services' click-through rate nearly quadrupling year over year, from 3.2% to 12.11%, alongside a smaller jump in its open rate - exactly the kind of divergence that should make a marketer trust the click number over the open number when the two move at different speeds.
| Industry | Open rate (GetResponse) | Click-through rate | Gap signal |
|---|---|---|---|
| Legal Services | 47.26% | 12.11% | Highest CTR of any industry tracked |
| Sports and Activities | 37.28% | 6.87% | High CTR relative to a mid-pack open rate |
| Automotive | 39.69% | 5.76% | CTR outperforms open-rate rank |
| Health & Beauty | 38.16% | 2.14% | Low CTR despite average open rate |
| Travel | 32.83% | 2.52% | Both metrics near the bottom of the table |
Ecommerce is the one industry every source agrees is below average
Ecommerce and retail are the rare case where the sources roughly agree, even if the exact numbers differ: Klaviyo's 2026 benchmark, drawn from over 183,000 brands, puts the average campaign open rate for ecommerce senders at 31%, with the top 10% of performers reaching 45.1%. Mailchimp's Ecommerce row (29.81%) and HubSpot's Retail row (38.58%) both sit below their own all-industry averages too - a consistent signal that transactional, high-frequency ecommerce sending structurally suppresses open rate relative to lower-volume relationship categories like Non-profits or Communications.
A sixth source, a sixth number: ActiveCampaign's own benchmark
ActiveCampaign's own published benchmark, calculated from real customer campaigns rather than a survey, puts its overall average open rate at 39.26% and its E-Commerce/Retail row at 35.66% - both figures land between the Mailchimp and GetResponse numbers above, which is itself useful evidence that the "true" cross-platform average probably sits somewhere in the mid-to-high 30s once sender-base skew is averaged out, not at any single report's headline number.
| ActiveCampaign benchmark row | Open rate | vs. ActiveCampaign's own overall (39.26%) |
|---|---|---|
| Overall (all industries) | 39.26% | Baseline |
| Agency | 39.08% | Roughly in line |
| Online Training / Education | 39.06% | Roughly in line |
| Entertainment / Events | 38.17% | Slightly below |
| Accounting / Financial | 37.74% | Slightly below |
| Software | 36.20% | Below average |
| E-Commerce / Retail | 35.66% | Below average, consistent with every other source |
Why deliverability, not just open rate, decides the real number
None of the open-rate figures above matter if the email never reaches the inbox in the first place. Validity's 2026 Email Deliverability Benchmark Report, built from trillions of global inbox data points, tracks inbox placement rates separately from any single ESP's open-rate panel - a reminder that a "39% open rate" benchmark assumes the other 60%+ of sends even cleared spam filtering to begin with. Teams chasing an industry open-rate target without first confirming inbox placement are optimizing the wrong variable.
Client composition adds a second layer of distortion on top of deliverability. Litmus-sourced tracking aggregated by Aurora Sendcloud, based on over a billion tracked opens, shows Apple Mail's share of tracked opens climbing sharply through 2026 - meaning the open-rate inflation problem described above is getting larger over time, not stabilizing at a fixed correction factor that a marketer could simply subtract out.
What none of these reports agree to measure
Open rate, click rate and click-to-open rate are the three metrics every source above publishes, but almost none publish revenue per email or list decay rate alongside industry breakdowns - the two numbers that actually connect an open-rate benchmark to a marketing budget decision. A team chasing a published industry open-rate target without also tracking its own revenue-per-send is optimizing a metric several steps removed from the outcome that pays for the email program.
A one-page way to read this whole page
Three rules cover everything above: match the benchmark source to your own sending platform where possible, read open rate as directionally useful rather than precisely comparable across platforms because of Mail Privacy Protection, and treat ecommerce's structurally lower open rate (29.8% to 31% almost everywhere it's measured) as a category norm, not a program failure. Applied consistently, those three rules turn a confusing spread of published percentages into a usable internal target.
How to actually use a benchmark table like this
Pick one platform's benchmark as your comparison anchor - ideally the one you actually send from - and track your own trend against that single source rather than shopping across five reports for whichever number flatters your program. If you send from Klaviyo, compare against Klaviyo's 31% ecommerce figure and its 45.1% top-decile mark, not against GetResponse's 65.14% Communications row from an entirely different industry and platform. Our data and analytics practice builds exactly this kind of like-for-like benchmarking into client reporting, our broader email marketing statistics page covers click-through and revenue-per-email benchmarks this page does not, and our growth marketing practice can help decide which platform's benchmark is the right one to anchor a program against.
Frequently Asked Questions
What is a good email open rate by industry?
It depends entirely on which benchmark report you compare against and which industry you're in. GetResponse's most recent published data puts Communications at 65.14% open rate and Non-profits at 54.54%, while Mailchimp's own Ecommerce figure sits at 29.81% and Klaviyo's ecommerce-only benchmark is 31%. A 'good' rate for a retailer and a 'good' rate for a nonprofit are not the same number, and comparing across reports without matching methodology overstates or understates performance.
Why do Mailchimp, HubSpot, GetResponse and Klaviyo report different open rates for the same industry?
Each measures a different customer base, a different reporting year, and sometimes a different metric definition. Mailchimp and GetResponse aggregate their own send volume; HubSpot's 2025 table blends data from multiple named platforms (Klaviyo, Mailerlite, ZeroBounce, Brevo) per metric; Klaviyo and MailerLite report only their own senders. Apple's Mail Privacy Protection, live since 2021, also inflates open rates differently depending on how heavily an ESP's customer base skews toward Apple Mail users.
Which industries have the highest email open rates?
In GetResponse's most recent published benchmark set, Communications leads at 65.14%, followed by Non-profits at 54.54% and Arts & Entertainment at 51.19%. Mailchimp's smaller published set shows a similar pattern with Non-Profits at 40.04% and Education + Training at 35.64% well above its All Users average of 35.63%.
Which industries have the lowest email open rates?
Ecommerce and retail consistently sit near the bottom across every source that publishes them: Mailchimp's Ecommerce figure is 29.81%, Klaviyo's ecommerce benchmark is 31%, and HubSpot's Retail row is 38.58% - still below that source's own all-industry average in every case.
How should a marketing team use these benchmarks?
Pick one source, match your send volume and industry to its methodology as closely as possible, and track your own rate against that single source over time rather than cherry-picking whichever published number looks most favorable. Comparing your Klaviyo-reported open rate against Mailchimp's or GetResponse's published average compares two different measurement systems, not two comparable outcomes.
Sources
GetResponse - Email Marketing Benchmarks & Statistics report
Mailchimp - Email Marketing Benchmarks & Industry Statistics
HubSpot - Email marketing benchmarks by industry, 2025 data
Klaviyo - 2026 Email Marketing Benchmarks by Industry
Klaviyo - Email Marketing Benchmarks 2026 (open, click and conversion rates)
MailerLite - Email marketing benchmarks by industry and region for 2026
ActiveCampaign - Email marketing benchmarks by industry
Validity - 2026 Email Deliverability Benchmark Report
Aurora Sendcloud - Email client market share 2026 (Litmus data)