Table of contents

Average annual churn rate by industry ranges from roughly 3.0% in SaaS to more than 4.2% in ecommerce and digital media, according to Recurly's July 2026 subscription-network research. That two-point spread compounds fast: at scale it is the difference between replacing a third of your customer base every decade and replacing nearly half of it.
Key Takeaways
- SaaS runs a median 3.04% annual churn, the lowest vertical in Recurly's network data.
- Top-quartile SaaS performers hold churn at 1.78% or below.
- Business and Professional Services runs 3.21% to 3.44% annual churn.
- Ecommerce runs 4.25% annual churn, the highest core vertical measured.
- Enterprise SaaS at $250-plus ARPC runs 3.54% churn with involuntary churn of just 0.18%.
- Education carries the highest voluntary churn rate at 3.30%.
- Digital Media and Entertainment runs 4.14% total churn, split 2.55% voluntary and 1.59% involuntary.
- The $10-to-$25 ARPC cohort carries the highest overall churn at 4.29%.
- Recurly's network recovered over $1.6 billion in revenue through dunning in the past year.
- SaaS businesses alone recovered more than $155 million via automated dunning.
- 38% of consumers prefer pausing a subscription over cancelling it (2026 State of Subscriptions).
- Brands offering a pause option saw pause usage increase by 337%.
- Nearly 1 in 4 new subscriptions comes from a previously cancelled customer.
- Churnkey's data puts SaaS churn at roughly 4.00%, insurance at 3.90% and leisure at 3.70% on its own benchmark scale.
- Business services shows the highest churn in Churnkey's set at 4.20%.
Two independent datasets, read together
No single subscription platform sees every industry, so this page pairs two independently collected 2026 datasets rather than leaning on one. Recurly's research draws on its network of subscription businesses, updated with July 2026 data. Churnkey's benchmark set is built from its own customer base and reports voluntary churn specifically. The two use different cohorts and slightly different category names, so read each table against its own source rather than merging the numbers.
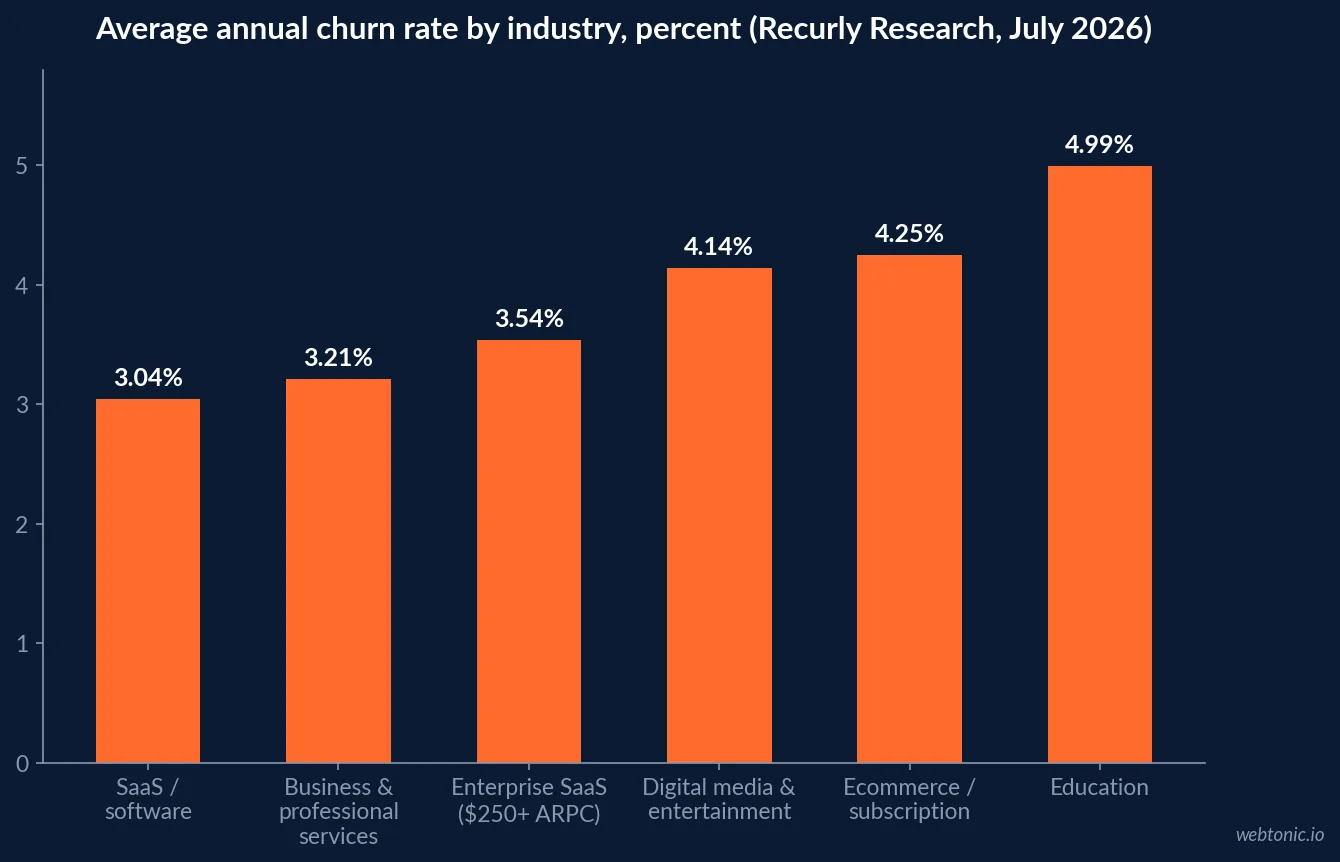
Average churn rate by industry (Recurly network data, July 2026)
Recurly's dataset draws the clearest line: B2B verticals with longer contract cycles and higher switching costs churn less, and lower-ARPC, more discretionary categories churn more.
| Industry / segment | Overall annual churn | Voluntary | Involuntary | Note |
|---|---|---|---|---|
| SaaS / software | 3.04% | n/a (blended) | n/a (blended) | Top quartile at 1.78% or below |
| Business & Professional Services | 3.21%-3.44% | - | - | Best-quartile performance at 1.83% |
| Enterprise SaaS ($250+ ARPC) | 3.54% | - | 0.18% | Higher-value subscribers use better payment methods |
| Digital Media & Entertainment | 4.14% | 2.55% | 1.59% | Payment-recovery gap, not an intent problem |
| Ecommerce / subscription boxes | 4.25% | 2.87% | 1.38% | Lower price points, impulse-driven signups |
| Education | 4.99% | 3.30% | - | Highest voluntary churn of any vertical measured |
| $10-$25 ARPC cohort (blended) | 4.29% | - | 1.30% | Highest overall churn band in the dataset |
Voluntary versus involuntary: the diagnostic layer
A blended churn number tells you how much you are losing. It does not tell you why. Recurly's split does: Digital Media and Entertainment's 4.14% total is driven by payment failures (1.59% involuntary) more than by subscriber intent (2.55% voluntary, actually lower than SaaS's blended rate), which points straight at dunning and payment recovery rather than product or pricing. Education's problem is the reverse - a 3.30% voluntary rate with the lowest involuntary contribution in the dataset, pointing at engagement and perceived value, not billing.
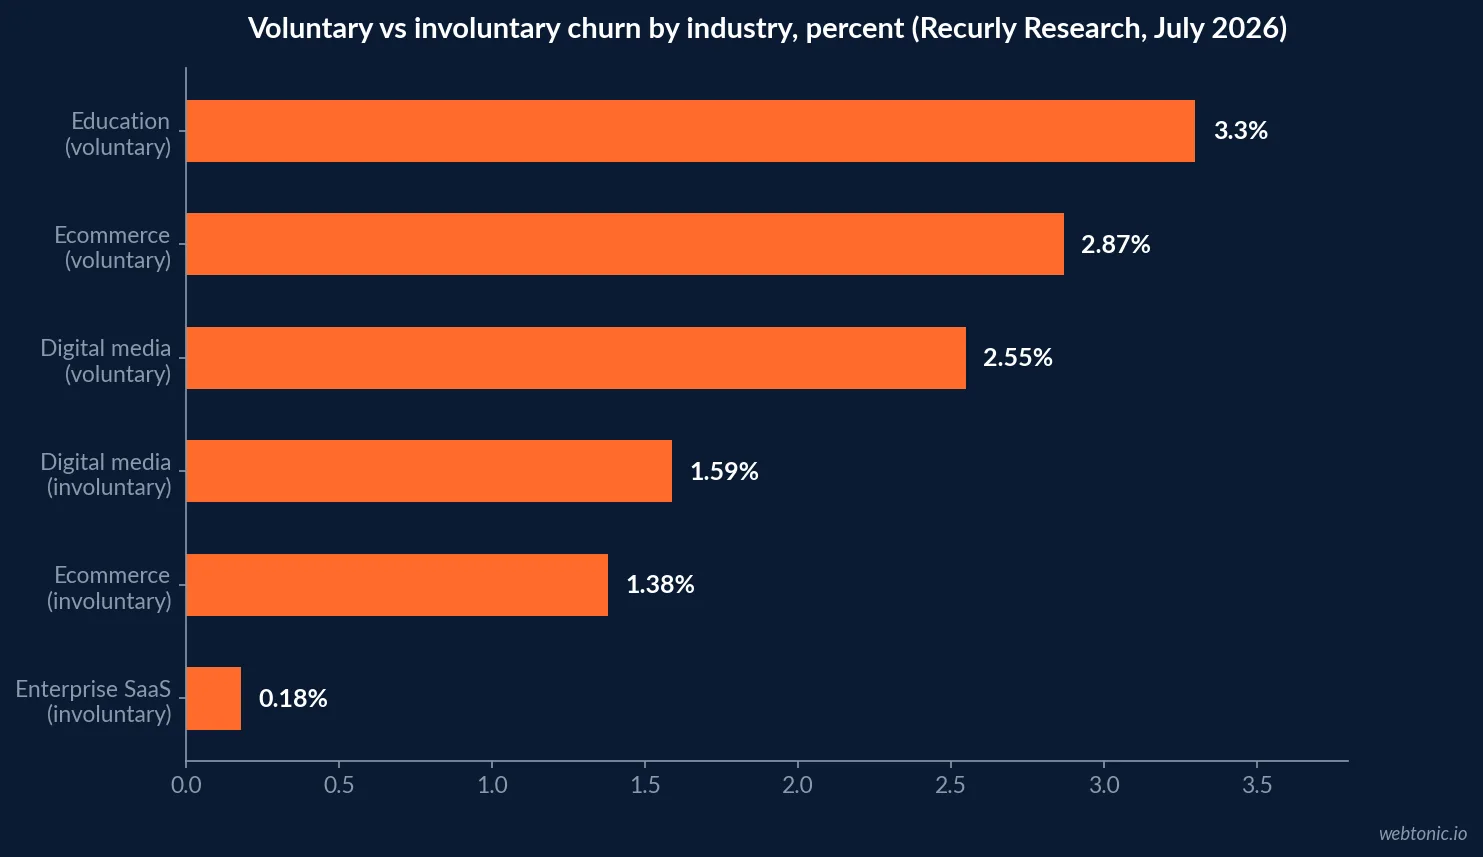
| Diagnosis | Signal in the data | Example industry | Fix |
|---|---|---|---|
| Payment-recovery gap | Low voluntary, high involuntary churn | Digital Media & Entertainment | Automated dunning, retry schedules |
| Engagement / value problem | High voluntary, low involuntary churn | Education | Onboarding, re-engagement, not discounts |
| Price-sensitivity band | Highest overall churn at low ARPC | $10-$25 ARPC cohort | Move upmarket or add annual plans |
| Structural resilience | Low overall churn across the board | SaaS / Business & Professional Services | Protect switching costs and multi-seat dynamics |
A second dataset: Churnkey's own benchmark set
Churnkey's benchmark research, built from its own customer base, reports a wider spread of consumer-adjacent verticals than Recurly's network, useful as a second check rather than a replacement.
| Industry (Churnkey) | Reported churn | Annualized equivalent |
|---|---|---|
| Business services | 4.20% | 43% |
| Education | 4.20% | 40% |
| Merchandise | 4.10% | 39% |
| Digital goods | 4.00% | 38% |
| SaaS | 4.00% | 38% |
| Insurance | 3.90% | 37% |
| Personal services | 3.70% | 36% |
| Leisure | 3.70% | 36% |
Where the two datasets agree, and where they don't
Both datasets agree SaaS sits near the bottom of the churn range and that consumer-facing, discretionary categories run higher. They disagree on the exact SaaS figure - Recurly's 3.04% network median versus Churnkey's roughly 4.00% - which is a reminder that "SaaS churn" depends heavily on which subscription platform's customer base is being measured, price point mix, and whether the figure is customer count churn or revenue churn. Use either table as a directional check on your own trend, not as a precise external target.
Our data and analytics practice builds the cohort-level churn dashboards that make this distinction (customer churn vs. MRR churn, voluntary vs. involuntary) visible inside your own numbers rather than only in a benchmark table.
When churn actually happens, not just how much
A monthly or annual rate tells you how much you are losing. It does not tell you when in the customer lifecycle you are losing it. Recharge's 2026 analysis of more than 20,000 subscription brands found that churn is heavily front-loaded: about 61% of voluntary cancellations happen at the first two renewals, and roughly 72% land within the first four. Voluntary churn peaks at the third renewal cycle near 27% before falling to about 5% by the twelfth - meaning the single highest- leverage moment for retention spend is the first reorder, not a win-back campaign six months later.
Baremetrics makes a related point in its own benchmark guidance: churn is grouped by average revenue per user cohort rather than by industry label alone, because a $10-a-month product and a $500-a-month product face structurally different churn drivers even inside the same vertical - which is exactly what Recurly's ARPC-banded data above also shows.
| Renewal number | Share of voluntary cancellations (Recharge, 2026) |
|---|---|
| 1st-2nd renewal | ~61% |
| 1st-4th renewal | ~72% |
| 3rd renewal (peak cancellation point) | ~27% |
| 12th renewal | ~5% |
Retention levers the data points to
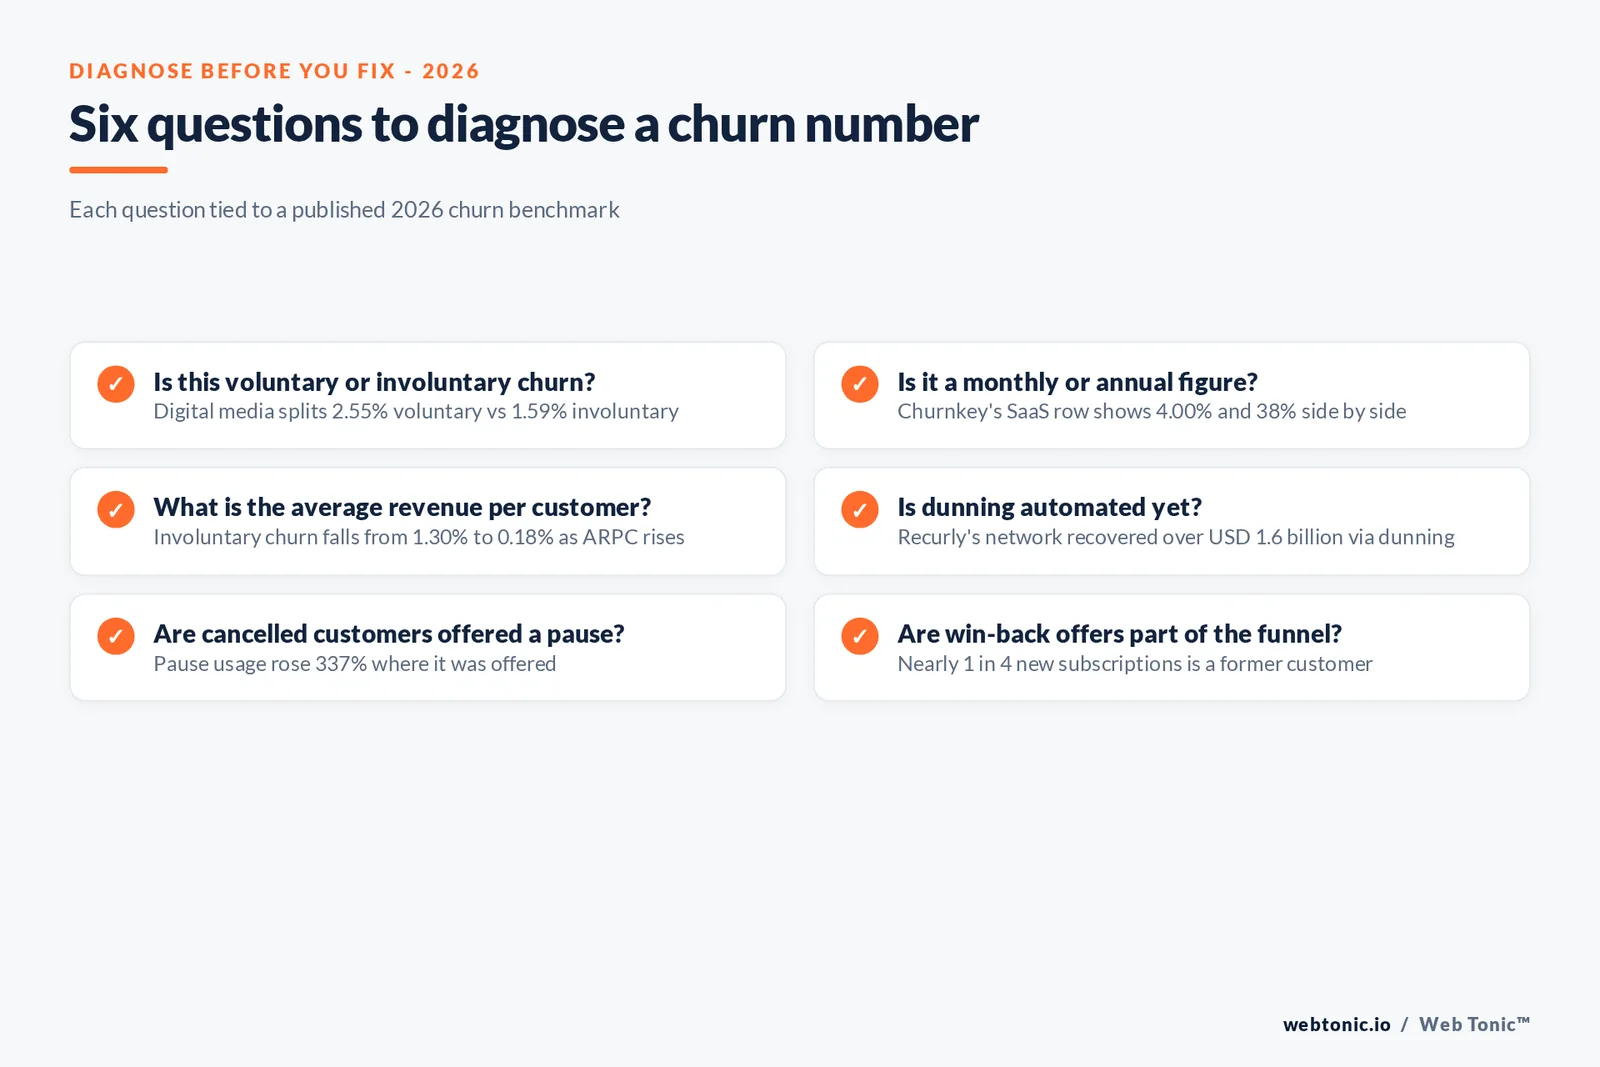
The rest of the retention playbook follows from where the churn actually happens. The 2026 State of Subscriptions data Recurly cites shows 38% of consumers prefer pausing a subscription over cancelling it outright, and brands that offered a pause option saw pause usage increase by 337%, with three out of four of those subscribers returning within months. Recurly also notes that nearly 1 in 4 new subscriptions now comes from a previously cancelled customer - voluntary churn is not always permanent, which makes win-back programs a standard part of the acquisition mix rather than an afterthought.
On the involuntary side, the fix is almost entirely operational: Recurly's network recovered over $1.6 billion in revenue through dunning in the past year, with SaaS alone recovering more than $155 million. Businesses running automated dunning report up to a 16x ROI on that investment specifically because involuntary churn carries no negative signal about the subscriber's intent to stay.
| Revenue recovered via dunning (Recurly network) | Amount |
|---|---|
| SaaS | $155M+ |
| Digital media | $100M+ |
| Ecommerce | $34M+ |
| Business & professional services | $19M+ |
| Publishing | $15M+ |
| Education | $8M+ |
Churn's effect on growth, not just retention
Lower churn compounds into faster growth, not just a healthier-looking dashboard. ChartMogul's SaaS Benchmarks Report, drawn from over 2,100 SaaS businesses, found that companies able to retain customers through a difficult growth climate grew at least 1.8 times faster than peers who could not - direct evidence that the industries at the low-churn end of Recurly's table are not just retaining more, they are compounding growth faster on the same acquisition spend.
How to use these tables
Pick the row closest to your business model and price point, not just your labeled industry - an enterprise SaaS company at $250-plus ARPC behaves more like Recurly's enterprise-SaaS row (3.54% churn, 0.18% involuntary) than like the blended 3.04% SaaS median. Then split your own churn into voluntary and involuntary before deciding where to spend the next quarter's retention budget. If the tracking isn't there yet to make that split, talk to us about building it, or read our breakdown of customer lifetime value benchmarks for the revenue side of the same retention question.
A one-page checklist before the next board update
Report churn split by voluntary and involuntary cause, matched to the closest ARPC band rather than a blended industry label, alongside the renewal-cycle timing where most of it happens. That single change turns a churn slide from "we lost 4% of customers" into a specific, fundable retention plan: fix the first-reorder experience if cancellations cluster early, fix dunning if the involuntary share is high, and fix pricing tiers if the ARPC band itself is the problem. Track the same three numbers - overall rate, the voluntary/involuntary split, and the renewal-cycle timing - every quarter against the same source dataset, since switching benchmark sources mid-year will make an improving trend look flat or a flat trend look like it moved. Neither Recurly's nor Churnkey's dataset is wrong; they simply describe different subscription businesses, which is the same lesson every third-party benchmark in this piece carries.
Frequently Asked Questions
What is a good churn rate by industry?
It depends on the vertical, not a universal number. Recurly's July 2026 network data shows SaaS and Business and Professional Services running the lowest overall churn, at 3.04% and roughly 3.2% to 3.4% annual respectively, with top-quartile performers under 2%. Ecommerce and subscription boxes run higher, around 4.25% annual, because lower price points and impulse-driven signups carry more voluntary churn. Below 2% annual churn is strong performance in almost any vertical; above 5% is worth investigating regardless of industry.
What is the difference between voluntary and involuntary churn?
Voluntary churn is a subscriber actively cancelling - an engagement or value problem, fixed with onboarding, cancel-save flows and win-back offers. Involuntary churn is a subscriber losing access because a payment failed - a payments-operations problem, fixed with dunning and dunning automation. Recurly's data shows Digital Media and Entertainment carries a comparatively low voluntary rate (2.55%) but a high involuntary rate (1.59%), meaning its churn problem is a payment-recovery gap, not a subscriber-intent problem.
Why does ecommerce churn run higher than SaaS?
Lower price points and more discretionary, impulse-driven purchase behavior. Recurly's research puts ecommerce annual churn at 4.25%, well above SaaS's 3.04%, and Churnkey's own benchmark set shows a similar pattern with merchandise and digital goods running around 4.0% to 4.1% monthly-equivalent churn against SaaS's 4.0%. Ecommerce subscribers have lower switching costs and less sunk cost in the relationship than a B2B SaaS seat holder.
Should I benchmark monthly or annual churn?
Match the metric to your billing cycle, and never compare a monthly figure against an annual one without converting first. Churnkey's benchmark table reports both: for example, SaaS shows roughly 4.00% on one measure and an implied 38% on the annualized measure. Recurly reports annual churn directly. Comparing your monthly number against an annual benchmark will make your churn look far worse than it is.
How much revenue does churn actually cost, and can it be recovered?
A meaningful share of involuntary churn is recoverable. Recurly reports its network recovered over $1.6 billion in revenue in the past year through dunning, with SaaS businesses alone recovering more than $155 million. Involuntary churn drops sharply as average revenue per customer rises: at $250-plus ARPC it is just 0.18%, versus 1.30% in the $10-to-$25 ARPC band, so lower-priced products carry the most recoverable churn.
Sources
Recurly - Churn rate benchmarks: SaaS, media, retail and more industries (July 2026)
Churnkey - Voluntary churn benchmarks and tactical advice
Recharge - Subscription churn is front-loaded: the first reorder matters more than acquisition
Baremetrics - Benchmarks help center guidance (ARPU-cohort churn framing)
ChartMogul - SaaS Benchmarks Report