Table of contents

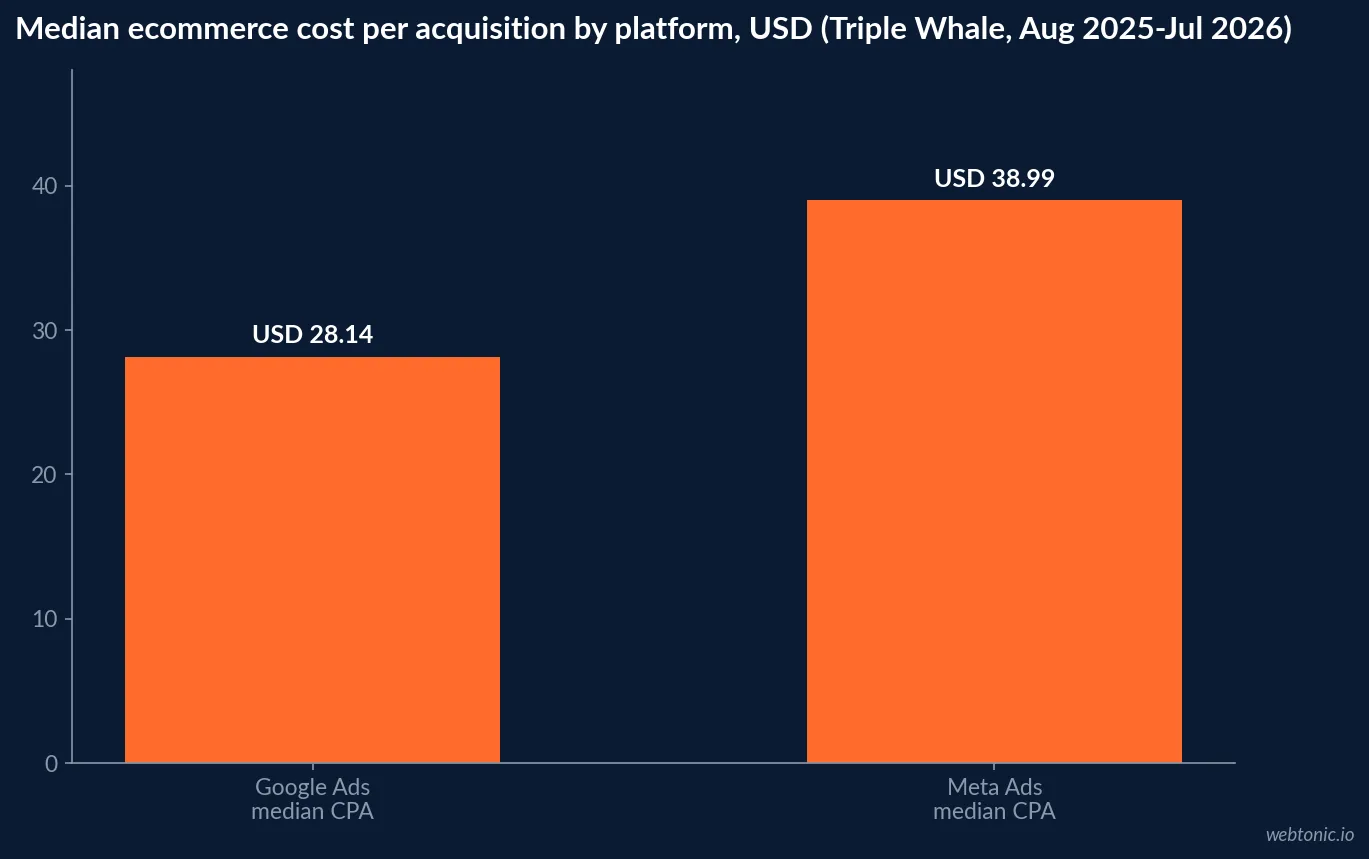
Cost per acquisition (CPA) - the cost to close one completed purchase, not just a form fill - runs a median $28.14 on Google Ads and $38.99 on Meta Ads for ecommerce brands in 2026. The gap between platforms is consistent across almost every product category, and the gap between categories on the same platform is nearly double.
Key Takeaways
- Median ecommerce Google Ads CPA is $28.14, up 9.96% year over year.
- Median ecommerce Meta Ads CPA is $38.99, up 3.14% year over year.
- Google Ads CPA rose in 14 of 15 tracked industries year over year.
- Meta Ads CPA rose in 14 of 17 tracked industries year over year.
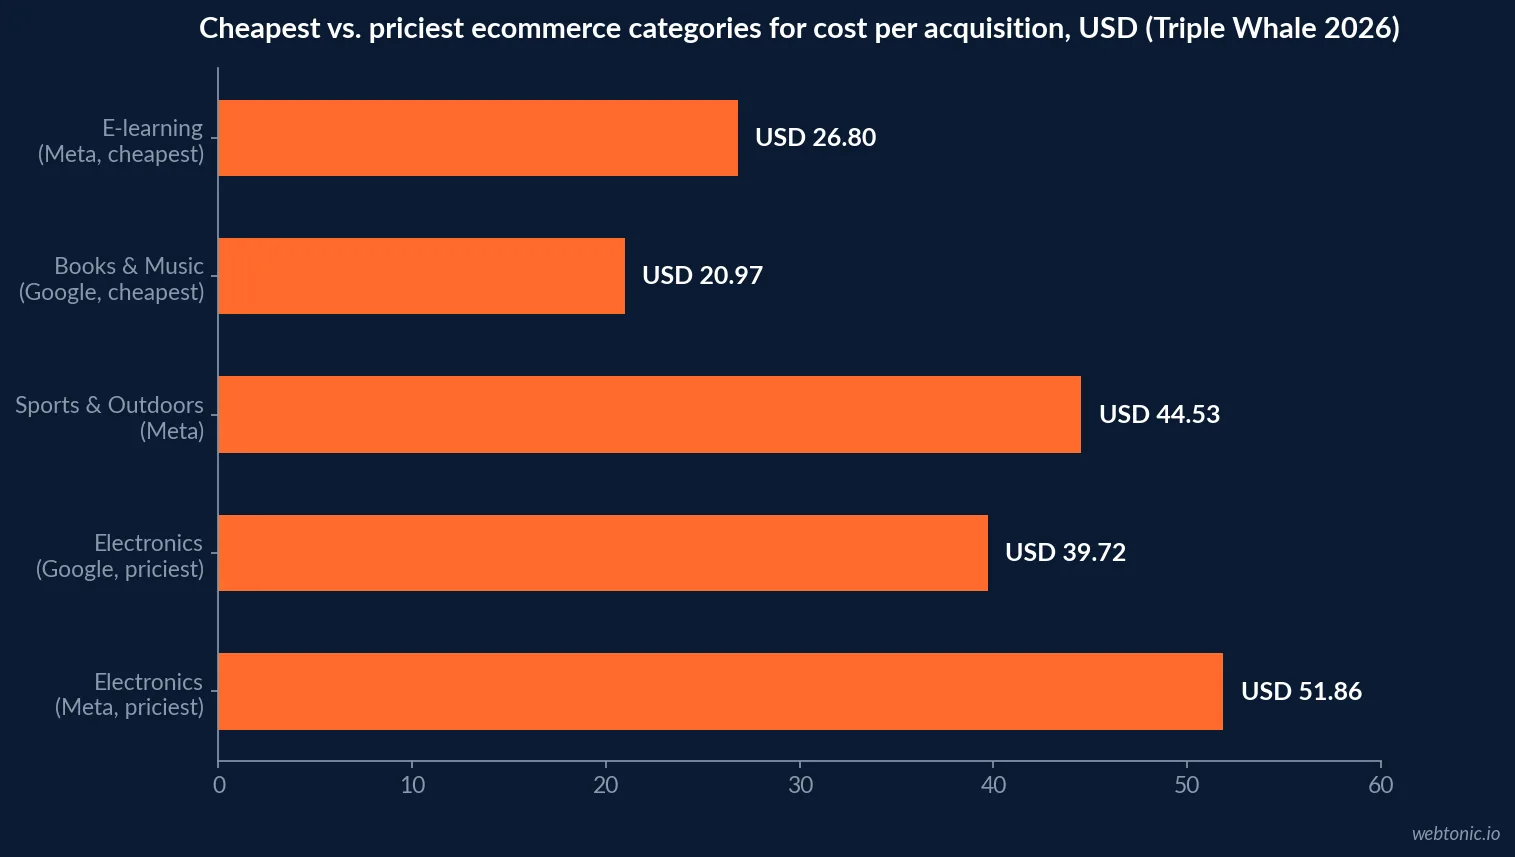
- Books & Music has the cheapest Google Ads CPA at $20.97.
- E-learning & Online Courses has the cheapest Meta Ads CPA at $26.80.
- Electronics is the priciest category on both platforms: $39.72 (Google), $51.86 (Meta).
- Pets & Animals CPA fell 3.78% on Google Ads, the only improving category tracked.
- Travel Accessories CPA rose 24.13% on Google Ads, the sharpest increase measured.
- E-learning CPA fell 5.67% on Meta Ads, the sharpest improvement measured.
- Business Supplies & Equipment CPA rose 19.79% on Google Ads to $38.39.
- Google Ads CPM for ecommerce rose 13.34% to $15.35 over the same period.
- Meta CPM for ecommerce rose 13.24% to $15.06 over the same period.
- Meta Ads median conversion rate is 1.53%, against 3.11% for Google Ads.
- Meta Ads median ROAS is 1.88, against 3.27 for Google Ads.
- Google Ads AOV for ecommerce brands is $87.65, above Meta's $73.36.
What "cost per acquisition" measures here, and why that matters
This page uses cost per acquisition in its narrowest, most defensible sense: the cost to close one completed ecommerce purchase, tracked at the platform level. That is a different, later-funnel event than cost per lead (a tracked form fill or call, covered on our Google Ads cost breakdown) or blended B2B customer acquisition cost (covered separately, since B2B sales cycles run months, not minutes). Conflating the three produces numbers that look alarming or reassuring for the wrong reason.
The data below comes from Triple Whale's Google Ads Benchmarks (18,000-plus ecommerce brands, January-December 2025 and rolling into 2026) and Triple Whale's Facebook Ads Benchmarks (40,000-plus ecommerce brands, August 2025-July 2026) - both built from real advertiser accounts on the Triple Whale platform, not survey responses.
Cost per acquisition by industry: Google Ads
The overall median Google Ads CPA for ecommerce brands is $28.14 for the period August 2025 to July 2026, up 9.96% year over year. Here is the 15-industry breakdown.
| Industry | Median CPA (Google Ads) | YoY change | Source |
|---|---|---|---|
| Books & Music | $20.97 | +1.65% | Triple Whale |
| Food & Beverage | $23.65 | +14.45% | Triple Whale |
| Lifestyle & Boutique | $24.07 | +0.76% | Triple Whale |
| Baby | $24.14 | +9.38% | Triple Whale |
| Pets & Animals | $25.05 | -3.78% | Triple Whale |
| Toys, Art & Collectibles | $25.12 | +6.07% | Triple Whale |
| Beauty | $25.39 | +9.18% | Triple Whale |
| Apparel & Accessories | $25.40 | +10.93% | Triple Whale |
| Sports & Outdoors | $30.42 | +0.31% | Triple Whale |
| Travel Accessories | $31.78 | +24.13% | Triple Whale |
| Health & Wellness | $34.76 | +13.36% | Triple Whale |
| Automotive | $38.14 | +14.44% | Triple Whale |
| Business Supplies & Equipment | $38.39 | +19.79% | Triple Whale |
| Home & Garden | $38.94 | +6.88% | Triple Whale |
| Electronics | $39.72 | +17.49% | Triple Whale |
Cost per acquisition by industry: Meta Ads
The overall median Meta Ads CPA for ecommerce brands is $38.99 for the same 12-month window, up 3.14% year over year - a smaller increase than Google Ads saw, but starting from a higher base. Here is the 17-industry breakdown.
| Industry | Median CPA (Meta Ads) | YoY change | Source |
|---|---|---|---|
| E-learning & Online Courses | $26.80 | -5.67% | Triple Whale |
| Baby | $29.61 | +0.29% | Triple Whale |
| Books & Music | $30.69 | +2.00% | Triple Whale |
| Lifestyle & Boutique | $31.16 | +4.35% | Triple Whale |
| Toys, Art & Collectibles | $34.85 | -1.52% | Triple Whale |
| Apparel & Accessories | $36.98 | +1.49% | Triple Whale |
| Media & Publishing | $36.60 | +6.94% | Triple Whale |
| Business Supplies & Equipment | $37.98 | +5.58% | Triple Whale |
| Pets & Animals | $38.51 | +0.96% | Triple Whale |
| Food & Beverage | $38.57 | +0.71% | Triple Whale |
| Beauty | $39.31 | +6.06% | Triple Whale |
| Health & Wellness | $40.53 | +8.95% | Triple Whale |
| Sports & Outdoors | $44.53 | +1.35% | Triple Whale |
| Home & Garden | $47.93 | +6.71% | Triple Whale |
| Travel Accessories & Luggage | $50.95 | +8.39% | Triple Whale |
| Medical Devices & Equipment | $51.86 | -1.47% | Triple Whale |
| Electronics | $51.86 | +11.75% | Triple Whale |
Head to head: the categories tracked on both platforms
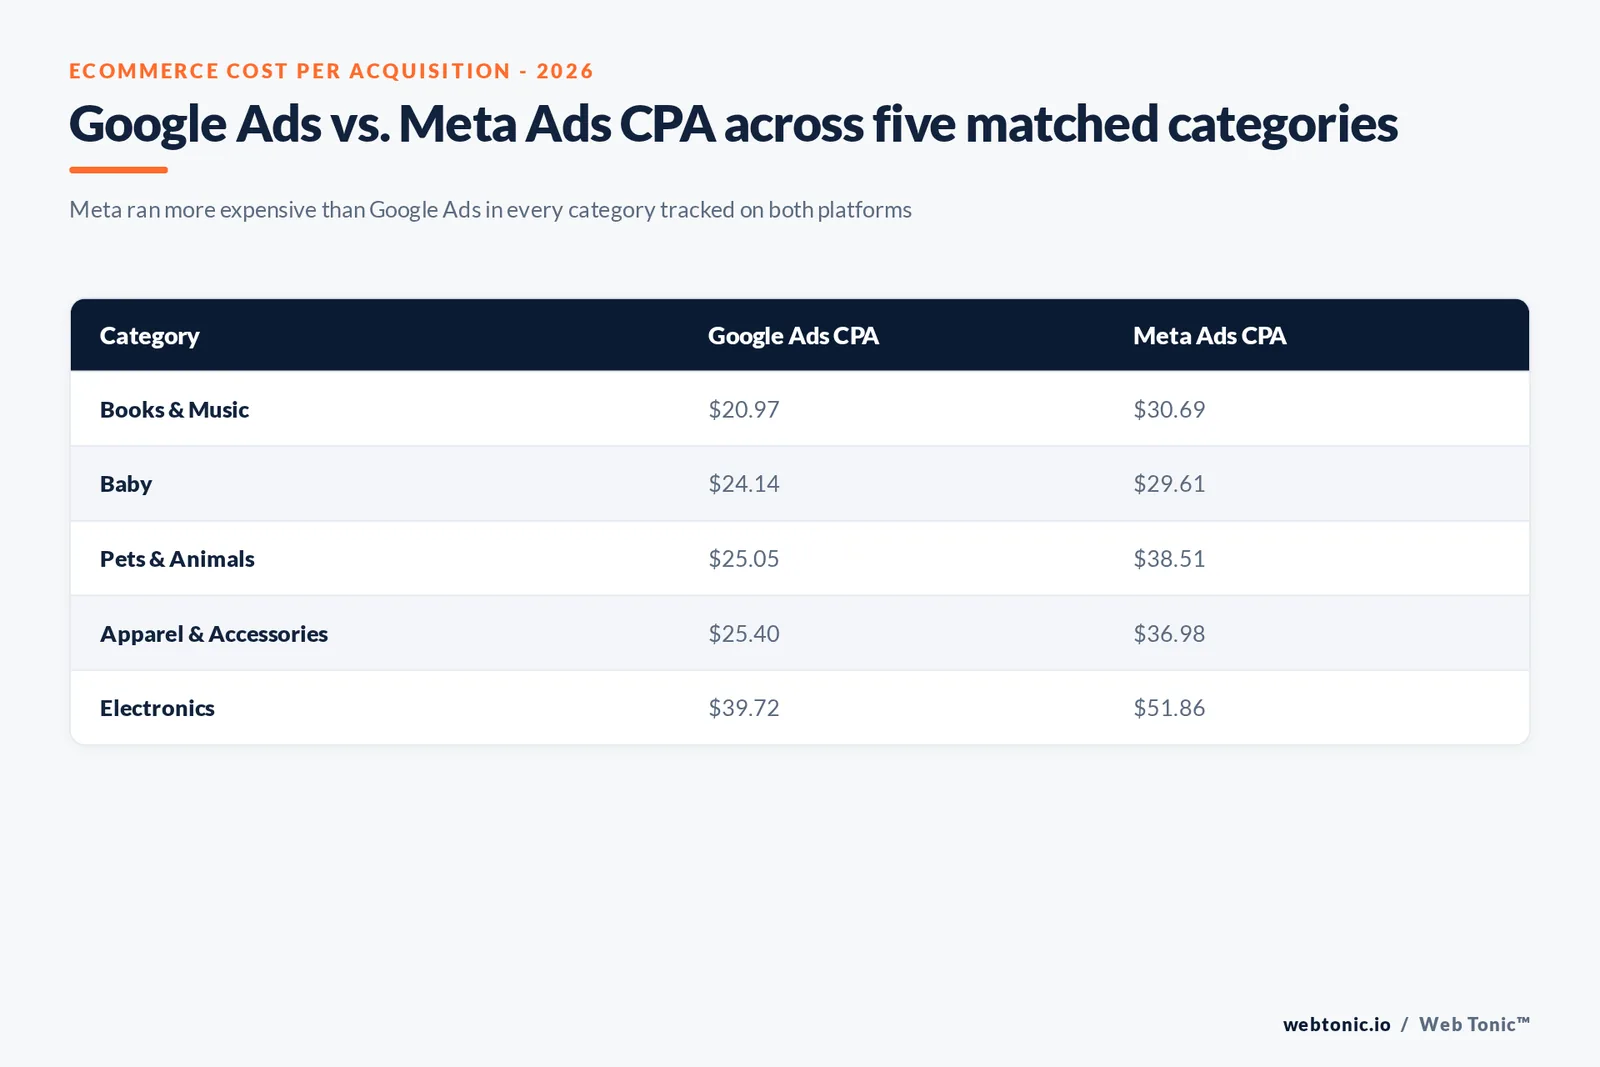
Nine categories appear in both panels, which makes a direct platform comparison possible for the first time on a single page. Meta ran more expensive than Google Ads in every one of them.
| Category | Google Ads CPA | Meta Ads CPA | Meta premium |
|---|---|---|---|
| Books & Music | $20.97 | $30.69 | +46.4% |
| Food & Beverage | $23.65 | $38.57 | +63.1% |
| Lifestyle & Boutique | $24.07 | $31.16 | +29.5% |
| Baby | $24.14 | $29.61 | +22.7% |
| Pets & Animals | $25.05 | $38.51 | +53.7% |
| Toys, Art & Collectibles | $25.12 | $34.85 | +38.7% |
| Beauty | $25.39 | $39.31 | +54.8% |
| Apparel & Accessories | $25.40 | $36.98 | +45.6% |
| Home & Garden | $38.94 | $47.93 | +23.1% |
| Electronics | $39.72 | $51.86 | +30.6% |
The gap is not random. Food & Beverage and Beauty show the widest premiums, over 50%, likely because those categories rely heavily on impulse-driven feed discovery on Meta, where a colder audience converts less predictably than someone already searching by name on Google. Baby and Home & Garden show the narrowest gaps, suggesting those categories carry enough brand-search volume on Google to keep the platform difference smaller.
Why acquisition costs rose almost everywhere in 2026
Rising CPA tracked closely with rising CPM: Google Ads ecommerce CPM rose 13.34% to $15.35 and Meta's rose 13.24% to $15.06 over the same window, while conversion rate declined on both platforms - Google's fell 7.02% to 3.11% and Meta's fell 4.73% to 1.53%. More expensive impressions plus a lower share of them converting is the exact combination that pushes CPA up even when advertisers are not raising bids deliberately.
| Platform metric | Aug 2024-Jul 2025 | Aug 2025-Jul 2026 | YoY change |
|---|---|---|---|
| Google Ads CPM | $13.54 | $15.35 | +13.34% |
| Google Ads CVR | 3.34% | 3.11% | -7.02% |
| Google Ads ROAS | 3.39 | 3.27 | -3.54% |
| Meta Ads CPM | $13.30 | $15.06 | +13.24% |
| Meta Ads CVR | 1.60% | 1.53% | -4.73% |
| Meta Ads ROAS | 1.86 | 1.88 | +0.57% |
Seasonality and account maturity move CPA more than the calendar suggests
Triple Whale's 12-month window smooths out the sharpest seasonal swings, but the underlying data still carries them: Q4 holiday competition typically pushes CPM and CPA up across every category tracked here, then eases again into Q1. A brand comparing its own November CPA against a full-year median from this page will almost always look worse than it actually is - the fairer comparison is November against November, or against the Q4-specific trend inside a category, not the rolling annual figure.
Account maturity matters just as much as season. A newly launched ad account has no conversion history for Google's or Meta's algorithms to optimize against, so its first 30 to 60 days of CPA will run well above the medians in these tables regardless of category. Both platforms need a meaningful volume of tracked conversions before their automated bidding systems can reliably hit an industry-level CPA, which is why a brand-new account should be benchmarked against its own trend line before it is benchmarked against Triple Whale's cross-brand median.
What this means for budget allocation
Google Ads' lower CPA, higher conversion rate and higher ROAS make it the more efficient acquisition channel by these medians, but Meta's reach and lower cost per impression still make it the scale lever once an audience is warm. Most efficient ecommerce accounts we see run Google Ads to capture existing purchase intent and use Meta to build the top of the funnel that search will later convert - not as two channels competing for the same budget line. Our performance creative practice builds that split before setting platform-level CPA targets for a new account.
Before comparing your own account's CPA to any row above, confirm you are measuring the same event: a completed purchase, attributed the same way (platform-reported vs. blended), over a comparable 12-month window. See our take on whether Facebook Ads are worth the spend for the fuller ROI picture behind these numbers, or talk to our team about benchmarking your account against its specific category.
The overlooked variable: average order value
A raw CPA number means nothing without the order value it is buying. Triple Whale's ecommerce panel also tracks average order value (AOV) alongside CPA, and the two move together more than most advertisers expect: Google Ads AOV for the panel sits at $87.65 against Meta's $73.36, a gap that tracks closely with the CPA gap between the two platforms. Search traffic tends to arrive further along in the buying decision, which both raises basket size and lowers the cost needed to close the sale - two effects pulling in the same profitable direction at once.
Before deciding a category's CPA is too high to be profitable, divide it into that category's actual AOV, not the platform-wide figure. A $51.86 Electronics CPA against a $40 basket is a losing formula; the same $51.86 against a $400 basket is a very healthy one, and only the category's own AOV tells you which situation you are actually in.
CPA, CPL and CAC are not the same metric
The name "cost per acquisition" gets used loosely across the industry, which is exactly why the numbers on this page will not match a cost-per-lead table or a customer-acquisition-cost table elsewhere. WordStream's PPC benchmarks track cost per lead - a tracked form fill or call from a search ad, well before any purchase happens. Shopify's own guide to customer acquisition cost defines CAC as total sales and marketing spend divided by new customers won over a period, which blends every channel together rather than isolating one platform's auction.
What this page measures - platform-reported CPA from Triple Whale - sits between those two: a single-platform, single-event (completed purchase) metric, cleaner than blended CAC but narrower than a full acquisition-cost picture that includes returns, discounts and organic sales. Google's own guidance on setting up conversion actions is the reason platform-reported CPA is comparable brand to brand in the first place - it standardizes what counts as a tracked purchase event.
Frequently Asked Questions
What is the average cost per acquisition in 2026?
For ecommerce brands, Triple Whale's panel of over 18,000 brands puts the median Google Ads cost per acquisition at $28.14 for the period August 2025 to July 2026, up 9.96% year over year. The same brands running Meta Ads, tracked across a panel of over 40,000 brands, show a higher median cost per acquisition of $38.99, up a smaller 3.14% year over year.
Is cost per acquisition the same as cost per lead?
No, and confusing the two produces meaningless comparisons. Cost per acquisition, as Triple Whale measures it, is the cost to close one completed ecommerce purchase. Cost per lead, as WordStream measures it for search ads, is the cost of a tracked form fill or call - well before any purchase happens. A $28 CPA and a $67 CPL are not measuring the same event.
Which ecommerce category has the cheapest cost per acquisition?
On Google Ads, Books & Music has the lowest median CPA at $20.97, per Triple Whale's 2026 data. On Meta Ads, E-learning & Online Courses is cheapest at $26.80, the only category to show CPA improving both platforms report in the same period.
Which ecommerce category has the most expensive cost per acquisition?
Electronics is the most expensive on both platforms Triple Whale tracks: $39.72 on Google Ads and $51.86 on Meta, tied with Medical Devices & Equipment on Meta. High price points and long research cycles push electronics CPA above every other vertical measured.
Why is Meta Ads CPA higher than Google Ads CPA for the same categories?
Google Ads captures search intent - someone already looking for the product - while Meta Ads interrupts a feed with an ad the viewer was not actively seeking, which typically converts at a lower rate and costs more per acquisition. Triple Whale's overall Meta median CPA was $38.99 against $28.14 for Google Ads over the same 12-month window, a roughly 39% gap that held across most matched categories.
Sources
Triple Whale - Google Ads Benchmarks by Industry
Triple Whale - Facebook Ad Benchmarks by Industry
WordStream - Digital Benchmarks by Industry: PPC
Shopify - Customer Acquisition Cost: Calculate and Reduce It
Google Ads Help - About conversion actions
Web Tonic - Are Facebook Ads Worth It
Web Tonic - How Much Does Google Ads Cost