Table of contents
Click-through rate ranges from roughly 0.5% on B2B-focused LinkedIn campaigns to over 13% on the highest-performing search-ad categories — a spread wide enough that quoting "average CTR" without naming the channel and the buyer type is close to meaningless. Search, paid social, organic search and email each produce a different baseline, and B2B-heavy channels post structurally lower numbers than B2C-heavy ones on every platform measured here.
Key Takeaways
- The 2025 all-industry average CTR for Google/Microsoft search ads is 6.66%, per WordStream's analysis of 16,000+ campaigns.
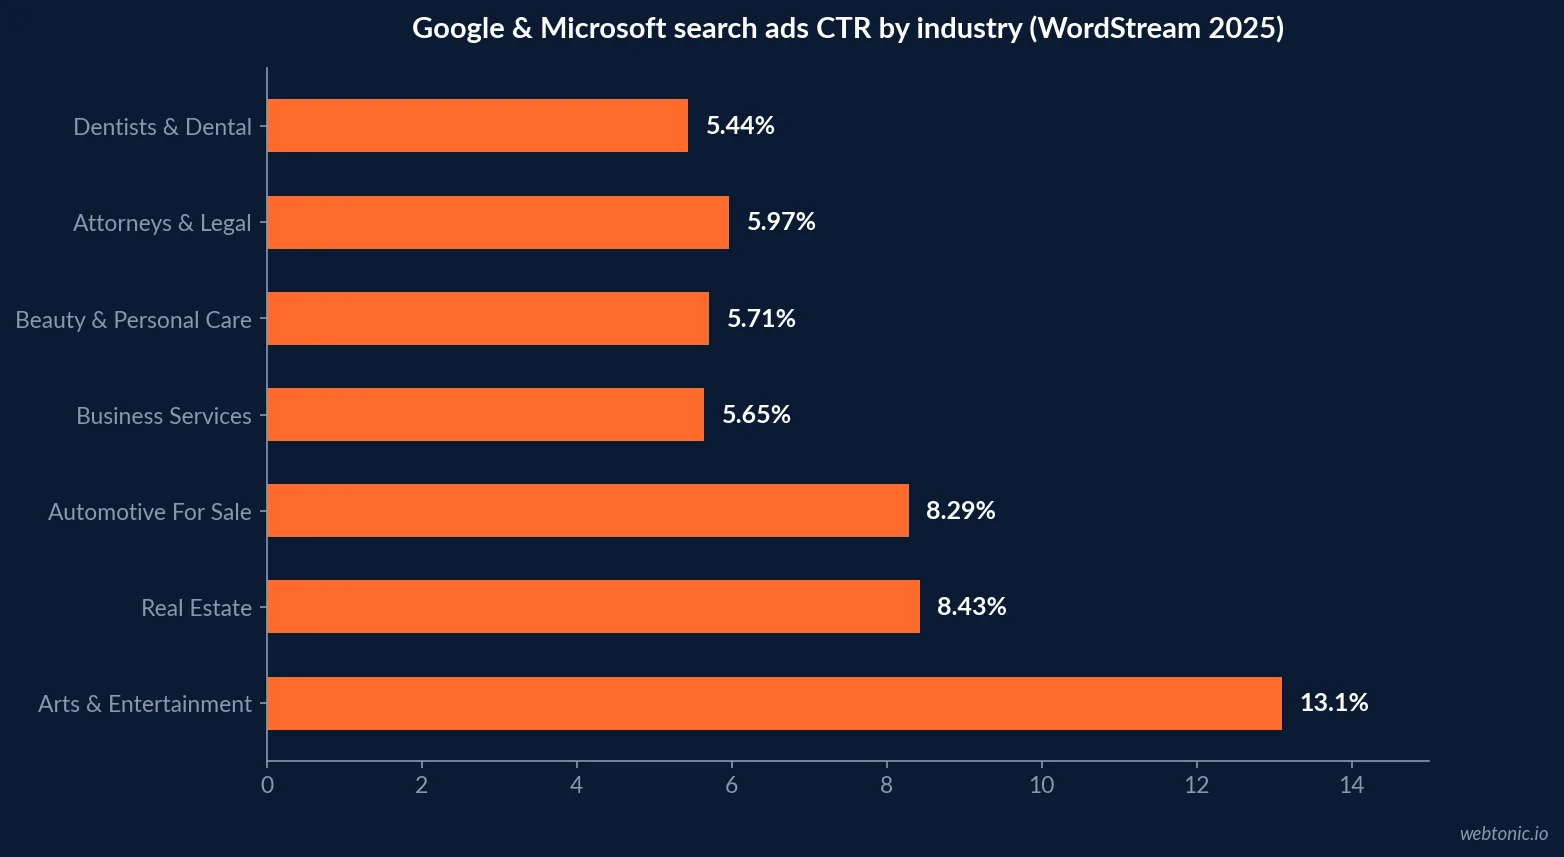
- Search-ad CTR ranges from 5.44% (Dentists & Dental Services) to 13.10% (Arts & Entertainment) across 23 industries.
- Facebook traffic-objective ads average 1.71% CTR across all industries in 2025, up from 1.58% in 2024 (WordStream).
- Facebook lead-objective ads average 2.59% CTR, essentially flat year over year.
- B2B-heavy LinkedIn Ads post a median CTR near 0.53%–0.56% across the industries AgencyAnalytics has benchmarked — the lowest of any channel in this comparison.
- Email CTR averages 2.62% across all users in Mailchimp's own benchmark data, ranging 1.74%–3.27% by industry.
- Organic search CTR clusters in a tighter 1.2%–2.2% band across 15 industries, per Databox's Google Search Console data — far narrower than paid-channel spreads.
- Year over year, CTR decreased for 52% of industries in Google/Microsoft search ads, even as the overall average rose slightly (WordStream 2025).
What CTR is actually measuring, before the industry cut
Per Google's own definition, click-through rate is simply clicks divided by impressions, expressed as a percentage — a measure of how often people who see an ad or listing click it. The formula never changes; what changes across every benchmark in this article is the denominator's composition: how an impression is counted, how aggressively a platform's algorithm targets, and how much intent the audience already has before the impression is served. Two channels reporting different CTRs are not necessarily reporting different ad quality — they may simply be measuring clicks against very different audiences.
Same metric, five different baselines
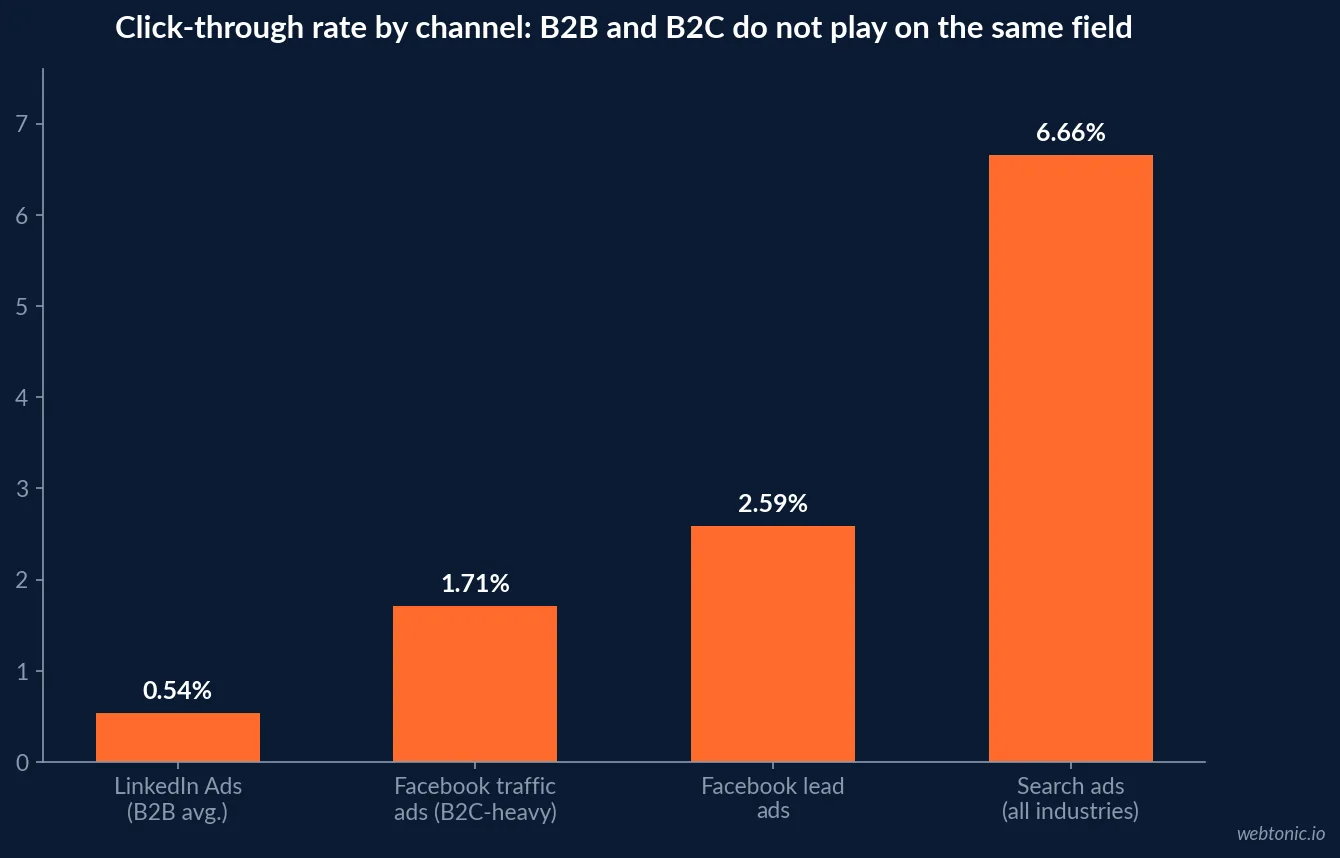
Click-through rate is calculated the same way everywhere — clicks divided by impressions — but the baseline it produces depends entirely on the channel's format, targeting model, and buyer intent. WordStream's 2025 Google Ads Benchmarks report, based on more than 16,000 US search campaigns from April 2024 through March 2025, found the all-industry average search-ad CTR at 6.66%. That is nearly four times higher than the 1.71% all-industry average WordStream separately found for Facebook traffic-objective campaigns in its 2025 Facebook Ads Benchmarks report, covering 1,180 campaigns from April 2024 through June 2025.
The gap is structural, not a quality signal: search ads intercept an existing intent signal (someone typed the query), while social ads interrupt a browsing session with no expressed intent. Comparing a Facebook campaign's 1.71% CTR against a search benchmark of 6.66% and calling it underperformance misreads what each channel is built to do.
| Business Category (Google/Microsoft Search Ads) | 2025 Avg. CTR | Buyer type |
|---|---|---|
| Arts & Entertainment | 13.10% | B2C |
| Real Estate | 8.43% | Mixed |
| Finance & Insurance | 8.33% | Mixed |
| Automotive — For Sale | 8.29% | B2C |
| Sports & Recreation | 9.19% | B2C |
| Shopping, Collectibles & Gifts | 8.92% | B2C |
| Travel | 8.73% | B2C |
| Restaurants & Food | 7.58% | B2C |
| Personal Services | 7.69% | Mixed |
| Health & Fitness | 7.18% | B2C |
| Career & Employment | 6.57% | Mixed |
| Apparel / Fashion & Jewelry | 6.77% | B2C |
| Physicians & Surgeons | 6.73% | B2C |
| Home & Home Improvement | 6.37% | Mixed |
| Animals & Pets | 6.58% | B2C |
| Industrial & Commercial | 6.23% | B2B |
| Furniture | 6.11% | B2C |
| Education & Instruction | 5.74% | Mixed |
| Beauty & Personal Care | 5.71% | B2C |
| Business Services | 5.65% | B2B |
| Automotive — Repair, Service & Parts | 5.56% | B2C |
| Attorneys & Legal Services | 5.97% | Mixed |
| Dentists & Dental Services | 5.44% | B2C |
Where B2B channels sit: LinkedIn's much lower ceiling
LinkedIn Ads is the closest thing digital advertising has to a B2B-only platform, and its click-through rates reflect that positioning. AgencyAnalytics' LinkedIn Ads benchmark data puts several benchmarked industries at a median CTR between 0.53% and 0.56% — roughly one-twelfth of WordStream's 6.66% search-ad average, and about one-third of WordStream's 1.71% Facebook-traffic average.
This is not a sign that LinkedIn campaigns underperform; it reflects the platform's professional-context browsing behavior and typically longer B2B consideration cycles, where a single ad impression is far less likely to produce an immediate click regardless of targeting quality. LinkedIn's own median ad spend context — AgencyAnalytics reports a median LinkedIn Ads cost of roughly $701.50 — should be read alongside its CTR, not against a search or social benchmark.
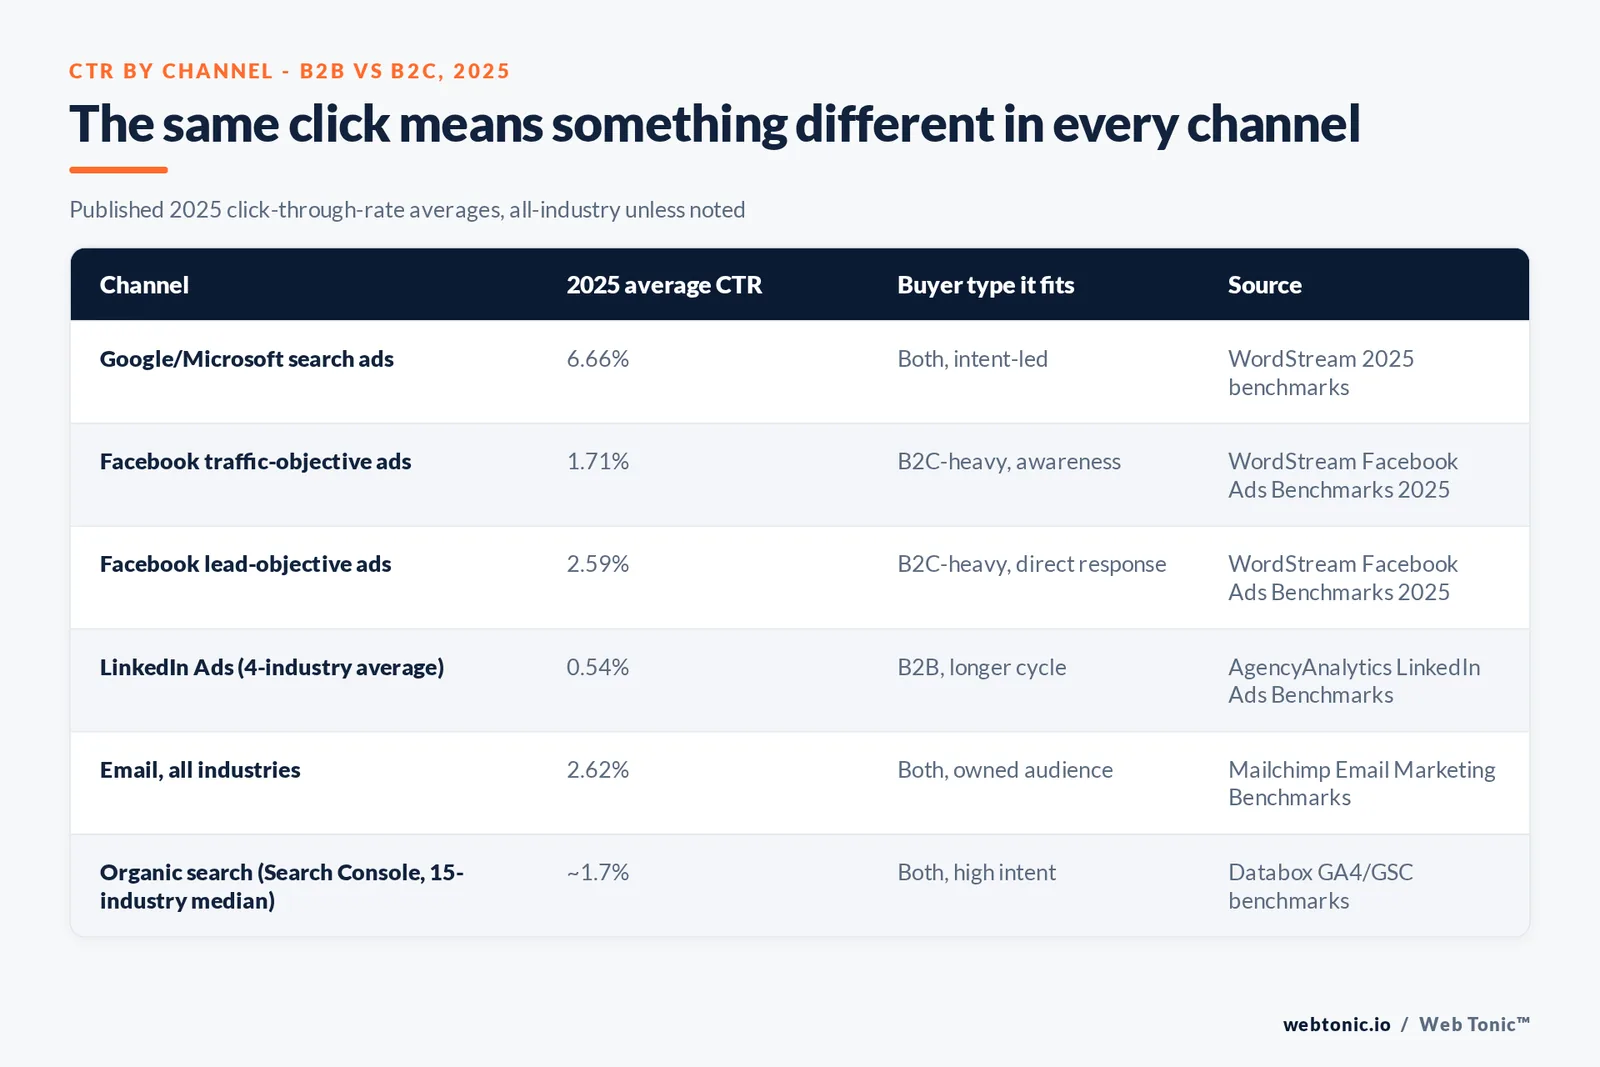
| Channel | All-industry (or representative) CTR | Buyer type it serves | Source |
|---|---|---|---|
| Google/Microsoft search ads | 6.66% | Both, intent-led | WordStream 2025 Google Ads Benchmarks |
| Facebook lead-objective ads | 2.59% | B2C-heavy, direct response | WordStream 2025 Facebook Ads Benchmarks |
| Email, all users | 2.62% | Both, owned audience | Mailchimp Email Marketing Benchmarks |
| Facebook traffic-objective ads | 1.71% | B2C-heavy, awareness | WordStream 2025 Facebook Ads Benchmarks |
| Organic search (15-industry median band) | ~1.2%–2.2% | Both, high intent | Databox Google Search Console benchmarks |
| LinkedIn Ads (4-industry average) | 0.53%–0.56% | B2B, longer cycle | AgencyAnalytics LinkedIn Ads Benchmarks |
Facebook: traffic objective vs. lead objective tell different stories
WordStream's 2025 Facebook Ads Benchmarks report splits its data by campaign objective, and the two objectives produce meaningfully different CTR patterns. Traffic-objective campaigns — optimized purely to drive clicks — averaged 1.71% CTR across all industries, up from 1.58% the prior year. The highest-performing categories were Shopping, Collectibles & Gifts (4.13%), Travel (2.76%), and Sports & Recreation (2.60%); the lowest were Automotive Repair, Service & Parts (0.80%), Physicians & Surgeons (0.83%), and Finance & Insurance (0.98%).
Lead-objective campaigns, optimized to generate form-fill leads rather than raw clicks, averaged a higher 2.59% CTR — about the same as the prior year's 2.58%. Here the ranking flips somewhat: Arts & Entertainment (3.92%), Real Estate (3.75%) and Physicians & Surgeons (3.02%) led, while Dentists & Dental Services (1.05%), Furniture (1.48%) and Health & Fitness (1.72%) trailed. The same industry — Physicians & Surgeons — sits near the bottom on traffic objective (0.83%) but near the top on lead objective (3.02%), underlining that objective, not just industry, drives the number.
| Industry | Facebook Traffic CTR (2025) | Facebook Lead CTR (2025) | Read |
|---|---|---|---|
| Physicians & Surgeons | 0.83% | 3.02% | Same industry, opposite ranking by objective |
| Real Estate | Down 36% YoY on traffic | 3.75% | Lead objective performs far better for this category |
| Arts & Entertainment | Not in top 3 traffic | 3.92% | Highest lead-objective CTR in the set |
| Shopping, Collectibles & Gifts | 4.13% (highest traffic) | Not in top 3 leads | Best fit for a pure-traffic objective |
| Dentists & Dental Services | Not in bottom 3 traffic | 1.05% (lowest leads) | Weakest lead-objective performer measured |
| Finance & Insurance | 0.98% (bottom 3 traffic) | Not in bottom 3 leads | Traffic objective underperforms more than leads here |
Organic search CTR: a narrower, position-driven band
Databox's Google Search Console benchmark data, drawn from its own network of connected accounts, shows organic click-through rate clustering far more tightly than any paid channel: roughly 1.2% to 2.2% across the 15 industries in its set, with Education (2.2%) and Travel & Leisure (2.24%) at the top and Consulting & Professional Services (1.23%) and Health Care (1.27%) at the bottom. That is a much narrower spread than the 5.44%–13.10% range WordStream found in paid search CTR, which makes sense: organic CTR is shaped heavily by ranking position and how many SERP features (ads, featured snippets, local packs) sit above the organic result, factors that compress the industry-specific variation paid placement doesn't face.
| Industry | Organic search CTR (GSC, Databox) | vs. Paid search CTR (WordStream, closest match) |
|---|---|---|
| Education & Instruction | 2.2% | 5.74% (Education & Instruction, paid) |
| Travel & Leisure | 2.24% | 8.73% (Travel, paid) |
| Real Estate | 2.06% | 8.43% (Real Estate, paid) |
| Automotive | 2.04% | 5.56%–8.29% (Automotive categories, paid) |
| Apparel & Footwear | 1.84% | 6.77% (Apparel/Fashion & Jewelry, paid) |
| Health & Wellness | 1.83% | 7.18% (Health & Fitness, paid) |
| Consulting & Professional Services | 1.23% | 5.65% (Business Services, paid, closest match) |
| Health Care | 1.27% | 6.73% (Physicians & Surgeons, paid, closest match) |
What email adds to the B2B vs. B2C picture
Mailchimp's own benchmark data puts the all-users average email click-through rate at 2.62%, with individual industries ranging from Ecommerce's 1.74% up to Non-Profits' 3.27% and Education + Training's 3.02%. Business + Finance, a more B2B-leaning category in Mailchimp's set, sits at 2.78% — closer to the all-users average than either LinkedIn's sub-1% CTR or the highest-performing paid search categories.
Email's position in this comparison matters for budget planning: it consistently outperforms LinkedIn and most Facebook benchmarks on raw CTR while requiring no per-click media cost, which is why several benchmark reports (including Unbounce's separate landing-page research) flag owned-list channels as a comparatively under-leveraged lever relative to paid social spend.
Building a B2B vs. B2C CTR expectation into a media plan
The practical takeaway is not that B2B advertising underperforms — it is that CTR benchmarks must be read within channel and buyer-type context before they inform a decision. A LinkedIn campaign at 0.55% CTR sitting exactly on AgencyAnalytics' Business Services median is performing normally; the same 0.55% CTR on a Facebook traffic campaign, benchmarked against WordStream's 1.71% all-industry average, would be a clear underperformer. Match the platform, match the objective, and only then compare to the buyer-type pattern the data actually shows. Web Tonic's Meta Ads team and Google Ads specialists build this channel-matching step into every account review; our digital marketing statistics hub tracks the broader benchmark set this article draws from.
Frequently Asked Questions
What is the average click-through rate by industry?
It depends heavily on the channel. WordStream's 2025 Google Ads Benchmarks report found the all-industry average search-ad CTR at 6.66%, ranging from 5.44% (Dentists & Dental Services) to 13.10% (Arts & Entertainment) across 23 categories. On Facebook, WordStream's separate 2025 report found a much lower all-industry average of 1.71% for traffic-objective campaigns. There is no single 'average CTR' — always cite the channel alongside the number.
Why is B2B click-through rate lower than B2C on most channels?
LinkedIn Ads, the dominant B2B-specific platform, shows CTRs an order of magnitude below consumer-facing channels: AgencyAnalytics' benchmark data puts several B2B-heavy LinkedIn categories — Advertising & Marketing, Business Services — at a median 0.53% CTR, versus WordStream's 6.66% all-industry search-ad average. B2B buyers typically research over longer cycles and click less impulsively per impression; the CTR reflects consideration stage, not ad quality alone.
Does organic search CTR follow the same industry pattern as paid CTR?
Not exactly. Databox's Google Search Console benchmark data shows organic CTR clustering in a much narrower band — roughly 1.2% to 2.2% across 15 industries — compared with the wider 5.44%–13.10% spread WordStream found in paid search. Organic CTR is shaped by ranking position and SERP feature competition more than by industry-specific buying behavior, which compresses the spread relative to paid channels.
How does email CTR compare to ad CTR?
Mailchimp's own benchmark data puts the all-users average email click-through rate at 2.62%, with individual industries ranging from 1.74% (Ecommerce) to 3.27% (Non-Profits). That sits well below search-ad CTR (6.66% all-industry) but noticeably above most paid social and LinkedIn benchmarks — a reminder that a list you own can outperform a list you rent, even on a metric as basic as click rate.
Should a B2B advertiser expect a lower CTR to mean worse performance?
No — a lower CTR on LinkedIn or another B2B-heavy channel is a structural feature of longer B2B buying cycles, not necessarily a sign of a weak campaign. The more useful comparison is your own CTR against the closest published category on the same platform (for example, your LinkedIn CTR against AgencyAnalytics' Business Services median of 0.53%), rather than against a cross-channel or cross-buyer-type average that measures a fundamentally different behavior.
Sources
WordStream — 2025 Google Ads Benchmarks by Industry
WordStream — Facebook Ads Benchmarks 2025 (PDF)
AgencyAnalytics — LinkedIn Ads Benchmarks
Mailchimp — Email Marketing Benchmarks & Industry Statistics
Databox — Content Marketing Benchmarks by Industry
Google Ads Help — Click-Through Rate (CTR): Definition