



Table of contents
Video ad formats out-attention static ads by a wide margin in premium environments, but the static-versus-dynamic gap collapses - and sometimes reverses - once the environment gets noisy. This page compares the two creative formats on the eye-tracking and attention data that measures them directly, not on platform spend or industry averages.
Key Takeaways
- Average ad viewing time has fallen to 2.3 seconds across digital formats.
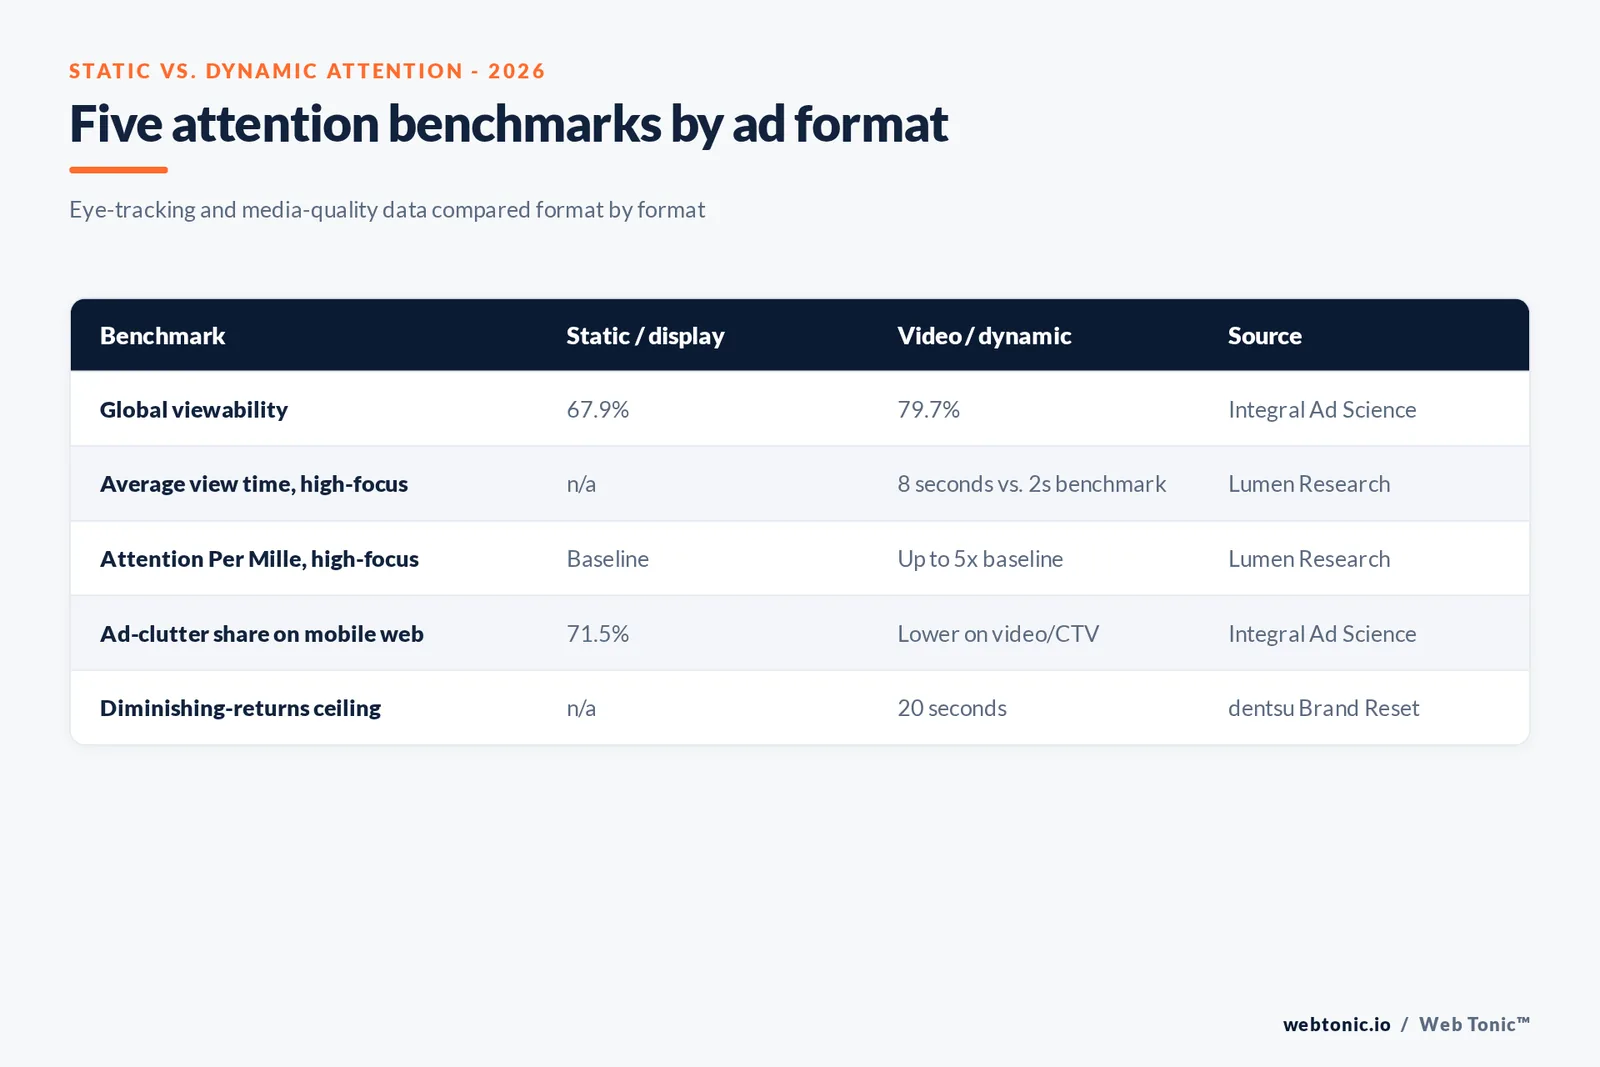
- Video viewability reached 79.7% globally against 67.9% for display.
- That is an 11.8 percentage point gap between video and display viewability.
- High-focus video audiences watch 8 seconds against a 2-second benchmark.
- That is 4 times longer than standard digital video.
- High-focus audiences are nearly 2 times more likely to view a video ad at all.
- APM can run up to 5 times higher in high-focus environments than average.
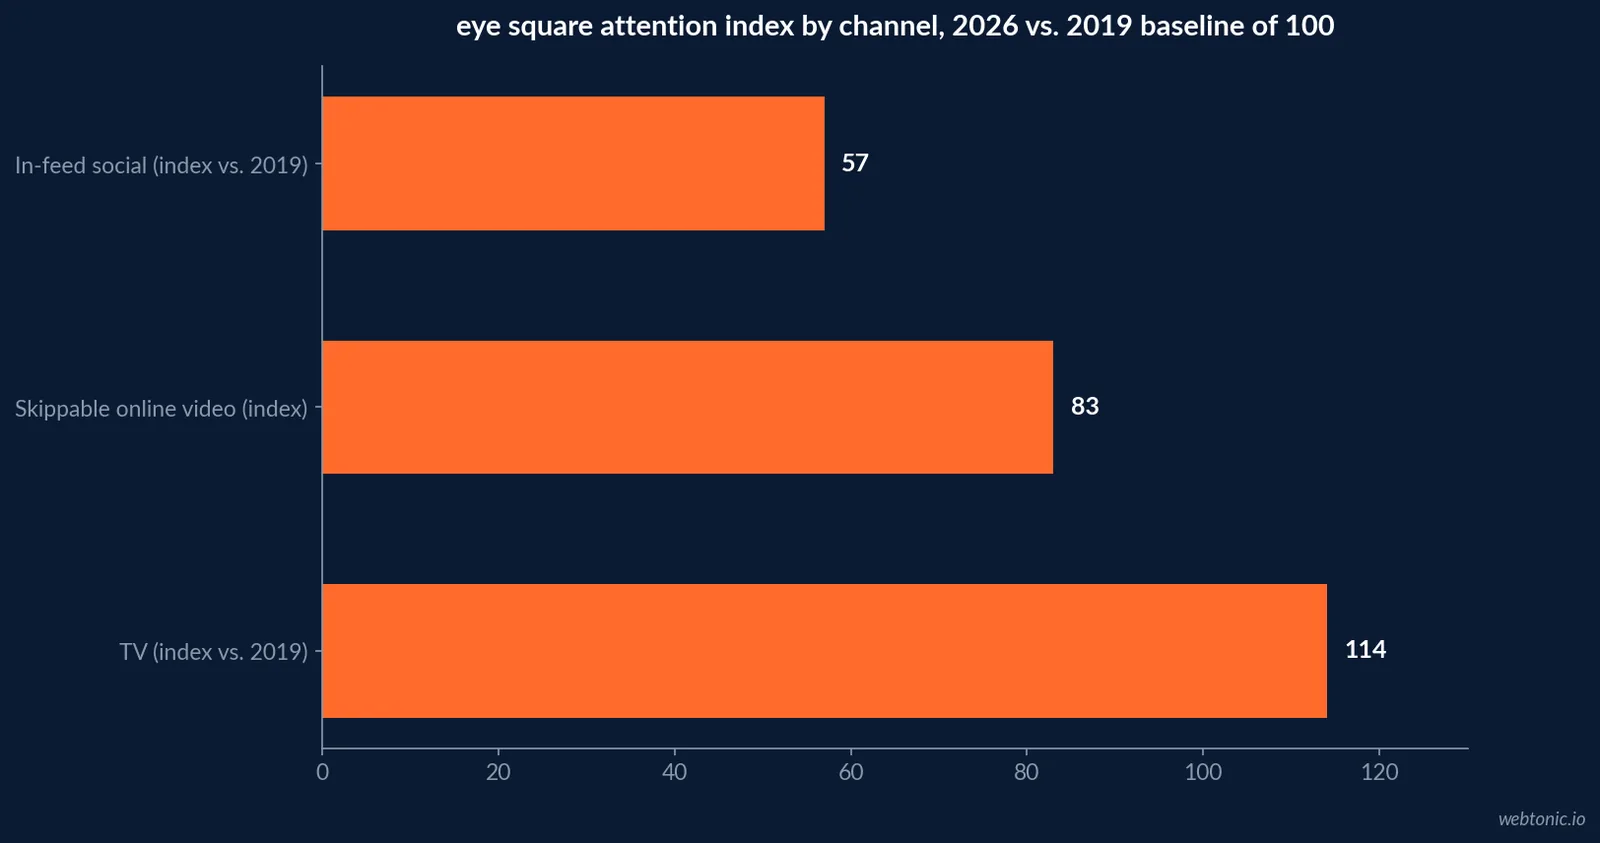
- In-feed ad viewing time is down more than 40% since 2019.
- TV ad attention is up 14% over the same period.
- Instagram carries over 40 ad breaks an hour against roughly 6 for TV.
- Highly creative TV spots reach 2 times the attention of average executions.
- Attention gains fade after 20 seconds of exposure, dentsu finds.
- Skippable formats out-earn non-skippables second for second when watched voluntarily.
- Attention-led video strategies cut cost-per-click by 76% in controlled studies.
- Household sales lift reached 313% higher for high-attention video buys.
- The Brand Reset study drew on 40,000 respondents across the UK and US.
- eye square's benchmark spans nearly 13,000 ads, up from 2,300 in 2019.
- Mobile web display carries 71.9% of MFA impressions despite 45.1% of volume.
What "attention" actually measures on a static-versus-dynamic buy
Attention measurement uses eye-tracking or gaze-prediction models to record whether a person's eyes actually reached an ad, and for how long, rather than whether the ad was merely rendered on a page. Lumen Research tracks this through Attention Per Mille (APM), percent viewed, and average view time - the three metrics that separate a static thumbnail from a video that genuinely holds a gaze.
The comparison only makes sense format-for-format inside the same environment, which is why the data below is grouped by creative format first and channel second.
The environment effect: video wins big only "in the zone"
Lumen Research's independent measurement of Venatus placements found that audiences engaged in high-focus gaming, sports, and entertainment contexts - what the study calls being "In the Zone" - were nearly twice as likely to view a video ad as the benchmark, watched it for eight seconds on average against a two-second industry benchmark for standard digital video, and generated up to five times higher Attention Per 1,000 Impressions than standard video benchmarks. Mike Follett, CEO of Lumen Research, attributes this to attention-to-content transferring to attention-to-ad: absorbing environments extend attention to whatever sits inside them, static or dynamic.
| Format / environment | Attention metric | 2026 figure | Source |
|---|---|---|---|
| Standard digital video | Average view time | 2 seconds (benchmark) | Lumen Research |
| Video, high-focus ("In the Zone") | Average view time | 8 seconds | Lumen Research |
| Video, high-focus | View likelihood | Nearly 2x benchmark | Lumen Research |
| Video, high-focus | Attention Per Mille (APM) | Up to 5x standard video | Lumen Research |
| All digital formats | Average viewing time | 2.3 seconds | eye square / OMD Germany |
| In-feed social | Viewing time index vs. 2019 | Index 57 (-40%+) | eye square / OMD Germany |
Viewability sets the floor; video clears it more often
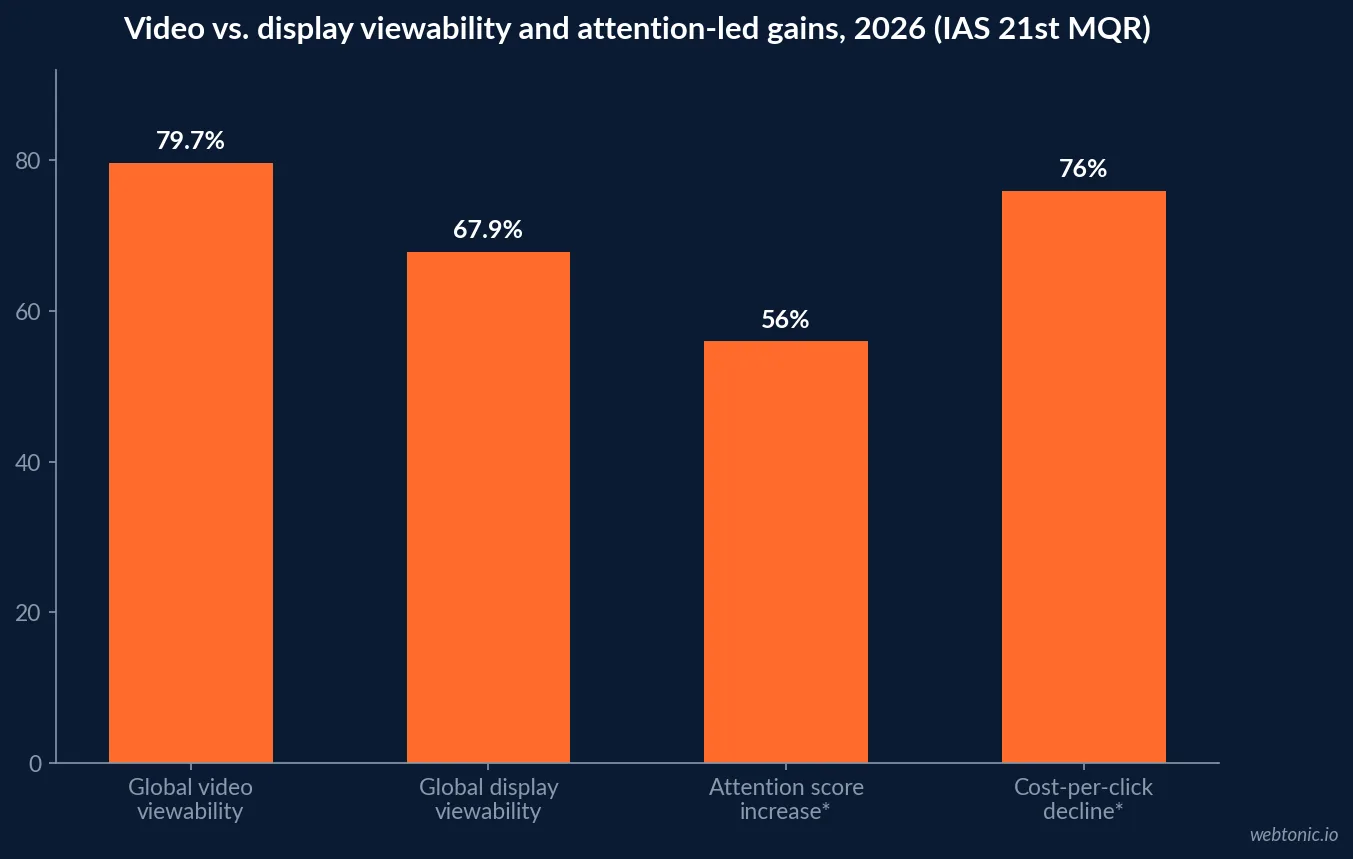
Before attention comes viewability - whether the ad rendered somewhere a person could see it at all. Integral Ad Science's 21st Media Quality Report, drawn from over 300 billion daily digital interactions, found global video viewability at 79.7% against display viewability at 67.9%, an 11.8 percentage point gap that IAS calls a widening structural reality rather than a temporary swing. Controlled campaign studies inside that report linked attention-based video strategies to a 56% increase in attention scores, a 76% decline in cost-per-click, and household-level sales lift up to 313% higher than unoptimized buys.
The same report flags where static and banner formats lose the most ground: mobile web display carried 45.1% of all impressions in the dataset but accounted for 71.5% of global ad clutter and 71.9% of all Made-for-Advertising impressions - the exact conditions that suppress static-ad attention regardless of creative quality.
| 2026 media quality metric | Figure | What it means for static vs. dynamic |
|---|---|---|
| Global video viewability | 79.7% | Video clears the visibility floor more often |
| Global display viewability | 67.9% | Static/banner formats sit below video by 11.8pp |
| Mobile web display share of impressions | 45.1% | The largest static-heavy inventory pool |
| Mobile web display share of MFA impressions | 71.9% | Where static formats lose attention to clutter |
| Time-in-view window for incremental sales | 3-10 seconds | The window either format has to clear |
What happens after the first two seconds
dentsu's Brand Reset study, built with Kantar and Lumen on 40,000 respondents across the UK and US and one of the industry's largest video effectiveness datasets, found that voluntary attention outperforms forced attention second for second: skippable video formats have lower impact overall, but when a viewer chooses to watch for one to two seconds, that impact surpasses non-skippable formats. The same study found attention delivers little additional impact past 20 seconds, which caps how much a longer dynamic format actually buys an advertiser.
That combination - voluntary attention beating forced attention, and a 20-second ceiling on the payoff - argues against defaulting to the longest, most elaborate dynamic unit available. A short, skippable video or a strong static image that earns a genuine glance can out-produce a 30-second non-skippable ad that gets tuned out.
| Attention driver behind the numbers | Effect on static | Effect on dynamic |
|---|---|---|
| High-focus, absorbing environment | Modest lift | Up to 5x APM lift |
| Cluttered, low-quality environment | Attention collapses fast | Attention collapses fast |
| Creative craft above average | Up to 2x attention (eye square) | Up to 2x attention (eye square) |
| Voluntary vs. forced exposure | Not applicable | Voluntary out-earns forced, second for second |
Where creative quality beats format entirely
Amplified's research for WARC, gathering data from over 1,000 individuals and analyzing more than 2,300 ads with sub-second eye-tracking granularity, concluded that outcome data cannot reliably predict attention in either direction - a well-branded static ad and a mediocre video ad can land the same attention score. eye square's own benchmark reinforces this: highly creative TV spots reach up to two times the attention of average executions, and an exceptionally crafted static or pre-roll ad can out-attention an average TV spot within the same 2.3-second window most ads get.
The takeaway for a creative brief is unglamorous but consistent across every source here: format chooses the ceiling, but execution decides whether an ad gets anywhere near it. Our performance creative team builds both static and video variants to that standard rather than assuming one format wins by default.
| Attention driver | Effect size (2026 data) | Applies to |
|---|---|---|
| High-focus environment ('In the Zone') | Up to 5x APM | Video |
| Creative quality vs. average execution | Up to 2x attention | Both formats |
| Voluntary vs. forced viewing | Higher impact per second, voluntary | Skippable video |
| Ad-break density (Instagram vs. TV) | 40+ vs. ~6 breaks/hour | Both formats |
| Exposure length past 20 seconds | Little added impact | Video |
Where the incremental ad dollar is actually going
Spend data backs up the environment-first reading of the attention numbers. IAB's 2026 Outlook Study: September Update, based on more than 200 brand and agency ad-investment decision-makers, raised the full-year US ad spend forecast to +12.3% and found social and CTV - the two channels most able to deliver the sustained, voluntary attention dentsu and Lumen measured - widening their lead as the fastest-growing channels, projected at 16.5% and 15.6% growth respectively. Static-heavy display and paid search, by contrast, are projected to grow in the high single digits.
That is not evidence that static creative is being abandoned - it is evidence that budget is following the channels where dynamic formats can actually earn the sustained attention the data above rewards, while static creative remains the cost-efficient default everywhere else.
| Channel (2026 growth forecast) | Projected YoY change | Format mix | Source |
|---|---|---|---|
| Social | +16.5% | Mostly dynamic / video-first | IAB 2026 Outlook Study |
| Connected TV | +15.6% | Video only | IAB 2026 Outlook Study |
| Digital video (excl. CTV) | +9.6% | Video only | IAB 2026 Outlook Study |
| Paid search | +8.2% | Mostly static / text | IAB 2026 Outlook Study |
| Overall US ad spend | +12.3% | Mixed | IAB 2026 Outlook Study |
Budgeting the format mix
None of these sources argue for an all-video or all-static plan. IAS's own framing is that 88% of experts (per its 2026 Industry Pulse Report cited in the same research line) rank digital video as a top investment priority, while static and display formats still carry the bulk of programmatic scale and the lowest cost per placement. The practical split is to route budget toward video in verified, high-focus placements where the 5x-APM and 313%-sales-lift effects actually show up, and keep static creative - built to the same 2-second standard - everywhere else.
Our growth marketing practice plans that mix against verified attention data rather than a fixed video-first rule, and our guide to what Facebook ad formats cost breaks down the price gap between the two creative types in more detail. For the wider channel picture behind these format numbers, see our digital marketing statistics roundup or talk to our Meta Ads team about testing both formats in the same buy.
Frequently Asked Questions
Do video ads really get more attention than static ads?
In aggregate, yes, but the margin depends entirely on environment. Lumen Research's analysis of Venatus placements found audiences in high-focus contexts were nearly twice as likely to view a video ad and watched it four times longer - eight seconds against a two-second industry benchmark for standard digital video. Integral Ad Science's 21st Media Quality Report puts global video viewability at 79.7% against 67.9% for display, an 11.8 percentage point gap. Outside a high-focus environment, that gap narrows fast: eye square's 13,000-ad benchmark shows average ad viewing time has fallen to 2.3 seconds across all digital formats, video included.
Is a well-made static ad ever the better bet?
Yes, on cost and on certain formats. WARC and Amplified's attention-outcomes research, gathered from more than 2,300 ads and 1,000 respondents, found that outcome-based attention metrics do not predict engagement reliably in either direction - a highly creative static execution can outscore an average video in the same buy. Eye square found highly creative TV spots reach twice the attention of average executions, a creative-quality effect that applies to static formats too.
How long does an ad actually need to hold attention?
dentsu's Brand Reset study, built with Kantar and Lumen on 40,000 respondents, found that attention delivers diminishing returns after 20 seconds and that voluntary attention on skippable formats works harder second for second than forced exposure on non-skippable ones. A static ad that earns a genuine two-second glance can out-produce a video that gets skipped at second one.
Which format is declining fastest in 2026?
In-feed social placements. Eye square's benchmark shows in-feed ad viewing time has dropped more than 40% since 2019 (index 57), the steepest fall of any channel measured, while TV attention rose 14% over the same period. The driver is ad-break density: eye square counts more than 40 ad breaks an hour on platforms like Instagram against roughly six an hour on TV.
Should the media plan weight budget toward video because of these numbers?
Only where the environment supports sustained viewing. IAS links attention-based video strategies to a 76% decline in cost-per-click and household sales lift up to 313% higher, but that lift comes from campaigns run in verified, high-quality environments - not from video as a format in isolation. A static ad in a premium context regularly beats a video ad in a cluttered one.
Sources
Lumen Research - Venatus attention analysis
Integral Ad Science - 21st Media Quality Report
eye square / OMD Germany - Attention: 2.3 Seconds of Magic
dentsu - The Brand Reset, built with Kantar and Lumen
Amplified for WARC - Attention Applied: The Nuance of Size
Integral Ad Science - Why your strategy is only as strong as your media quality
IAB - 2026 Outlook Study: September Update


