



Table of contents

US digital ad revenue reached USD 294.6 billion in 2025, up 13.9% year over year, and mobile carries the largest share of that growth. But the same reporting period shows organic traffic - the number every marketer uses as a clean baseline - now hosting 52% of all fraudulent mobile installs. This page separates the real revenue story from the fraud story so a 2026 mobile budget gets evaluated on delivered value, not headline spend.
Key Takeaways
- US digital ad revenue hit USD 294.6 billion in 2025, up 13.9% year over year.
- Social ad revenue reached USD 117.7 billion, growing 32.6% year over year.
- Programmatic advertising rose 20.5% to USD 162.4 billion.
- Creator advertising spend hit USD 37 billion in 2025, forecast at USD 44 billion for 2026.
- Search revenue reached USD 114.2 billion, still the single largest category.
- Global app downloads reached nearly 150 billion in 2025, up 0.8% year over year.
- Consumers spent 5.3 trillion hours in apps, roughly 3.6 hours per user per day.
- In-app purchase revenue hit USD 167 billion, up 10.6% year over year.
- Organic traffic now accounts for 52% of all fraudulent mobile installs.
- Organic and affiliate channels combine for roughly 9 in 10 fraudulent installs.
- Self-reporting networks carry just 1.5% of fraud, the cleanest channel measured.
- iOS fraud fell 33% year over year, from 17.5% to 11.7%.
- Android fraud held flat near 14-15% across the same period.
- Gambling fraud on Android rose to 59%, peaking at 64% in Q4 2025.
- Social Media on iOS saw a 275% Real Users Lift for one full quarter in 2025.
- The AppsFlyer fraud dataset spans 106.4 billion installs across 246,000 apps.
| Mobile advertising benchmark, 2025-2026 | Figure | Source |
|---|---|---|
| US digital ad revenue, 2025 | USD 294.6 billion, +13.9% YoY | IAB/PwC Internet Advertising Revenue Report |
| Programmatic advertising revenue | USD 162.4 billion, +20.5% YoY | IAB/PwC Internet Advertising Revenue Report |
| Global app downloads, 2025 | ~150 billion, +0.8% YoY | Sensor Tower State of Mobile 2026 |
| Global in-app purchase revenue, 2025 | USD 167 billion, +10.6% YoY | Sensor Tower State of Mobile 2026 |
| Total mobile installs analyzed for fraud | 106.4 billion across 246,000 apps | AppsFlyer State of Fraud for Marketers 2026 |
| Organic traffic share of fraudulent installs | 52% | AppsFlyer State of Fraud for Marketers 2026 |
What mobile advertising actually bought in 2025
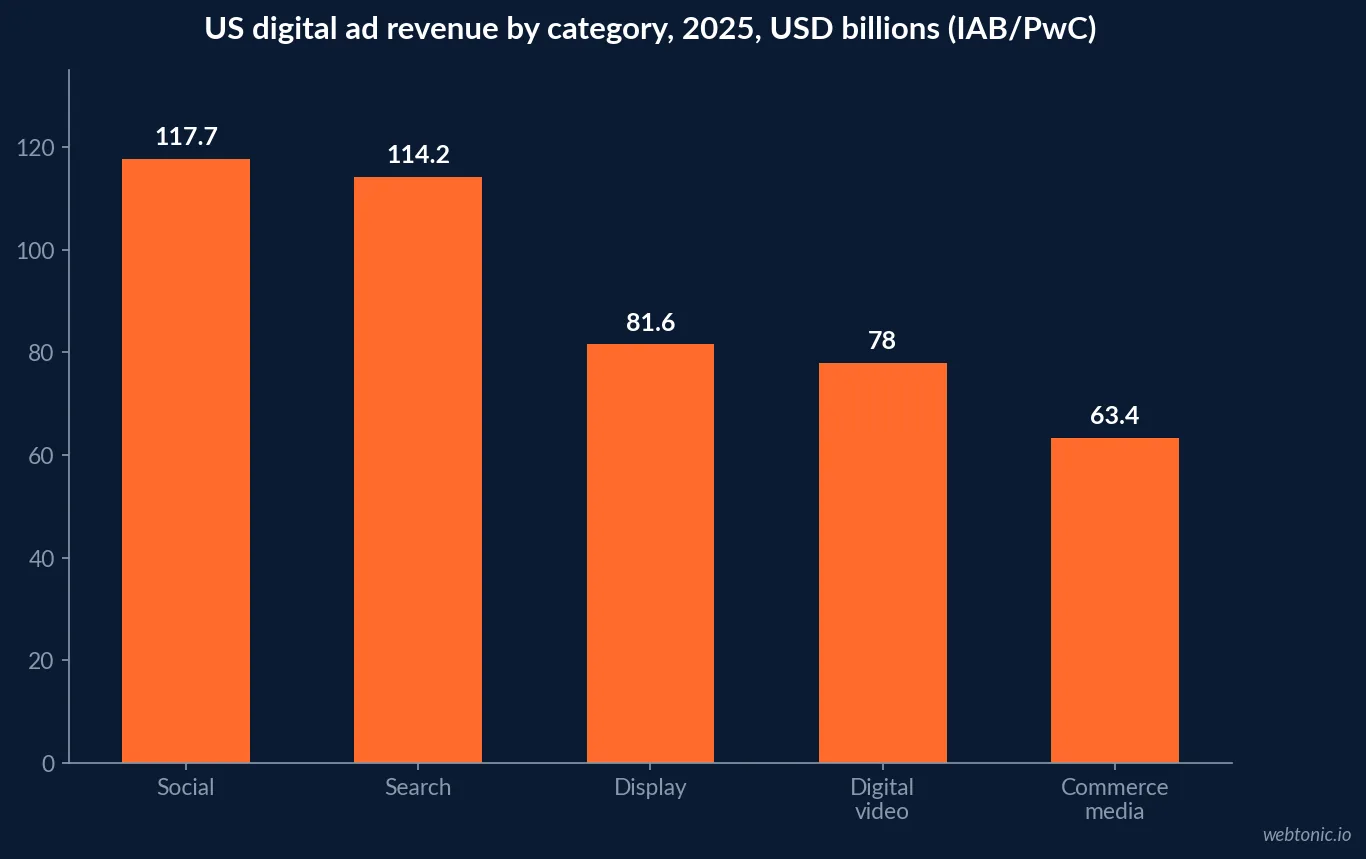
Start with the category that gets cited without context: total spend. The IAB/PwC 2025 Internet Advertising Revenue Report puts full-year US digital ad revenue at USD 294.6 billion, a 13.9% increase achieved without a major cyclical event such as an Olympic year or election cycle to inflate it. Social media ad revenue led growth at USD 117.7 billion (up 32.6%), commerce media grew 18.0% to USD 63.4 billion, and programmatic buying - the infrastructure most mobile inventory now trades through - rose 20.5% to USD 162.4 billion.
Search still holds the largest single share at USD 114.2 billion, but its growth rate slowed to 11% from 15.9% a year earlier, a sign that budget is migrating toward the faster-growing performance channels above it in this table.
| US digital ad revenue by category, 2025 | Revenue | YoY growth | Share of total |
|---|---|---|---|
| Social | USD 117.7 billion | 32.6% | 40.0% |
| Search | USD 114.2 billion | 11.0% | 38.8% |
| Display | USD 81.6 billion | 9.8% | 27.7% |
| Digital video | USD 78 billion | 25.4% | 26.5% |
| Commerce media | USD 63.4 billion | 18.0% | 21.5% |
| Podcast | USD 2.9 billion | 17.6% | 1.0% |
How much of that spend is landing on a real device
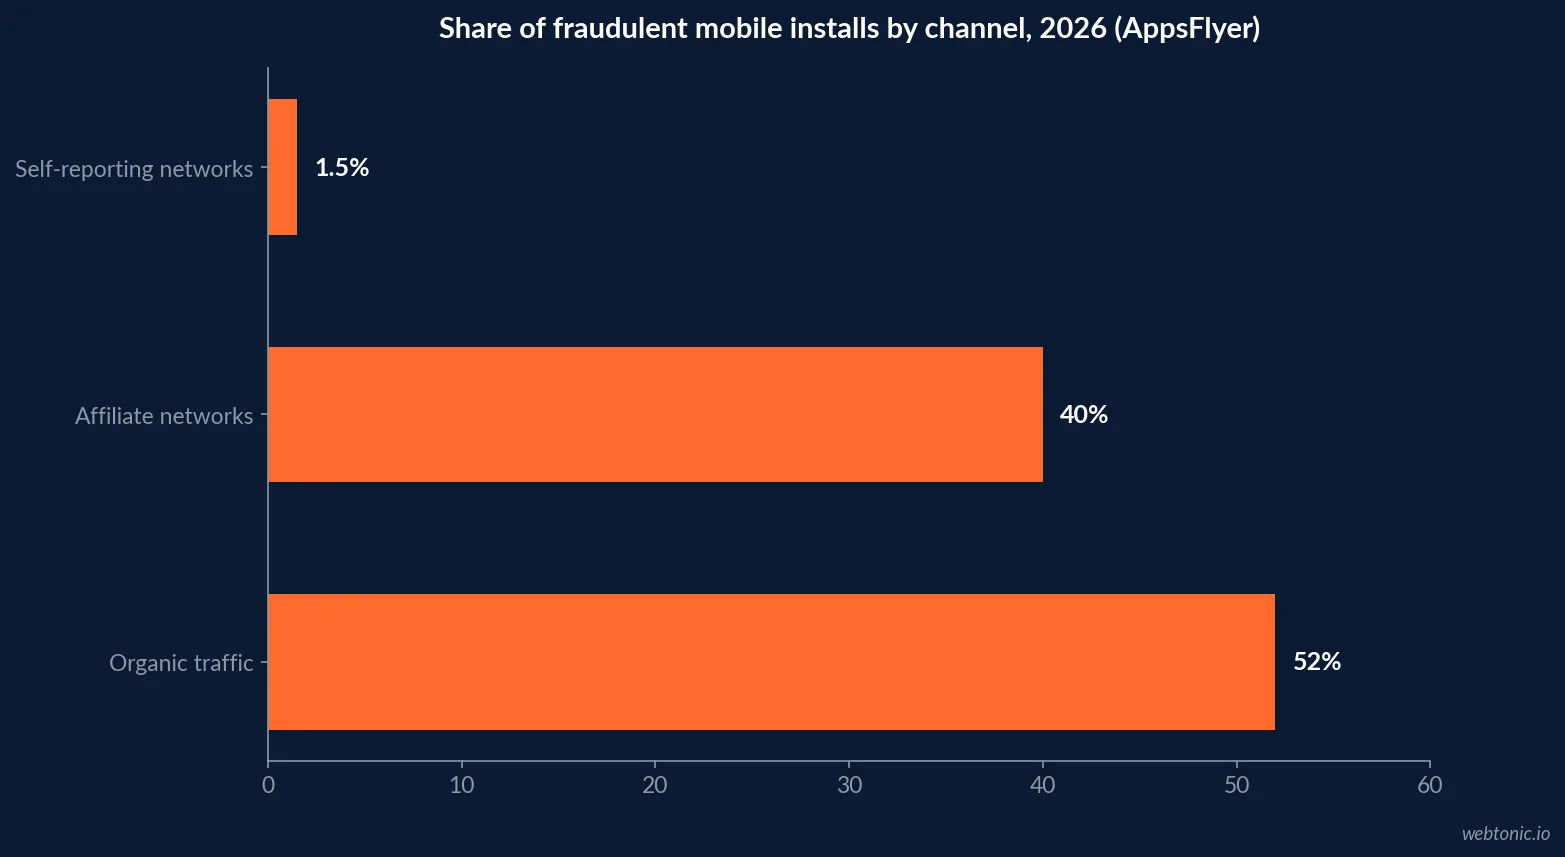
Revenue growth alone does not tell an advertiser what share of that spend reaches a real person. The IAB/PwC report measures dollars changing hands, not delivery quality. For that, the relevant study is AppsFlyer's State of Fraud for Marketers 2026, built from 106.4 billion installs across 246,000 apps between Q1 2025 and Q1 2026. Its headline finding reframes how every other mobile metric should be read: organic traffic, the number teams use as their clean internal benchmark, is now the single largest fraud channel, at 52% of all fraudulent installs.
That matters because paid-campaign performance is judged against the organic baseline. Inflate organic - through fake self-discovered installs or misattributed paid traffic defaulting to "organic" - and every paid campaign looks better by comparison than it actually is. As AppsFlyer's own commentary on the report put it, a lot of marketers are currently optimizing against a benchmark that has been moved without their knowledge.
| Fraud channel, Q1 2025-Q1 2026 | Share of fraudulent installs | Source |
|---|---|---|
| Organic traffic | 52% | AppsFlyer State of Fraud for Marketers 2026 |
| Affiliate networks | ~40% | AppsFlyer State of Fraud for Marketers 2026 |
| Self-reporting networks (SRNs) | 1.5% | AppsFlyer State of Fraud for Marketers 2026 |
| iOS overall fraud rate, Q1 2026 | 11.7%, down from 17.5% | AppsFlyer State of Fraud for Marketers 2026 |
| Android overall fraud rate | 14-15%, flat YoY | AppsFlyer State of Fraud for Marketers 2026 |
| Gambling fraud on Android, Q4 2025 peak | 64% | AppsFlyer State of Fraud for Marketers 2026 |
The platforms are diverging, not converging
For the first time in the period AppsFlyer tracked, buying on iOS delivered proportionally more real users than buying on Android. Overall iOS fraud dropped 33% year over year, falling from 17.5% in Q1 2025 to 11.7% in Q1 2026, while Android held largely flat in the 14-15% range across the same window. That reversal is recent enough that media plans built on 2024 platform assumptions are already out of date.
Vertical-level detail matters more than the platform average. On Android, Gaming fraud sits at a contained 7%, Shopping at 10%, and Finance at 31% - but Gambling is the outlier, with fraud climbing from 49% to 59% year over year and peaking at 64% in Q4 2025. Every other vertical AppsFlyer tracked either held flat or improved, according to Advanced Television's coverage of the report.
Real Users Lift: the number that should change a media plan
AppsFlyer's report introduces Real Users Lift as the most direct way to express what a fraud rate costs: the ratio of fake installs to real ones. A 175% Real Users Lift in Gambling on Android in Q4 2025 means an advertiser paid for nearly two fake installs for every real user acquired. Social Media on iOS hit an even more extreme 275% Real Users Lift in Q2 2025 - for one full quarter, three in four installs in that category were fake - before recovering to 15.6% by Q1 2026.
Finance on Android tells a different story: Real Users Lift has been locked between 50% and 53% for five consecutive quarters with no improvement, meaning roughly half of what Finance advertisers think they are acquiring on Android does not exist, and that has not shifted since Q1 2025, per CustomerThink's summary of the AppsFlyer findings.
| Vertical, Android, 2026 | Fraud rate or Real Users Lift | Direction vs. prior year |
|---|---|---|
| Gaming | 7% fraud rate | Contained, stable |
| Shopping | 10% fraud rate | Contained, stable |
| Finance | 31% fraud rate; 50-53% Real Users Lift | Stagnant for 5 quarters |
| Gambling | 49% to 59% fraud rate, peak 64% in Q4 | Only vertical still accelerating |
Where the growth budget should actually go
Read together, the two studies point to a specific allocation shift rather than a blanket spend increase. Creator advertising, at USD 37 billion in 2025 and forecast to reach USD 44 billion in 2026 per the IAB/PwC report, is growing faster than the broader market precisely because it runs through relationships and attribution paths that are harder to spoof at scale than open programmatic exchanges. Commerce media, up 18% to USD 63.4 billion, carries a similar advantage: it is powered by first-party purchase data rather than third-party install attribution.
If your paid-media plan still treats organic as a free, clean acquisition channel, this is the year to stop. Build fraud-adjusted CAC into the model before deciding how much new budget mobile earns, and lean on a measurement and attribution partner that can separate a real install from an inflated one.
Setting a realistic 2026 mobile ad budget
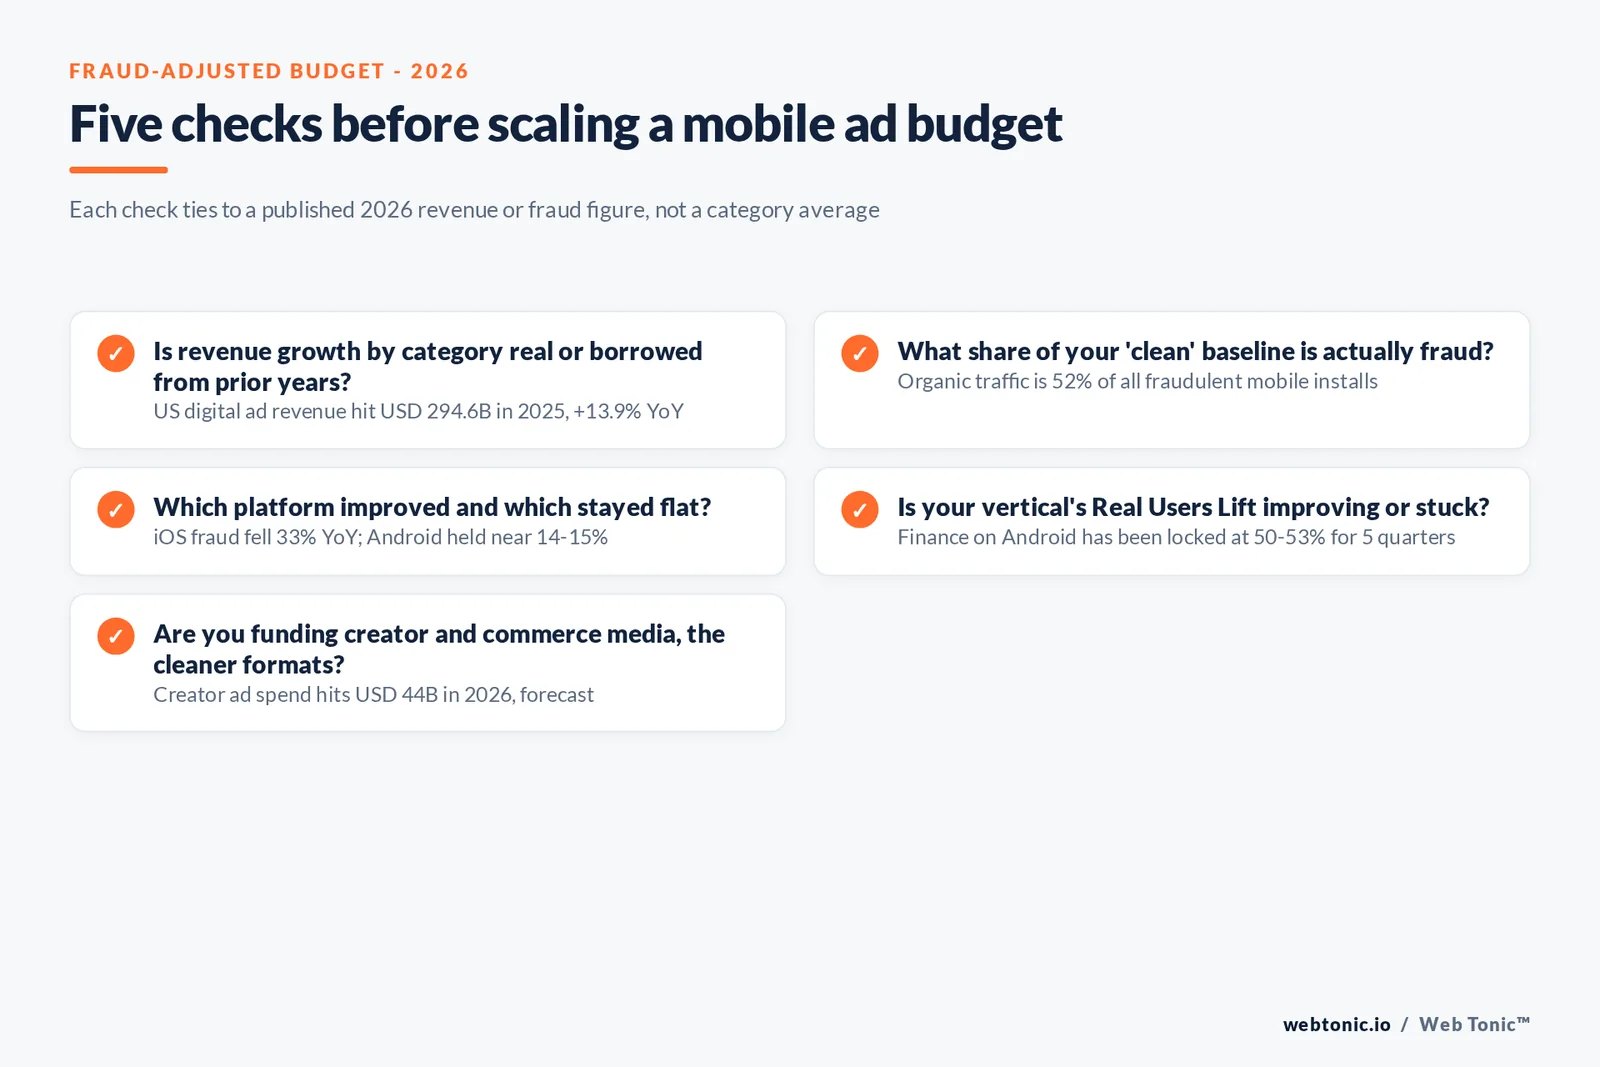
Three inputs belong in the budget conversation before a single new dollar moves: the category growth rate from the IAB/PwC report, the fraud rate for your specific vertical and platform (not the category average), and the Real Users Lift trend over the last two quarters. A vertical showing a stagnant or worsening Real Users Lift, like Finance on Android, should get a fraud-detection layer funded before it gets a spend increase.
For teams weighing mobile spend against other paid channels, our breakdown of what search advertising costs in 2026 is a useful cross-channel comparison point, and our Meta Ads practice can help stand up the measurement layer this data set argues for.
What changes the calculus mid-year
Watch two signals through the rest of 2026: whether Android's opt-in and consent changes narrow its fraud gap with iOS further, and whether Gambling's climbing Android fraud rate spreads to adjacent high-payout verticals the way Finance fraud migrated from affiliate to organic channels earlier in the tracked period. Either shift would move the vertical-level numbers in this page's tables within a quarter or two.
Talk to our team if you need the fraud-adjusted numbers modeled against your own account before you lock a Q3 or Q4 mobile budget.
Putting the two studies on one page
Neither the IAB/PwC revenue report nor the AppsFlyer fraud report was designed to be read alone for a budget decision. The revenue report tells you the category is growing and where; the fraud report tells you how much of the growth in any single vertical or platform you can trust at face value. A mobile ad budget built only on the first number risks funding the same fraud-inflated channels that made last year's results look stronger than they were. A budget built only on the second becomes overly conservative and misses genuinely growing, cleaner formats like creator and commerce media.
The workable process: size the category opportunity from the IAB/PwC data, then discount it by the fraud rate and Real Users Lift trend specific to your platform and vertical from the AppsFlyer data, and only then compare that fraud-adjusted number against last year's actual delivered results.
| Budget input | Where it comes from | What it corrects for |
|---|---|---|
| Category revenue growth rate | IAB/PwC Internet Advertising Revenue Report | Sizes the total opportunity |
| Platform fraud rate trend (iOS vs. Android) | AppsFlyer State of Fraud for Marketers 2026 | Corrects for platform-level delivery quality |
| Vertical-level Real Users Lift | AppsFlyer State of Fraud for Marketers 2026 | Corrects for category-specific fraud spikes |
| Prior-period delivered results | Your own account data | Anchors the model to what actually happened |
Frequently Asked Questions
Is mobile advertising still worth the investment in 2026?
Yes, on the revenue trend: US digital ad revenue reached USD 294.6 billion in 2025, up 13.9% year over year, and mobile carries most of that growth. The catch is that the return depends on which channel and platform you buy, since organic-traffic fraud and platform-level fraud rates now distort the baseline marketers compare paid campaigns against.
How much of mobile ad spend is actually fraud?
AppsFlyer's State of Fraud for Marketers 2026, covering 106.4 billion installs across 246,000 apps, found organic traffic now accounts for 52% of all fraudulent mobile installs, with affiliate channels contributing close to 40% more. Self-reporting networks, by contrast, account for just 1.5% of fraud, which is the cleanest baseline most teams are not using.
Is iOS or Android a safer buy in 2026?
iOS improved sharply: overall iOS fraud dropped 33% year over year, from 17.5% in Q1 2025 to 11.7% in Q1 2026, and crossed below Android for the first time in the period tracked. Android held largely flat in the 14-15% range, though results vary heavily by vertical.
Which mobile ad format is growing fastest?
Social carried the largest share of US digital ad revenue in 2025 at USD 117.7 billion (32.6% growth), and programmatic buying rose 20.5% to USD 162.4 billion, per the IAB/PwC 2025 Internet Advertising Revenue Report. Creator advertising spend reached USD 37 billion in 2025 and is forecast to hit USD 44 billion in 2026, the fastest-growing line in the report.
What should a mobile advertiser check before scaling spend?
Check the Real Users Lift on the specific platform and vertical you buy, not the category average. Gambling on Android hit a 175% Real Users Lift in Q4 2025, meaning almost two fake installs per real one, while Finance on Android has been stuck between 50% and 53% for five straight quarters. A category-average fraud rate hides swings like these.
Sources
IAB - Digital Ad Revenue Climbs to Nearly $300B (2025 IAB/PwC Internet Advertising Revenue Report)
Sensor Tower - State of Mobile 2026
AppsFlyer State of Fraud for Marketers 2026, reported via ppc.land
IAB/PwC Internet Advertising Revenue Report Full Year 2025, reported via ppc.land
AppsFlyer - mobile marketing measurement and fraud protection
Advanced Television - Report: Organic Traffic Now Largest Ad Fraud Channel
CustomerThink - AppsFlyer: Organic Traffic Is Now the Single Largest Ad Fraud Channel


