



Table of contents
US digital ad revenue hit $294.6 billion in 2025, up 13.9% year over year, and the 2026 forecast has been raised twice this year to +12.3% growth - but that growth is not spread evenly: social and connected TV are pulling share away from display and even from search.
Key Takeaways
- US digital ad revenue reached $294.6 billion in 2025.
- That is 13.9% growth year over year.
- The 2026 growth forecast was raised to +12.3%, from 9.5% in January.
- Global advertising revenue is projected to cross $1 trillion in 2026.
- Social media revenue grew 32.6% to $117.7 billion in 2025.
- Search revenue reached $114.2 billion, still the largest single category.
- Display revenue grew 9.8% to $81.6 billion.
- Digital video revenue grew 25.4% to $78 billion.
- Commerce media grew 18% to $63.4 billion.
- Programmatic buying rose 20.5% to $162.4 billion.
- Creator advertising spend reached $37 billion in 2025.
- Creator spend is projected to reach $44 billion in 2026.
- Display click-through rates average between 0.12% and 0.40% by industry.
- Customer acquisition became the top media goal at 63% of buyers, up 9 points.
- 54% of buyers are increasing focus on creator and influencer advertising.
- US retail media spend is forecast at $69.33 billion in 2026.
Online advertising benchmarks at a glance
| Metric | 2025/2026 figure | Source |
|---|---|---|
| US digital ad revenue, full-year 2025 | $294.6 billion (+13.9% YoY) | IAB/PwC |
| 2026 US ad spend growth forecast | +12.3% YoY | IAB, Sept. 2026 update |
| Global advertising revenue, 2026 | Crosses $1 trillion | PwC Global E&M Outlook |
| Programmatic ad spend, 2025 | $162.4 billion (+20.5%) | IAB/PwC |
| Creator advertising spend, 2025 → 2026 | $37B → $44B (projected) | IAB/PwC |
The base numbers come from the IAB/PwC Internet Advertising Revenue Report, the industry's standard benchmark since 1996, and the IAB's own 2026 Outlook Study: September Update, based on more than 200 brand and agency ad investment decision-makers. Both point the same direction: growth is real, but it is concentrated in a shrinking number of formats.
Revenue by category: who actually grew in 2025
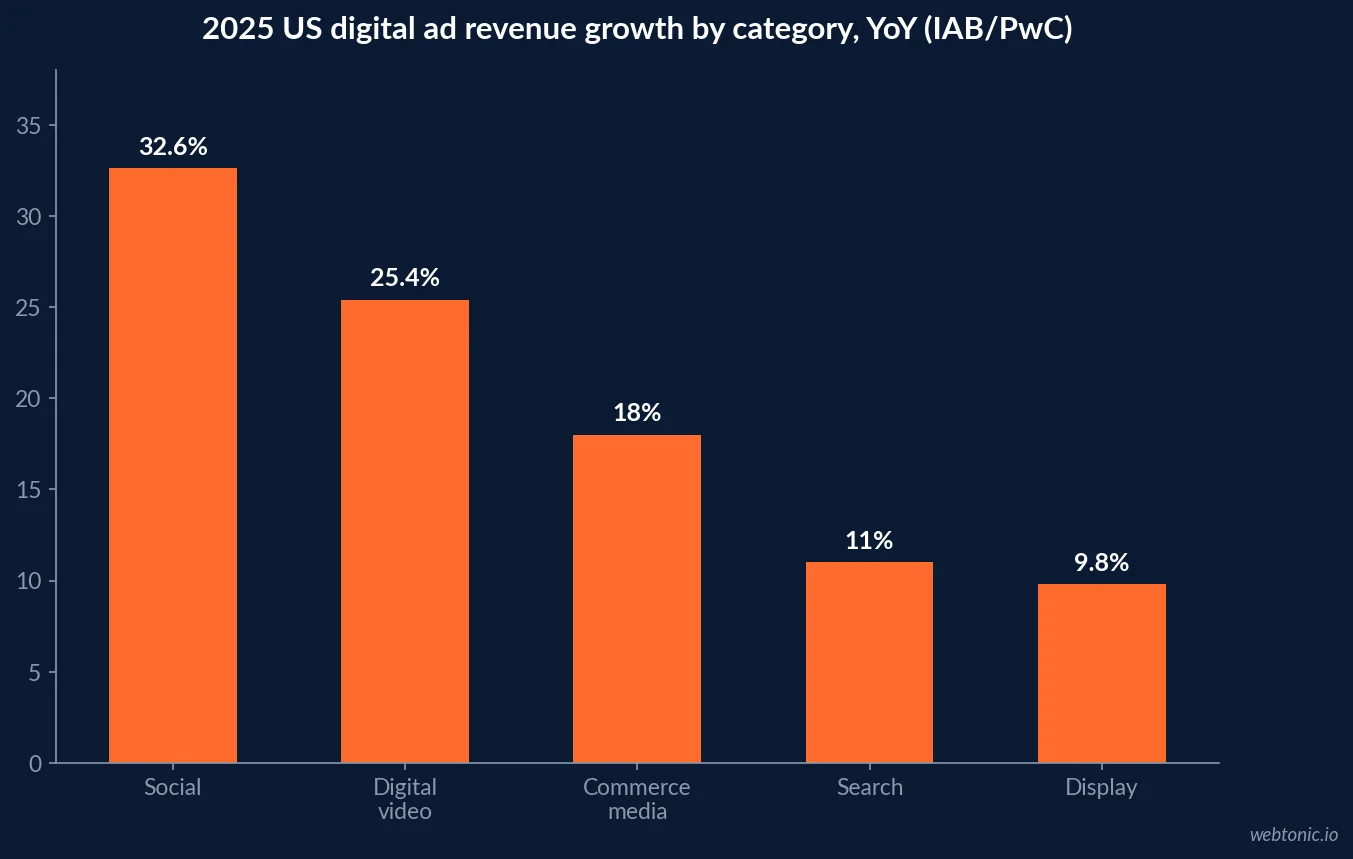
| Ad category | 2025 revenue | YoY growth | Share of total |
|---|---|---|---|
| Social | $117.7B | +32.6% | 40.0% |
| Search | $114.2B | +11% | 38.8% |
| Display | $81.6B | +9.8% | 27.7% |
| Digital video | $78B | +25.4% | 26.5% |
| Commerce media | $63.4B | +18% | 21.5% |
| Podcast | $2.9B | +17.6% | 1.0% |
Category shares overlap by design (video spend counted inside social, for example), per the IAB/PwC methodology - read each row as its own growth story rather than a set that sums to 100%.
The channel forecast for the rest of 2026
The IAB's September 2026 Outlook Study update revised its channel-level projections upward almost across the board, with social and connected TV widening their lead as the fastest-growing channels of the year.
| Channel | Sept. 2026 projected growth | January 2026 projection | Change |
|---|---|---|---|
| Social media | 16.5% | 14.6% | +1.9 pts |
| CTV | 15.6% | 13.8% | +1.8 pts |
| Commerce media | 13.6% | 12.1% | +1.5 pts |
| Digital video excl. CTV | 9.4% | 9.6% | -0.2 pts |
| Podcasts | 8.7% | 8.6% | +0.1 pts |
| Paid search | 8.1% | 8.2% | -0.1 pts |
| DOOH | 7.0% | 7.4% | -0.4 pts |
| Linear TV | -1.5% | -1.7% | +0.2 pts |
Display performance: the format buyers underrate
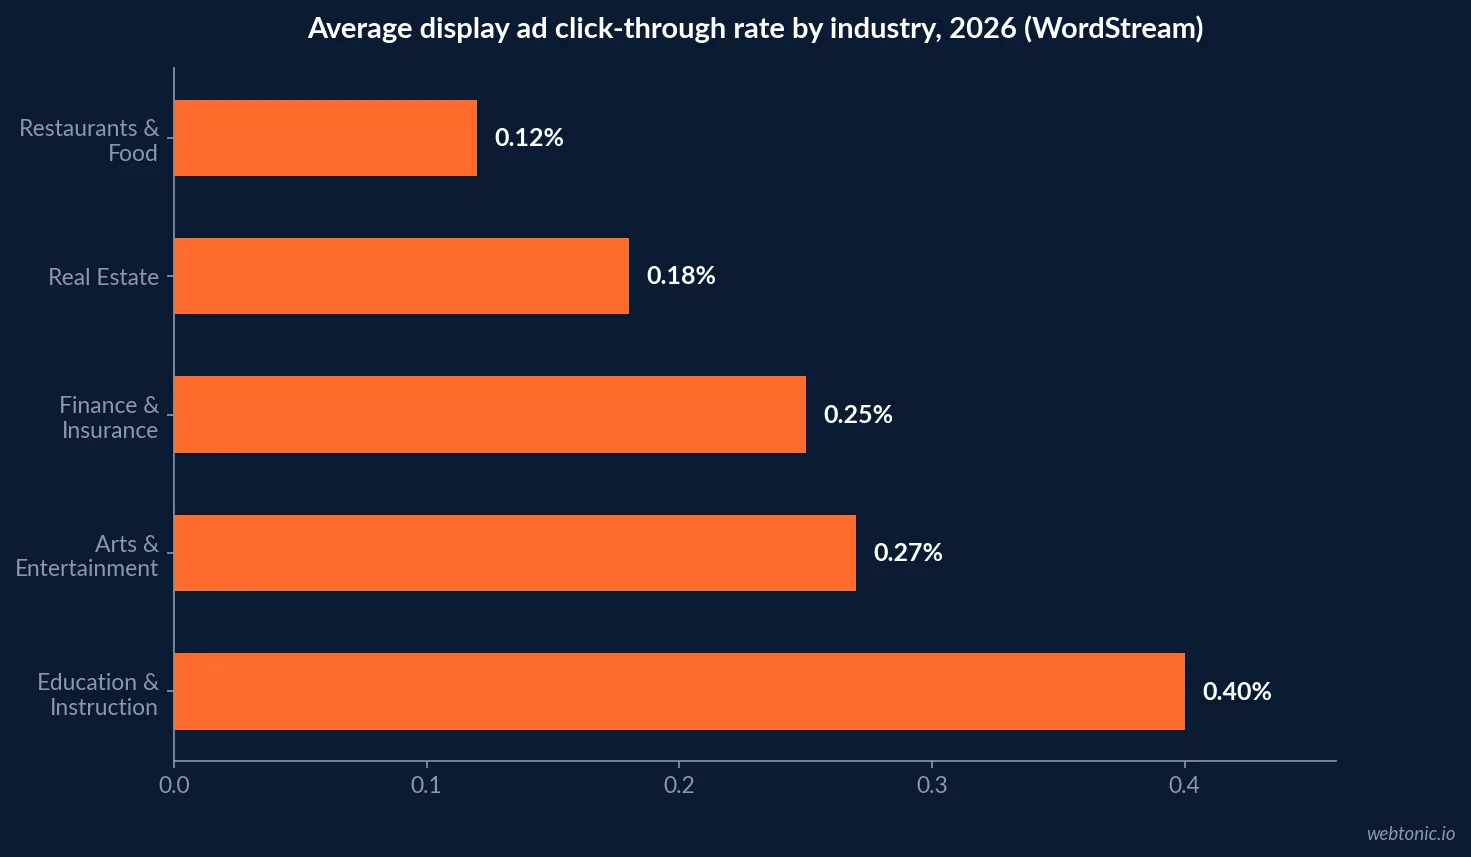
WordStream's 2026 benchmark, drawn from more than 60,000 display and video campaigns, found average click-through rates ranging from 0.12% in Restaurants & Food up to 0.40% in Education & Instruction. Cost per lead ran from about $65 (Home & Home Improvement) to over $230 (Arts & Entertainment). Low click-through is expected for a passive, impression -led format - the benchmark to manage against is view-through impact and cost per lead, not a search-ad CTR comparison.
| Industry (WordStream 2026) | Avg. display CTR | Avg. cost per lead |
|---|---|---|
| Education & Instruction | 0.40% | $106.70 |
| Arts & Entertainment | 0.27% | $230.44 |
| Business Services | 0.25% | $149.90 |
| Finance & Insurance | 0.25% | $85.63 |
| Restaurants & Food | 0.12% | $97.51 |
Programmatic and the creator economy: the two structural shifts
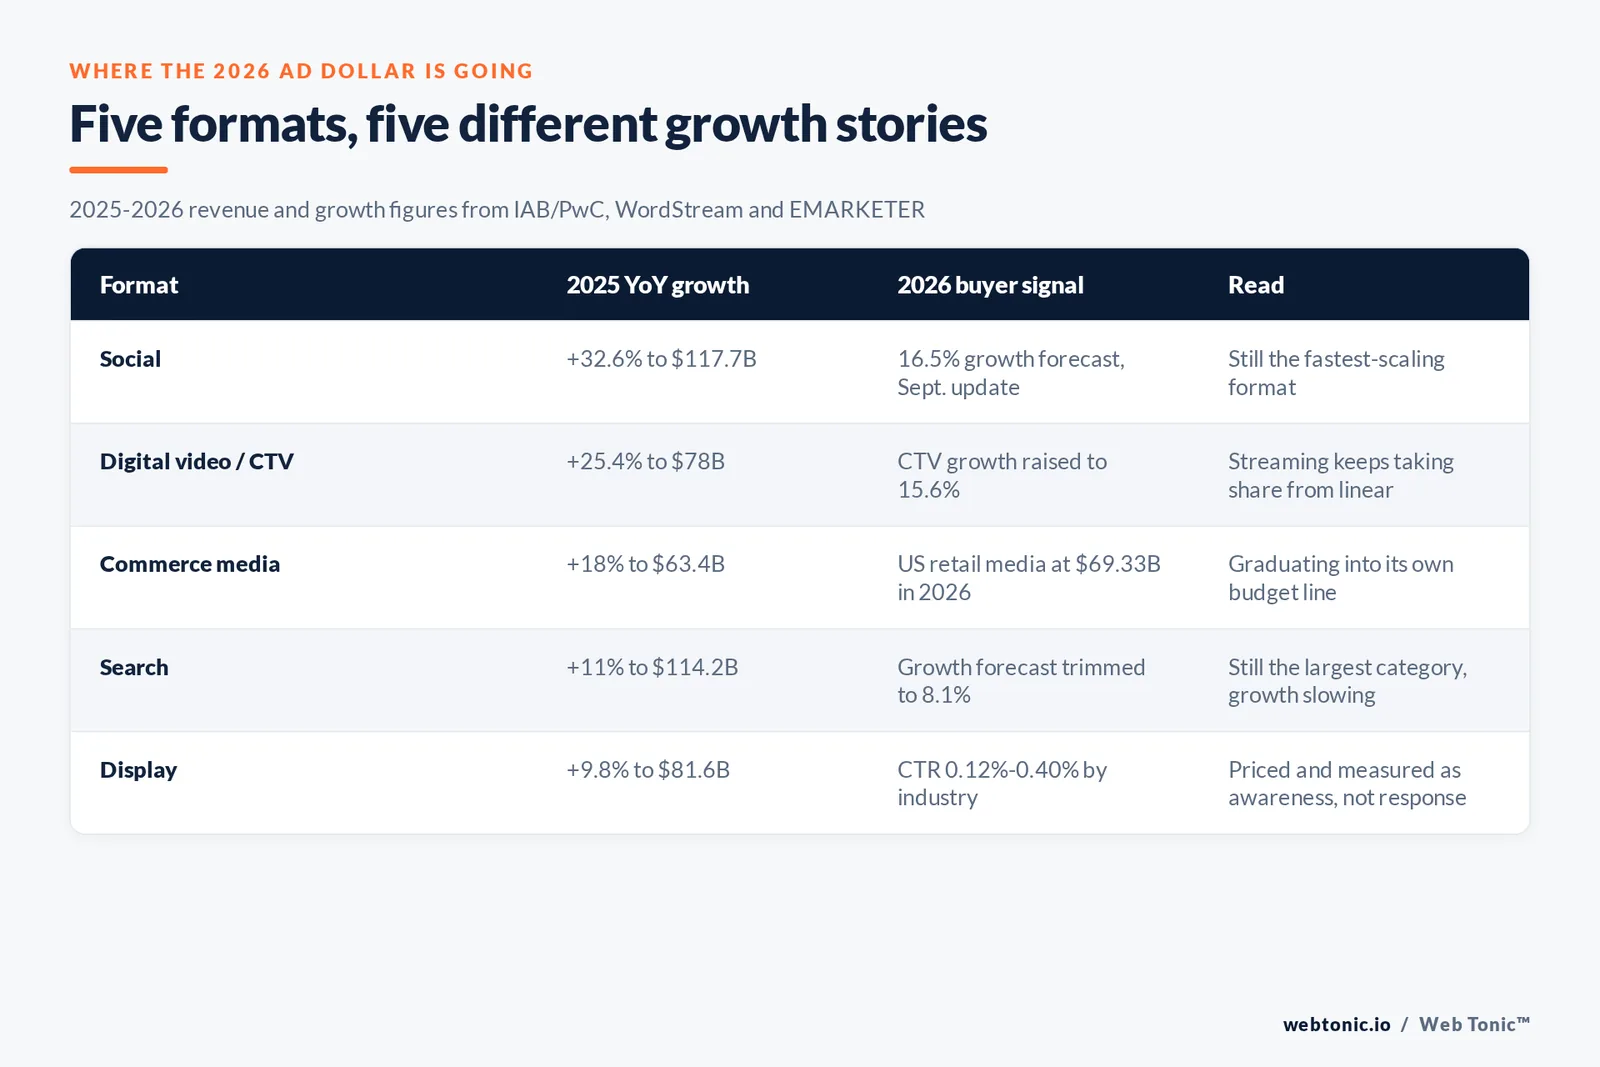
Underneath the category numbers, two structural shifts explain most of the reallocation. First, programmatic buying rose 20.5% to $162.4 billion in 2025, per IAB/PwC, gaining $27.6 billion in new spend as automated buying scales across nearly every format - it is now the plumbing behind social, display and a growing share of video, not a separate line item. Second, creator advertising has crossed from campaign-based influencer spend into a durable channel: spend reached $37 billion in 2025 and is projected to reach $44 billion in 2026, growing faster than the broader ad market as brands build dedicated always-on creator teams instead of one-off campaigns.
Both shifts point the same direction for budget owners: the format categories in the table above are increasingly a surface-level view of spend that is actually being bought and optimized programmatically, with creators as a growing share of the creative supply feeding it. Sensor Tower's platform-level data backs this up from a different angle: Gaming advertisers increased their unique ad creative volume 54% year over year between August 2025 and July 2026, the fastest of any major vertical, followed by Food & Dining Services (+26%), Financial Services (+21%) and Media & Entertainment (+19%) - all consistent with shorter, AI-assisted production cycles feeding programmatic buying at a faster testing pace than a traditional creative pipeline could support.
| Structural shift | 2025 figure | 2026 trajectory |
|---|---|---|
| Programmatic ad spend | $162.4B (+20.5% YoY) | Continues gaining share of every format |
| Creator advertising spend | $37B | Projected to reach $44B in 2026 |
| Top 10 global media companies' revenue share | Majority of total | Consolidation continuing |
The measurement problem AI created for buyers
The IAB's September survey surfaces a challenge that cuts across every format above: 86% of buyers are already changing, or expect to change, how they measure media performance because of conversational AI tools and AI agents in the next 12 months. The most common response, from 48% of buyers, is measuring brand visibility and citations directly inside AI tools; 45% cite comparing AI-driven and traditional customer journeys as their top measurement challenge. Any 2026 budget conversation that treats measurement as solved is behind where the buying market already is.
| AI-driven measurement shift | Share of buyers | Source |
|---|---|---|
| Changing or expecting to change how they measure media | 86% | IAB, Sept. 2026 |
| Measuring brand visibility/citations inside AI tools | 48% | IAB, Sept. 2026 |
| Citing AI-vs-traditional journey comparison as top challenge | 45% | IAB, Sept. 2026 |
| Adapting to AI-driven search cited as top investment challenge | 44% | IAB, Sept. 2026 |
Streaming keeps taking share from linear TV
Within video specifically, the reallocation Sensor Tower's State of Digital Advertising 2026 documents is stark. In the first seven months of 2026, US OTT (streaming) ad spend reached $12 billion, up 17% year over year, outperforming YouTube's 6% growth while traditional Linear TV spend contracted 3%. The impression-share shift is even sharper at the category level: Telecom lost 16 percentage points of Linear TV impression share between Q1 2024 and Q2 2026, more than doubling its OTT impression share to 26% over the same window. Travel & Tourism, Financial Services and Food & Dining all posted 8-to-12-point Linear-to-OTT swings in the same direction.
Read alongside the IAB's CTV growth forecast (15.6% for the rest of 2026, up from 13.8% in January), the pattern is consistent across two independent data sources: streaming is not a future consideration in a video budget, it is where the video budget increase is already landing.
| Video format | 2026 spend/growth signal | Source |
|---|---|---|
| OTT (streaming) | $12B in 7 months, +17% YoY | Sensor Tower |
| YouTube | +6% YoY over the same period | Sensor Tower |
| Linear TV | -3% YoY over the same period | Sensor Tower |
| CTV (IAB category) | 15.6% growth forecast, up from 13.8% | IAB Sept. 2026 Outlook |
Vertical-level data explains why the swing is uneven: Telecom, Travel & Tourism, Financial Services and Food & Dining have shed the most Linear TV impression share since Q1 2024 precisely because their audiences over-index on streaming-first viewing habits, while categories with an older core audience are moving more slowly. Retail media rides the same wave from another angle - EMARKETER forecasts US retail media spend growing from $58.79 billion in 2025 to $69.33 billion in 2026, with Amazon's own retail media business alone projected to exceed $75 billion by 2028. A format budget built on the category-wide average will systematically misjudge both ends of that range.
The practical implication for a 2026 media plan: pull your own audience's linear-versus-streaming viewing split before setting a video budget split, rather than applying the IAB's blended CTV growth number uniformly across every vertical the brand touches. A telecom or travel brand chasing an average-case video split is very likely under-investing in streaming relative to where its own audience has already moved.
Where buyers say they are leaning next
Fragmented discovery is reshaping format priorities. The IAB's September survey found customer acquisition jumped nine points to 63% as the top media investment goal, while the formats getting the most increased focus are creator and influencer advertising (54%), demo-targeted and cohort-based advertising (53%), publishers with first-party data (48%) and contextual advertising (45%). Commerce and retail media are graduating from a shopping add-on to a budget line of their own: EMARKETER's H1 2026 forecast puts US retail media spend at $69.33 billion this year, up from $58.79 billion in 2025.
For teams rebalancing a mix across these formats, our performance creative team builds format-specific creative rather than resizing one asset across channels, and our guide on what Google Ads actually costs in 2026 is a useful companion for benchmarking the search share of this budget against the numbers above. Our growth marketing team can help translate any of the channel-growth signals in this article into an actual quarter-by-quarter media plan rather than a static allocation.
Frequently Asked Questions
How big is the US digital advertising market in 2026?
The IAB/PwC Internet Advertising Revenue Report for full-year 2025 put US digital ad revenue at $294.6 billion, up 13.9% year over year, and the IAB's September 2026 Outlook Study update raised its full-year 2026 growth forecast to +12.3%, up from a January projection of 9.5%. PwC separately projects global advertising revenue crossing the $1 trillion mark in 2026.
Which ad format is growing fastest right now?
Social media led 2025 category growth at 32.6% year over year to $117.7 billion, followed by digital video at 25.4% growth to $78 billion. Looking ahead, the IAB's September 2026 update has social (16.5% projected growth) and CTV (15.6%) as the fastest-growing individual channels for the rest of the year, both gaining ground since the January forecast.
Is display advertising still worth the budget?
Display revenue grew a more modest 9.8% to $81.6 billion in 2025 per IAB/PwC, and WordStream's analysis of 60,000-plus campaigns puts average display click-through rates between 0.12% (Restaurants & Food) and 0.40% (Education & Instruction). Display still works as an impression-heavy awareness layer; it is not priced or measured like a direct-response format, and budgets should reflect that.
What are advertisers increasing focus on for the rest of 2026?
The IAB's September 2026 buyer survey found creator and influencer advertising leading increased focus at 54%, followed by demo-targeted and cohort-based advertising at 53%, publishers with first-party data at 48%, and contextual advertising at 45% - all responses to audience fragmentation across AI-driven discovery surfaces.
How much is retail and commerce media taking from other formats?
Commerce media grew 18% to $63.4 billion in 2025 per IAB/PwC, and EMARKETER's H1 2026 forecast has US retail media spend reaching $69.33 billion in 2026, up from $58.79 billion in 2025. It is now a large enough line item that budget conversations increasingly treat it as a fourth pillar alongside search, social and display rather than a shopping-specific add-on.
Sources
IAB - Digital Ad Revenue Climbs to Nearly $300B (2025 Report)
IAB - 2026 Outlook Study: September Update
IAB - 2026 Outlook Study: September Update (insights page)
WordStream - Display & Video Ads Benchmarks 2026
EMARKETER - US Ad Spending 2026
EMARKETER - Retail Media Ad Spending Forecast H1 2026
PwC - Global Entertainment & Media Outlook
Sensor Tower - State of Digital Advertising 2026


