Table of contents

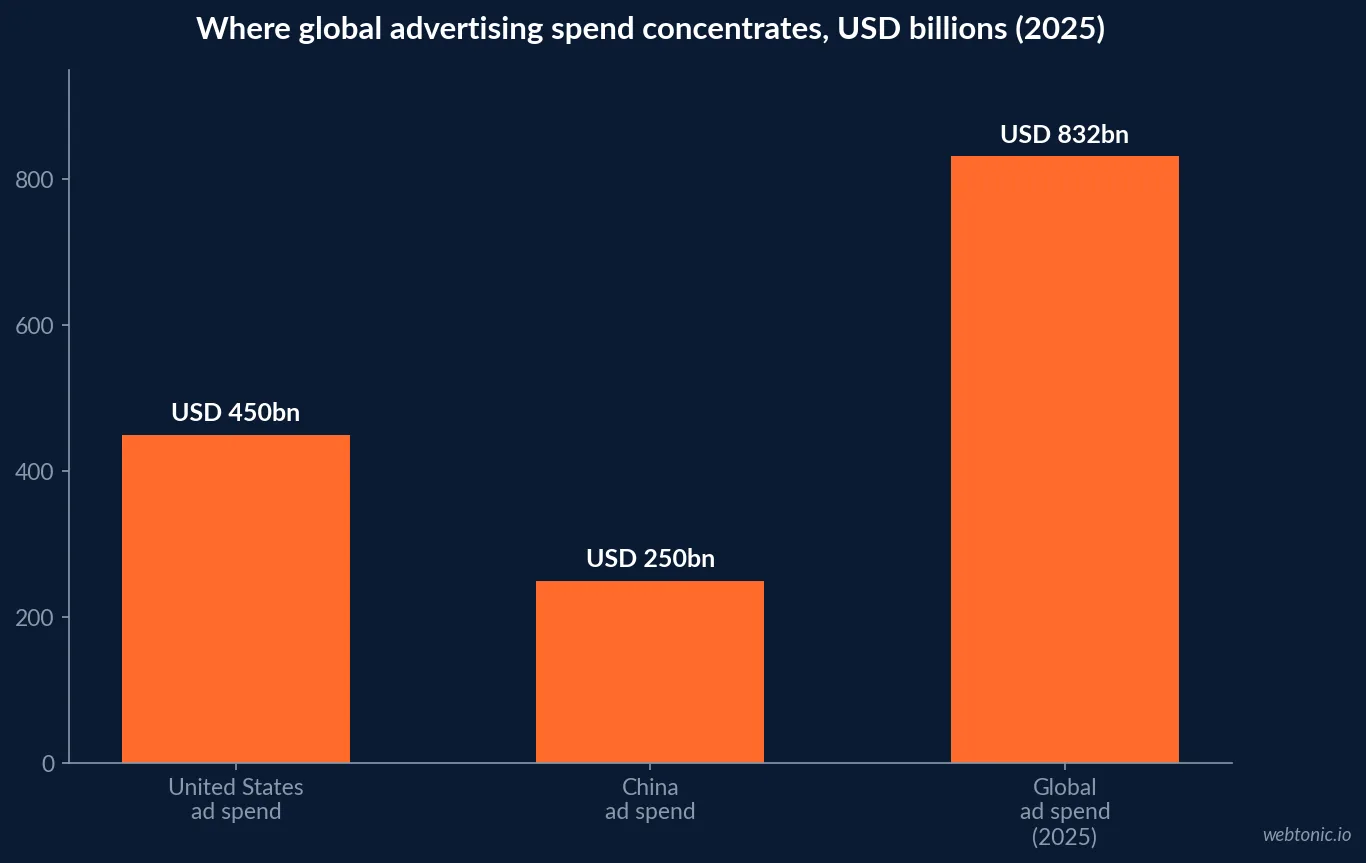
Global advertising spend reached almost USD 832 billion in 2025, up 5% year over year, with the United States alone accounting for more than USD 450 billion of that total. Digital channels now take roughly three in every four US ad dollars, and mobile has overtaken desktop as the default screen advertisers plan around.
Key Takeaways
- Global ad spend hit almost USD 832 billion in 2025, up 5% year over year.
- The US ad market exceeds USD 450 billion in annual spending.
- China's ad market runs around USD 250 billion a year.
- US digital ad spend reached USD 317 billion in 2024.
- About 7.5 of every 10 US ad dollars now goes to digital.
- US digital ad spend is projected to reach USD 490 billion by 2029.
- Search ads drive roughly half of all US digital ad revenue.
- Google holds about 25% of US digital ad revenue among publishers.
- Mobile advertising is 65% of total US digital ad spend.
- US mobile search ad spend runs near USD 82 billion.
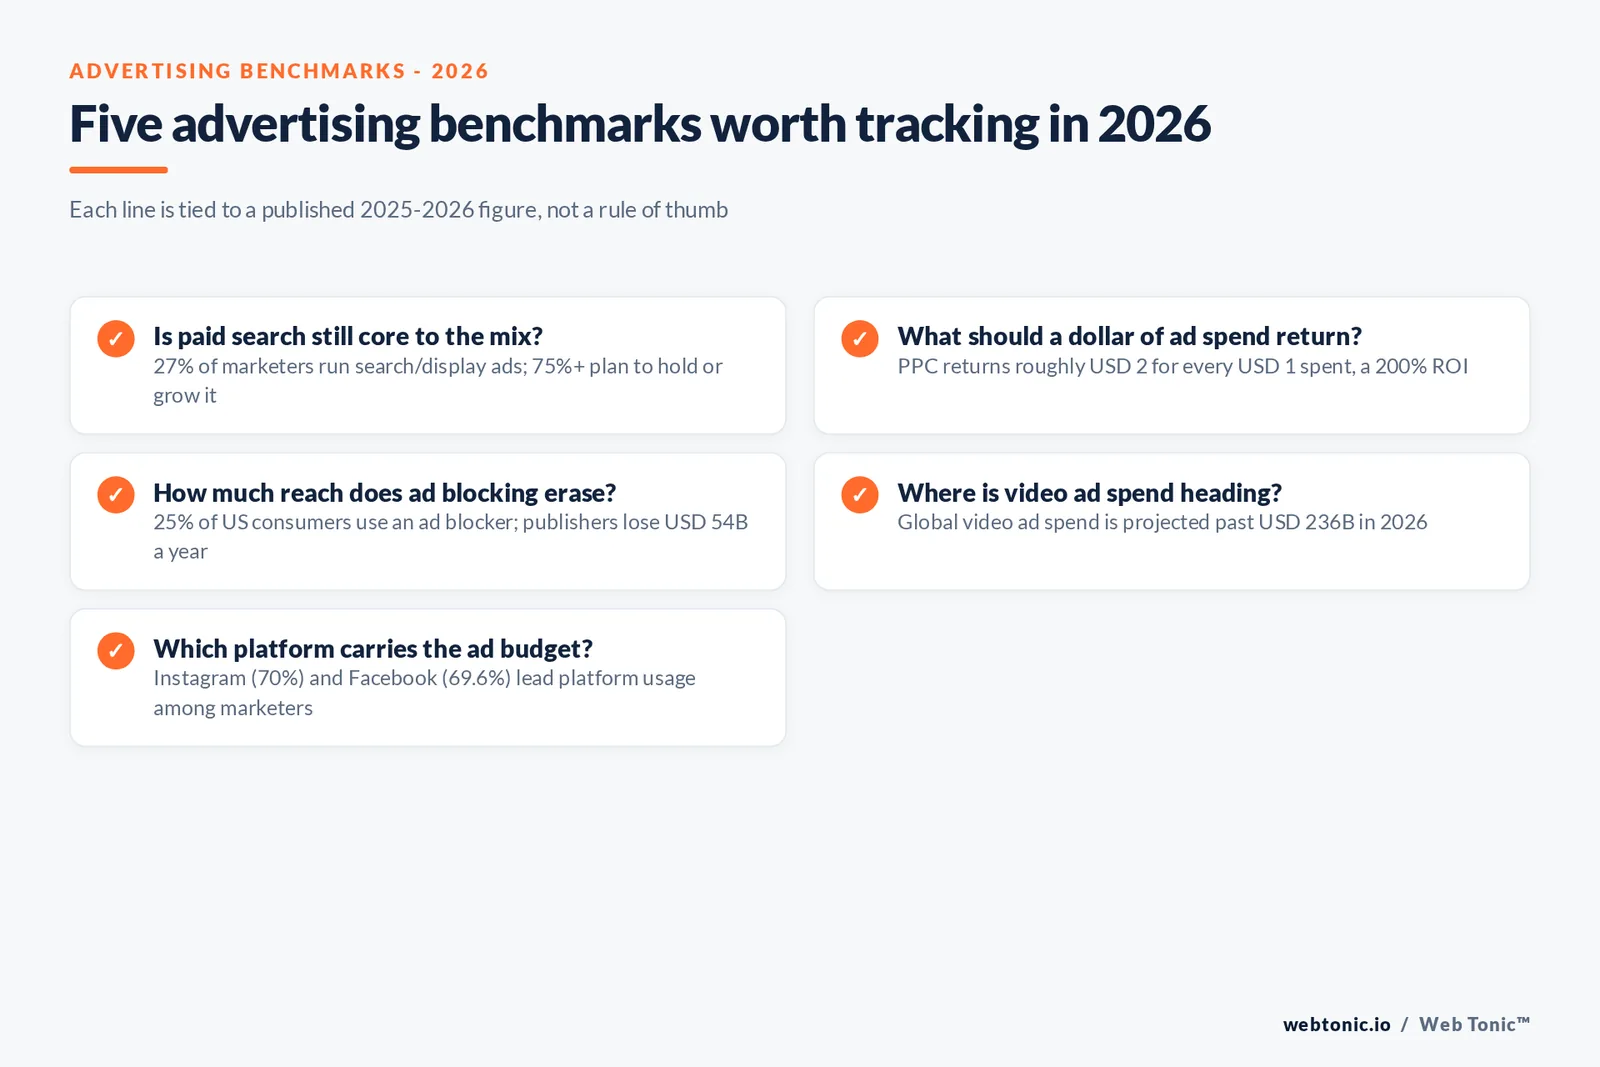
- 25% of US consumers use ad blockers.
- Ad blocking cost publishers an estimated USD 54 billion in 2024.
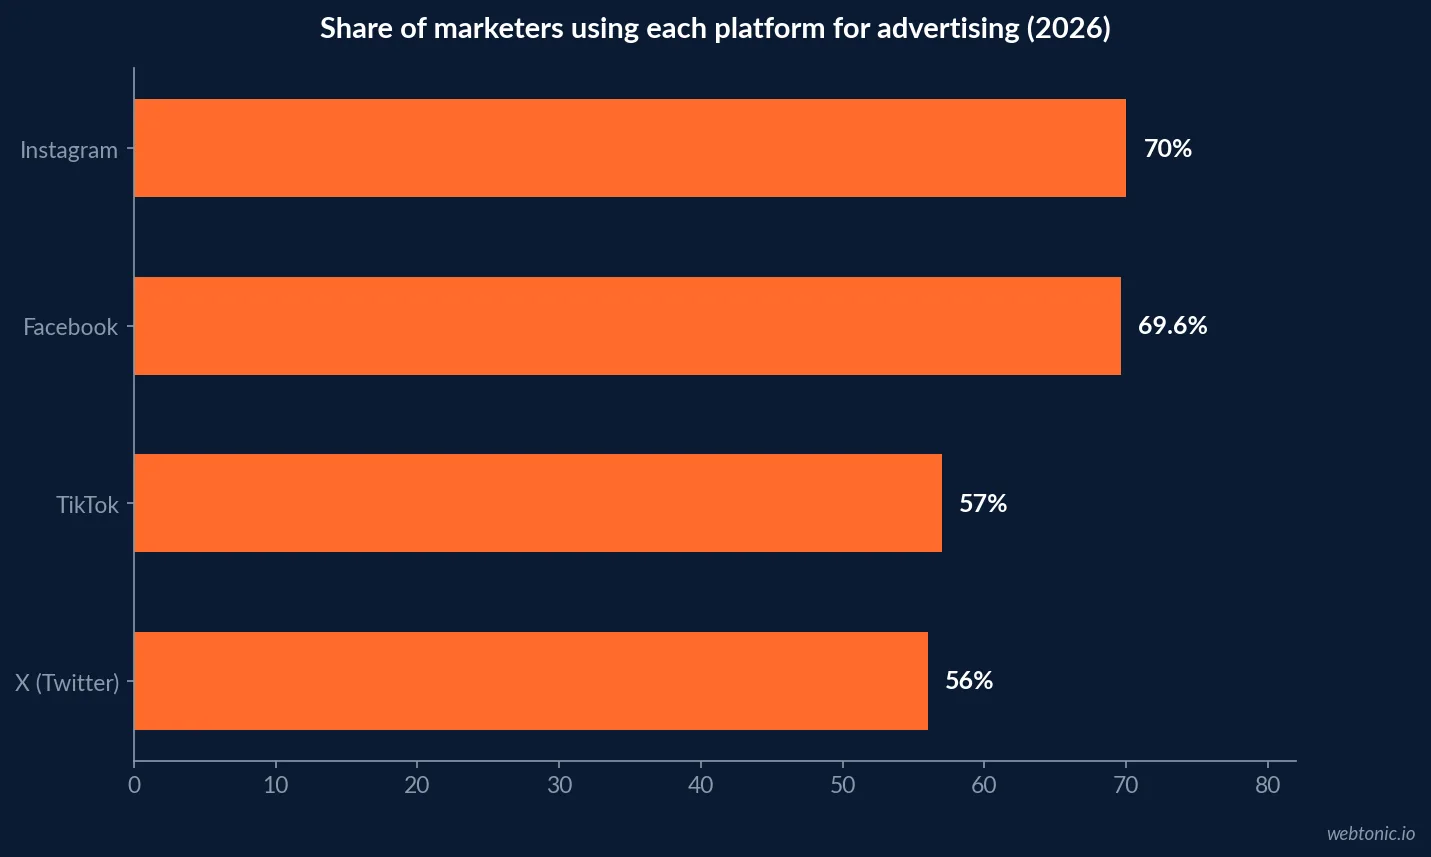
- Instagram is used by 70% of marketers for advertising.
- Facebook follows closely at 69.6% marketer usage.
- PPC advertising returns about USD 2 for every USD 1 spent, a 200% ROI.
- Video ad spend is projected past USD 236 billion in 2026.
- Banner ad spending in the US is set to pass USD 74 million in 2026.
| Advertising benchmark (2025-2026) | Published figure | Source |
|---|---|---|
| Global ad spend, 2025 | ~USD 832 billion (+5% YoY) | Statista |
| US ad market size, 2025 | > USD 450 billion | Statista |
| US digital ad spend, 2024 | USD 317 billion (7.5/10 dollars) | Statista |
| US mobile share of digital spend | 65% | Statista |
| US consumers using ad blockers | 25% | HubSpot / Statista |
| PPC advertising ROI | ~200% (USD 2 per USD 1) | Wordstream via HubSpot |
How big is the global advertising market
Statista's global advertising overview puts worldwide ad spend at almost USD 832 billion in 2025, a 5% increase over the prior year's growth rate of 8%. The Americas and APAC are the two fastest-growing regions, with APAC projected to be the only region matching the global average growth rate in 2026.
The United States remains the largest single market, with spending exceeding USD 450 billion in 2025. China leads Asia with a total advertising market of around USD 250 billion, and both Canada and Brazil rank among the top ten global ad markets by spend.
Digital's share of the US advertising budget
Inside the US market, digital has become the default. Statista's US-focused data shows the country's digital advertising revenue at USD 317 billion in 2024, with about 7.5 out of every 10 dollars spent on advertising now going to digital channels. Sources expect that figure to grow toward USD 490 billion by 2029.
Retail leads industry investment in digital advertising at 15% of digital ad spend, followed by entertainment at 12% and financial services at 11%. Search advertising alone drives roughly half of all US digital ad revenue, and Google holds about 25% of net digital ad revenue among US publishers, ahead of Facebook and Amazon.
| US digital advertising signal (2024) | Published figure | Source |
|---|---|---|
| US digital ad revenue | USD 317 billion | Statista |
| Share of ad dollars going digital | ~75% | Statista |
| Projected 2029 digital ad revenue | USD 490 billion | Statista |
| Retail's share of digital ad spend | 15% | Statista |
| Search's share of digital ad revenue | ~50% | Statista |
| Google's share of digital ad revenue | ~25% | Statista |
Mobile has overtaken desktop as the default screen
Statista's data shows mobile advertising accounted for 65% of total digital ad spend in the US in 2024, split mainly between mobile search (about USD 82 billion) and mobile video (about USD 59 billion). Globally, Semrush's advertising statistics roundup adds that 95% of internet users browse on mobile at least some of the time, and mobile now accounts for 73.5% of total internet ad revenue according to IAB data cited there.
One reason advertisers keep shifting budget to mobile: ad blockers have a much lower penetration rate on phones and tablets than on desktop browsers, which is also where the next section picks up.
Ad blocking is still an expensive leak
HubSpot's marketing statistics roundup, citing Statista, finds 25% of US consumers use ad blockers while browsing, and 41% say they are annoyed by advertising on the internet generally. Eyeo's 2024 estimate put the resulting cost to publishers at USD 54 billion in lost revenue for that year.
Consumer attitudes toward ads are more nuanced than "annoyed," though. Statista's US digital advertising data separately finds seven out of ten Americans are comfortable sharing data to support a free internet, and consumers report feeling most receptive to ads on shopping, news and social media sites specifically.
| Ad blocking and attitude signal | Published figure | Source |
|---|---|---|
| US consumers using ad blockers | 25% | Statista via HubSpot |
| Consumers annoyed by internet ads | 41% | Statista via HubSpot |
| Publisher revenue lost to ad blocking, 2024 | USD 54 billion | Eyeo |
| Consumers okay sharing data for a free internet | ~70% | Statista |
| Podcast listeners tolerant of a few extra ads | ~60% | Statista |
Where ad dollars go by format
Display, video and PPC each carry a different published return. HubSpot's 2026 data shows 27% of marketers currently use search/display ads, and over 75% plan to increase or maintain that investment in 2026. PPC advertising, when optimized, yields average returns of USD 2 for every USD 1 spent - a 200% ROI - according to Wordstream data cited there. Video ad spending is projected to pass USD 236 billion in 2026 and reach more than USD 268 billion by 2029, with TikTok alone projected to generate close to USD 44 billion in ad revenue in 2026.
| Ad format | 2026 published spend or ROI signal | Source |
|---|---|---|
| Search/display ads | 27% of marketers use it; 75%+ plan to hold or grow | HubSpot |
| PPC advertising | ~200% ROI (USD 2 per USD 1 spent) | Wordstream via HubSpot |
| Video advertising | USD 236B in 2026, USD 268B by 2029 | Statista via HubSpot |
| TikTok advertising | ~USD 44 billion ad revenue in 2026 | Statista via HubSpot |
| US banner advertising | > USD 74 million in 2026 | Statista via HubSpot |
Which platforms actually carry the ad budget
HubSpot's platform usage data for 2026 ranks Instagram first among marketers at 70%, just ahead of Facebook at 69.6%. TikTok has climbed to 57% of marketers and X sits at 56%. On return, Facebook is cited by 43% of marketers as one of the highest ROI-driving platforms, while Instagram is the most-cited platform for ROI overall.
An older but still-referenced 99firms advertising statistics roundup shows how quickly this mix moves: total display advertising spend was already projected at USD 263.8 billion by 2023, and social media advertising was tracking a 29.12% CAGR toward USD 221.01 billion the same year - both since overtaken by the larger 2025-2026 figures above.
How connected TV and retail media are reshaping the mix
Two formats are pulling budget away from the traditional display/search split above. Statista's global advertising overview notes that in a survey published at the end of 2025, four in five global brands reported plans to invest more in advanced or connected TV (CTV) during 2026, with online retail media networks (RMNs) a close second for planned budget increases. China's retail media segment is growing fast enough that its share of retail media within digital ad spend now exceeds Canada, Germany and the US by more than 30%, according to the same data.
Regionally, the UK ranks as Europe's most effective ad market as of 2025 on a creativity-based index tied to award-show performance, while Germany still routes over 60% of its ad spend through TV and daily newspapers, with online channels at only about 13% - a reminder that the mobile-first shift documented above is far from universal across markets.
| Emerging format or market signal | Published figure | Source |
|---|---|---|
| Global brands planning more CTV investment in 2026 | ~80% (4 in 5) | Statista |
| China's retail media share vs. Canada/Germany/US | > 30% higher | Statista |
| UK ad market creativity ranking, 2025 | #1 in Europe | Statista |
| Germany's ad spend on TV and newspapers | > 60% | Statista |
| Germany's ad spend on online channels | ~13% | Statista |
How to read these numbers for your own plan
None of these figures tell you what your account should spend - they tell you what the market around your account is doing. If your channel mix looks nothing like the platform usage numbers above, that is not automatically wrong, but it is worth a deliberate reason rather than inertia. Our growth marketing team benchmarks a client's channel mix against exactly this kind of published data before recommending a shift, and our breakdown of whether Facebook ads are still worth it in 2026 goes deeper on the platform-level ROI question above. Our Meta ads practice applies the same platform-usage data when building a channel plan.
What to watch through the rest of 2026
Three things worth tracking: whether mobile's 65% share of US digital spend keeps rising as video formats mature, whether ad-blocker adoption grows past 25% as consumer annoyance persists at 41%, and whether TikTok's climb to 57% marketer usage translates into ad revenue growth that matches its projected USD 44 billion for 2026. Each of those is a leading indicator for where next year's budget conversations will start.
The bottom line for 2026 planning
Three numbers anchor most of the planning conversations we see: an USD 832 billion global market still growing at 5% a year, a US digital market moving toward 75% of total spend, and a mobile channel that already carries 65% of that digital budget. Any channel plan built without checking itself against those three should have a specific reason for diverging, not just inertia from last year's plan.
Frequently Asked Questions
How much is spent on advertising worldwide?
Statista's 2025 advertising market data puts global ad spending at almost USD 832 billion in 2025, a 5% increase over the prior year. The United States alone accounts for more than USD 450 billion of that, and China's market runs around USD 250 billion, making North America and Asia the two centers of gravity for the industry.
What share of ad spending is now digital?
In the United States, about 7.5 out of every 10 advertising dollars now goes to digital channels, on a market Statista sizes at USD 317 billion for 2024 and projects toward USD 490 billion by 2029. Search advertising alone accounts for roughly half of all US digital ad revenue, with Google holding about 25% of net digital ad revenue among US publishers.
How much advertising is lost to ad blockers?
HubSpot's 2025 data, citing Statista, finds 25% of US consumers use ad blockers when browsing, and 41% say they are annoyed by internet advertising generally. Eyeo's 2024 estimate put the resulting cost to publishers at USD 54 billion in lost revenue for that year alone, which is why so much budget has shifted toward formats blockers can't reach, like in-app and connected TV inventory.
Which platforms do marketers actually use for advertising?
HubSpot's 2026 State of Marketing data shows Instagram as the most-used platform among marketers at 70%, just ahead of Facebook at 69.6%. TikTok has climbed to 57% and X sits at 56%. Facebook and Instagram together still carry the largest published ROI share, with 43% and a leading ROI ranking respectively.
Is mobile or desktop the bigger advertising channel now?
Mobile, decisively. Statista's US data shows mobile advertising accounted for 65% of total digital ad spend in 2024, split mainly between mobile search (about USD 82 billion) and mobile video (about USD 59 billion). More than 60% of global web traffic is now mobile, which is the underlying reason the format keeps taking share from desktop.
Sources
Statista - Advertising Worldwide, Statistics and Facts
Statista - Digital Advertising in the United States
HubSpot - Marketing Statistics (State of Marketing Report 2026)
Semrush - Online Advertising Statistics
99firms - Advertising Statistics and Market Insights
WPBeginner - Marketing Statistics, Trends and Facts
Zippia - Advertising Statistics