Table of contents
The core difference between CTV and traditional TV for a plumbing company is the unit being bought: traditional TV sells a programme and a market, CTV sells a household. No study benchmarks either for plumbing, so this page uses named cross-industry datasets on reach, frequency, device mix and traffic quality.
Key Takeaways
- Average CTV frequency was 7.42 across Innovid's 2023 campaigns.
- Campaigns on five or fewer publishers reached 87% unique reach.
- In 2021, US CTV campaigns reached only 9.23% of 95 million-plus CTV households on average.
- 53% of Innovid's 2023 video impressions ran on CTV.
- 21% of global open programmatic CTV traffic was invalid in Q4 2025 (Pixalate).
- Roku carried 32% of North American programmatic CTV share of voice in Q4 2025.
- Streaming held 44.4% of ad-supported TV among adults 18+ in Q2 2026 (Nielsen).
- Household leaks waste nearly 1 trillion gallons a year (EPA).
CTV and traditional TV compared at a glance
The table compares the two on what a plumbing advertiser actually buys. Figures are cross-industry and carry their issuer and period; where a traditional TV figure is not published in these sources, the row says so rather than inventing one.
| Dimension | Traditional (linear) TV | Connected TV | Evidence |
|---|---|---|---|
| Unit bought | Programme, daypart, market | Household impression | Platform buying models |
| Adult ad-supported viewing, Q2 2026 | Broadcast 28.6%, cable 27.0% | Streaming 44.4% | Nielsen |
| Completion rate | Not measured the same way | 95% interactive CTV (2021) | Innovid |
| Average frequency | Not in these sources | 7.42 (2023 campaigns) | Innovid |
| Invalid traffic | Not applicable to broadcast | 21% global open programmatic, Q4 2025 | Pixalate |
Household reach: small campaigns reach few homes
Innovid's CTV Takes Center Stage benchmarks, covering 286 billion video impressions served in 2021, found US CTV campaigns reached on average only 9.23% of the more than 95 million CTV households on its platform, with an average of 4.08 exposures. 58% of campaigns ran 19 million impressions or fewer and reached about 3% of households.
For a plumber that is the point, not a flaw: a service area is a small share of national households, and the aim is to reach the right few thousand homes rather than a national percentage.
Frequency: how often the same home sees the spot
Innovid's CTV Advertising Insights Report 2024, based on almost 380 billion video impressions served in 2023, found 53% of them ran on CTV, up 12%, with an average frequency of 7.42 across CTV campaigns and 87% unique reach for campaigns using five or fewer publishers.
The rise from 4.08 in the 2021 data to 7.42 in 2023 comes from two different reports, so read it as direction, not a precise trend. The practical lesson for a plumbing flight is to set a frequency cap per household and keep the publisher list short.
| Innovid dataset | Impressions analysed | Frequency | Reach finding |
|---|---|---|---|
| 2021 global benchmarks | 286 billion | 4.08 average exposures | 9.23% of 95M+ CTV households |
| 2021, smaller campaigns | 19M impressions or fewer (58% of campaigns) | Not stated | About 3% of households |
| 2023 insights report | Almost 380 billion | 7.42 average | 87% unique reach with 5 or fewer publishers |
| 2023 CTV share of impressions | 53% of total | Not applicable | Up 12% on the prior year |
Completion rate: why it flatters CTV
The same 2021 Innovid report found interactive CTV completion rates rising from 85% to 95%, against 62% for PC and mobile combined, and explains the gap: on CTV a viewer must typically watch the ad for the programme to continue. Traditional TV is not measured by completion at all; it is measured by ratings.
So a near-perfect CTV completion rate should not be compared with a linear ratings point, and it should not be presented as evidence that households wanted a plumber. It shows the ad played.
Device mix: whose ecosystem you are buying
Household targeting runs through a handful of device platforms. Pixalate's Q4 2025 CTV Ad Supply Chain Trends report, based on more than 7 billion open programmatic transactions, put Roku first in North America at 32% share of voice. Globally it recorded USD 6.9 billion of open programmatic CTV spend in the quarter, down 9% year on year.
Share of voice here means the share of open programmatic ads delivered to each device, a proxy for usage, not TV sets sold. A plumbing campaign bought programmatically will lean heavily on whichever device leads its market.
Invalid traffic by device
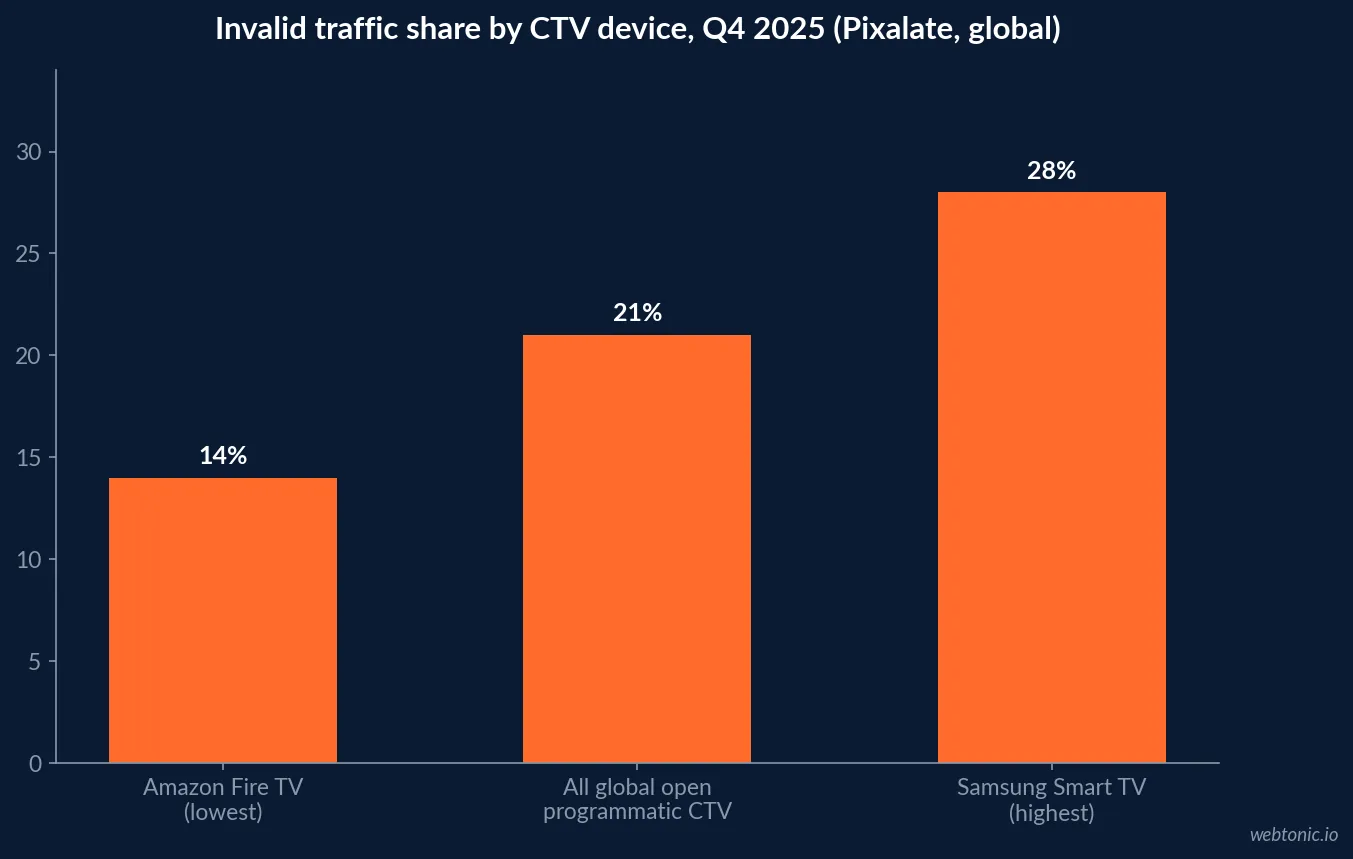
The same Pixalate report measured 21% invalid traffic across global open programmatic CTV in Q4 2025. Amazon Fire TV had the lowest rate at 14% and Samsung Smart TV the highest at 28%, and 73% of LG Smart TV ad traffic did not use official app store IDs. For the US specifically, Pixalate's Q3 2025 benchmarks put the rate at 18%.
| Pixalate measure | Figure | Scope |
|---|---|---|
| Invalid traffic, all open programmatic CTV | 21% | Global, Q4 2025 |
| Lowest-IVT device: Amazon Fire TV | 14% | Global, Q4 2025 |
| Highest-IVT device: Samsung Smart TV | 28% | Global, Q4 2025 |
| LG traffic without official app store IDs | 73% | Global, Q4 2025 |
| Invalid traffic, US open programmatic CTV | 18% | United States, Q3 2025 |
| Roku share of voice | 32% | North America, Q4 2025 |
Which adults each side reaches
Nielsen's Q2 2026 Ad Supported Gauge shows how audience choice changes the split. Across all persons, streaming took 48.2% of ad-supported TV; among adults 18 and older it fell to 44.4%, with broadcast at 28.6% and cable at 27.0%. In total TV time, Nielsen's July 2026 Gauge put streaming at 49.0%.
Homeowners who book plumbers are adults, so traditional TV still reaches a large share of them. CTV's advantage is choosing which homes, not reaching more adults.
Smaller advertisers are now in the CTV auction
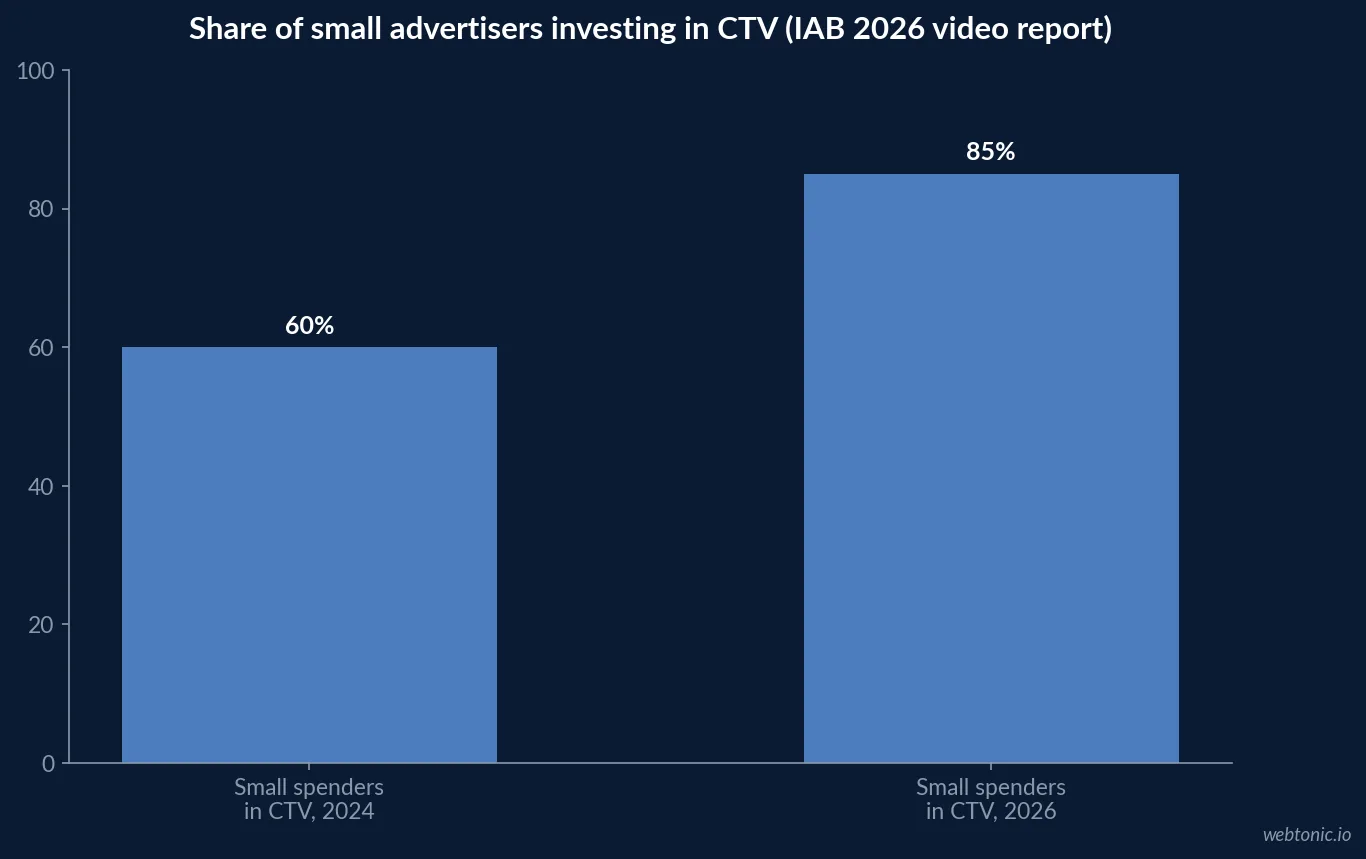
The 2026 IAB Digital Video Ad Spend and Strategy report found the share of small spenders investing in CTV rose from 60% in 2024 to 85% in 2026, with self-serve platforms lowering the entry barrier. The IAB's May 2026 release adds that targeting overtook content quality as the top criterion for TV and video buys, up 10 points, with small and mid-size spenders driving it by 23 points.
For a local plumbing company this cuts both ways. Entry is easier than it has ever been, and the targeting tools that attracted those smaller buyers are exactly the household and ZIP-level controls a service business needs. But it also means more local advertisers bidding for the same households in the same areas, so a first test should record its delivered CPM and reach rather than assume the prices it saw a year earlier still hold.
Plumbing demand signals to time a flight
No national source publishes plumbing call volumes by month, so demand timing has to come from indirect signals. The EPA's WaterSense Fix a Leak Week runs each March, 16-22 March in 2026, and the EPA estimates household leaks waste nearly 1 trillion gallons of water a year nationwide, adding that fixing easily corrected leaks can save about 10% on water bills. That gives a plumber a recurring, public hook for a spring flight.
Emergency demand, burst pipes in freezes and sewer backups after storms, is local and irregular. That favours self-serve CTV that can start within days over a schedule booked months ahead.
| Demand signal | Figure or date | How a plumber can use it |
|---|---|---|
| Household leak waste, nationwide | Nearly 1 trillion gallons a year (EPA) | Leak-detection message in spring |
| Water bill saving from fixing easy leaks | About 10% (EPA) | Homeowner-benefit line in the spot |
| Fix a Leak Week 2026 | 16-22 March (EPA) | Anchor date for a short flight |
| Freeze and storm emergencies | No national monthly series published | Self-serve flight triggered by local weather |
Entry points for a household-targeted test
Roku's cost guide says USD 500 to 1,000 is enough for most first-time advertisers and bills on a dynamic CPM. MNTN (vendor) advertises entry from USD 2,000, and Amazon Ads recommends USD 10K for self-service streaming TV and USD 50K for managed service. These are platform floors, not plumbing prices.
Questions to put to any CTV seller
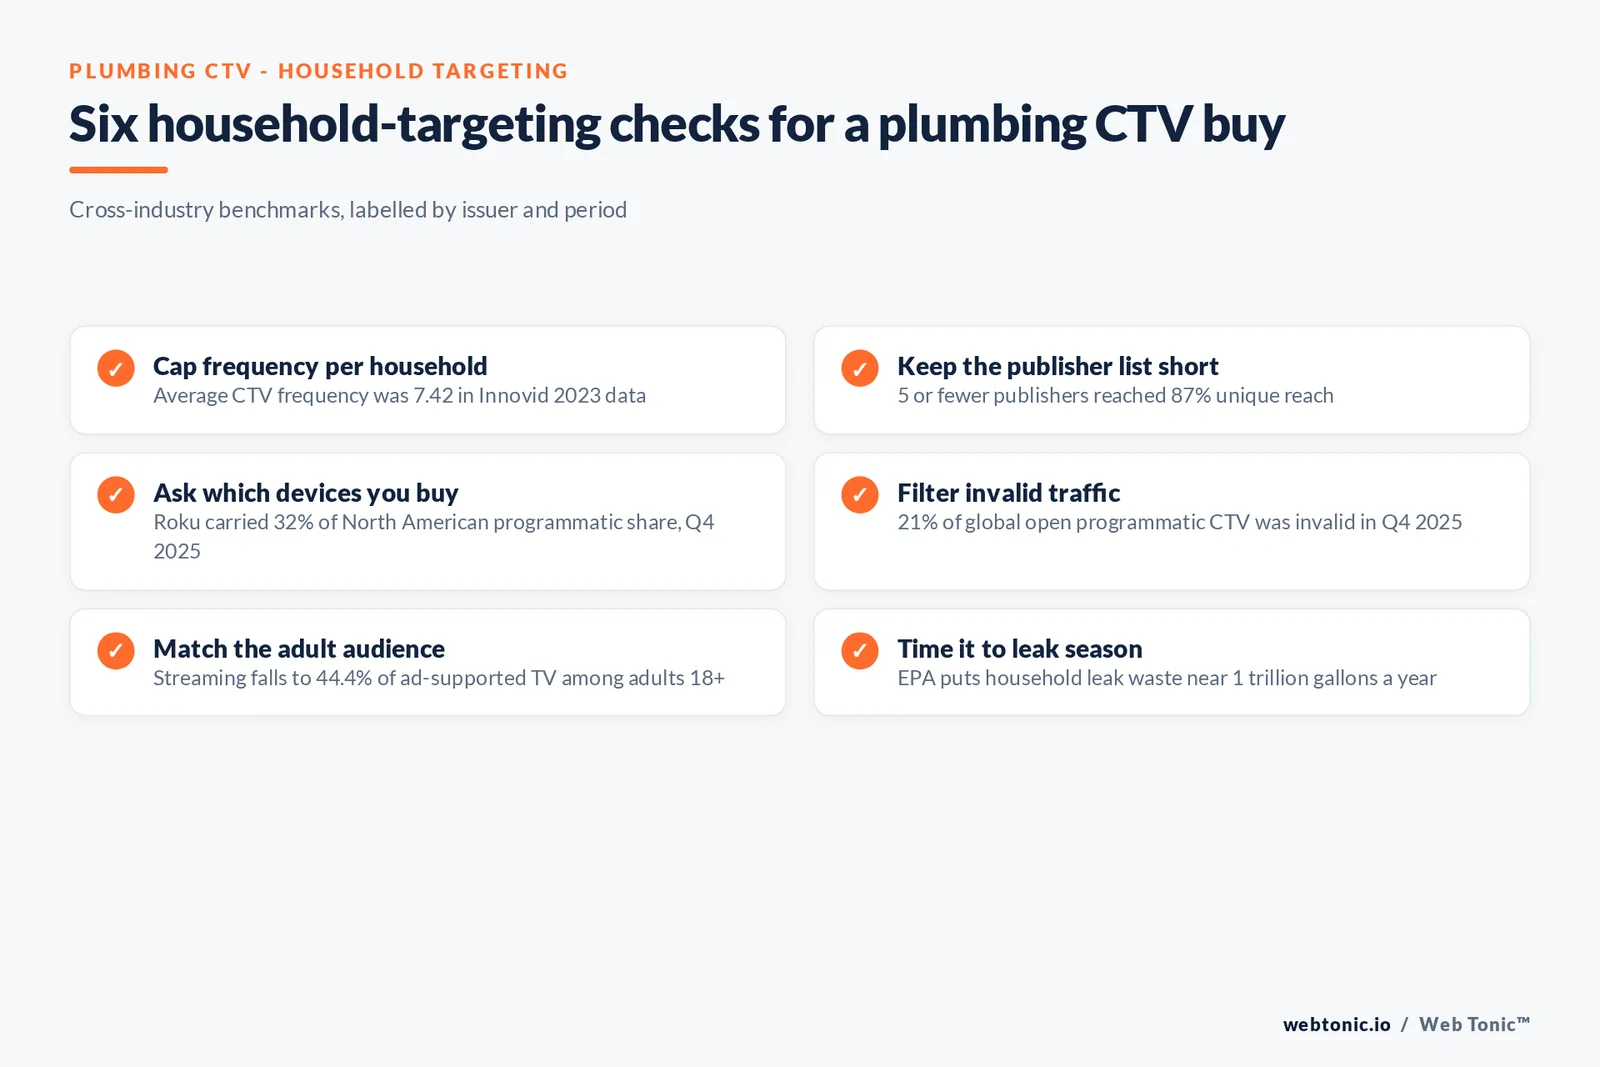
Because plumbing has no CTV benchmark of its own, the quality of a campaign depends on what the seller will disclose. The published datasets above suggest a short list of questions, each tied to a figure that shows why it matters. A seller who cannot answer them is asking you to buy on completion rate alone, which, as Innovid's own explanation makes clear, mostly confirms that an unskippable ad played to the end.
Traditional TV sellers answer a different set of questions, about ratings, dayparts and station coverage. The two are not interchangeable, and a plan that mixes them should report each on its own terms rather than blending ratings points with household impressions into a single number.
| Question for the seller | Why it matters | Published anchor |
|---|---|---|
| What is the frequency cap per household? | Small service areas repeat fast | 7.42 average CTV frequency (Innovid 2023) |
| How many publishers carry the flight? | Fewer publishers concentrate reach | 87% unique reach with 5 or fewer (Innovid) |
| Which devices deliver most impressions? | Fraud rates differ by device | 14% to 28% IVT by device (Pixalate Q4 2025) |
| Is invalid traffic filtered and reported? | Open supply carries fraud | 18% US open programmatic IVT (Pixalate Q3 2025) |
| How many target households were reached? | Completion hides reach | 9.23% average household reach (Innovid 2021) |
| Can results be split by ZIP code? | Needed for a holdout test | Platform reporting options |
How to judge a plumbing CTV test
Compare booked jobs, calls and branded searches from targeted households or ZIP codes against a matched holdout, over the same weeks. Ask the platform for household reach, frequency distribution and invalid-traffic filtering, not just completion. Our data intelligence team builds that holdout, and our performance creative team produces the spots. For more context see the connected TV advertising statistics hub, advertising statistics and our plumbing SMS marketing statistics.
Frequently Asked Questions
Can a plumber target specific households with CTV?
Yes, mechanically. CTV is served to internet-connected TVs, so platforms can limit delivery by ZIP code, household data segment or an uploaded list, depending on the platform. Traditional TV sells programmes and market areas instead. What no dataset publishes is how well household targeting performs for plumbing specifically.
How often will the same home see a CTV ad?
Innovid's ad-server data put average frequency at 7.42 across its CTV campaigns in 2023, up from an average of 4.08 exposures in its 2021 dataset. Both are cross-industry averages; a small service-area campaign tends to repeat faster, so frequency caps matter.
How much CTV traffic is invalid?
Pixalate measured 21% invalid traffic across global open programmatic CTV in Q4 2025, ranging from 14% on Amazon Fire TV to 28% on Samsung Smart TV. For the US alone in Q3 2025 the rate was 18%. These figures cover open programmatic supply, not every CTV buy.
Is CTV completion rate a good success metric for plumbers?
Not on its own. Innovid's 2021 benchmarks show interactive CTV completion at 95% against 62% for PC and mobile, and Innovid attributes the gap to viewers typically having to watch the ad for content to continue. High completion confirms delivery, not that the household needs a plumber.
When does household plumbing demand peak?
No national dataset publishes plumbing call seasonality, but the EPA runs Fix a Leak Week each March (16-22 March in 2026) and estimates household leaks waste nearly 1 trillion gallons of water a year nationwide.
Sources
Innovid - CTV Advertising Insights Report 2024
Innovid via IAB - CTV Takes Center Stage Global Benchmarks (2021 data)
Pixalate - Q4 2025 CTV Ad Supply Chain Trends report
Pixalate - Q3 2025 North America IVT benchmarks
Nielsen - Q2 2026 Ad Supported Gauge
Nielsen - The Gauge, July 2026
IAB - 2026 Digital Video Ad Spend and Strategy full report
IAB - US digital video ad spend to surpass USD 80B in 2026
US EPA WaterSense - Fix a Leak Week
Roku - How much does it cost to advertise on Roku
Amazon Ads - Streaming TV ads
MNTN - Go Big small-business program