Table of contents

YouTube reaches roughly 2.58 billion users a month, takes more than 20 million new video uploads a day, and has led U.S. streaming watch time for nearly three years. Here are the numbers that matter in 2026, each traced to a primary source.
Key Takeaways
- 2.58 billion people can be reached on YouTube each month — about 45% of the world's 5.66 billion social media users.
- 84% of U.S. adults use YouTube, more than any other platform Pew Research Center tracks, rising to 95% of 18–29s.
- Over 20 million videos are uploaded every day, and Shorts averages more than 200 billion daily views.
- The average YouTube session runs 14 minutes 29 seconds — roughly 50% longer than a typical TikTok session.
- India leads with about 518 million users, ahead of the U.S. at 259 million and Indonesia at 151 million.
- YouTube ad revenue reached $40.37 billion in 2025, up from $36.15 billion the year before.
YouTube audience size and scale
YouTube's headline reach figure comes from advertising-audience data rather than a company disclosure. The Digital 2026 Global Overview Report puts potential monthly ad reach at 2.58 billion users, which is why it is often quoted as the platform's monthly active audience. Against the same report's total of 5.66 billion social media users worldwide, YouTube reaches close to half of everyone who is on social at all.
| Metric | Latest figure | Source |
|---|---|---|
| Monthly reachable users | 2.58 billion | DataReportal, Digital 2026 |
| Share of all social users | ≈45% | Calculated from 5.66B total |
| Videos uploaded per day | 20 million+ | YouTube press page |
| Shorts views per day | 200 billion+ | YouTube press page |
| Localised versions | 100+ countries, 80 languages | YouTube press page |
| Monthly website visits | 28 billion+ (April 2026) | Similarweb, via Sprout Social |
| Ranking among social networks | 3rd by monthly active users | Statista |
| U.S. streaming watch time rank | #1 for nearly 3 years | Nielsen, as of January 2026 |
That last row is the one most marketers underweight. YouTube's own press page cites Nielsen data showing it has been the top platform for U.S. streaming watch time for close to three years — a position tracked monthly in Nielsen's The Gauge. In practice, YouTube is no longer a "social video" line item competing with Instagram; it is a television competitor that happens to be measured alongside social platforms. Ranking context across networks is maintained by Statista's global social network ranking.
YouTube demographics: who is actually watching
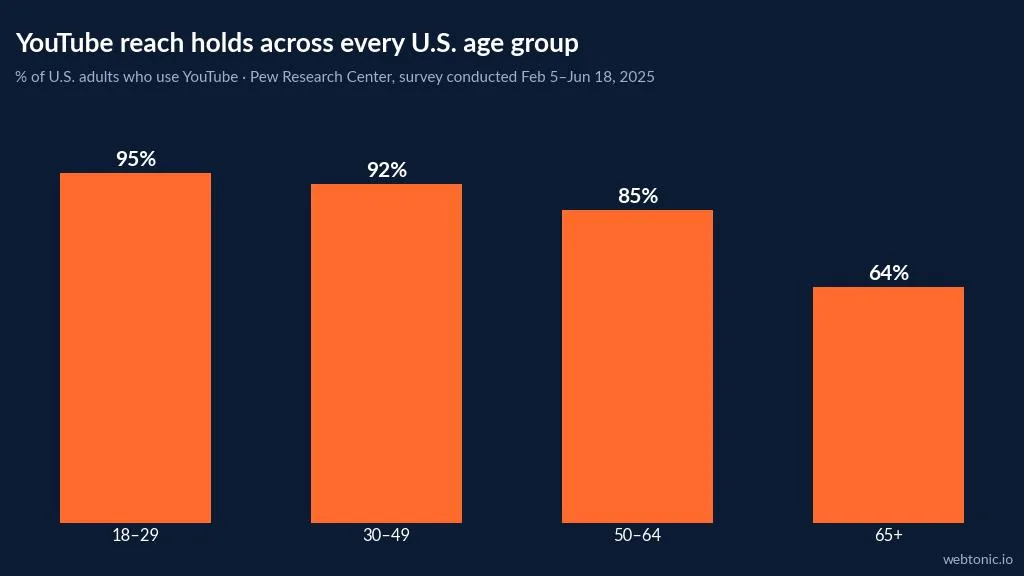
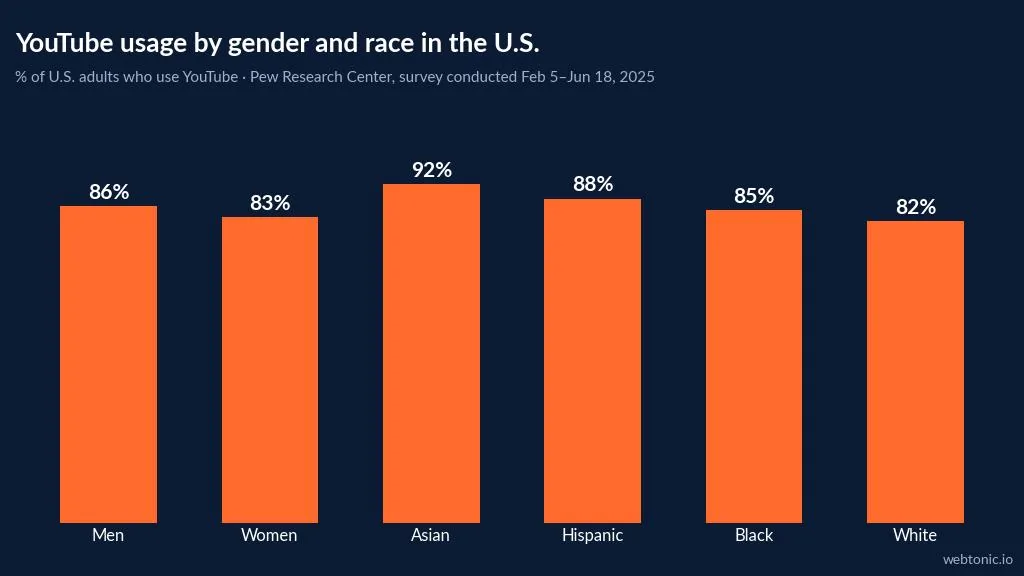
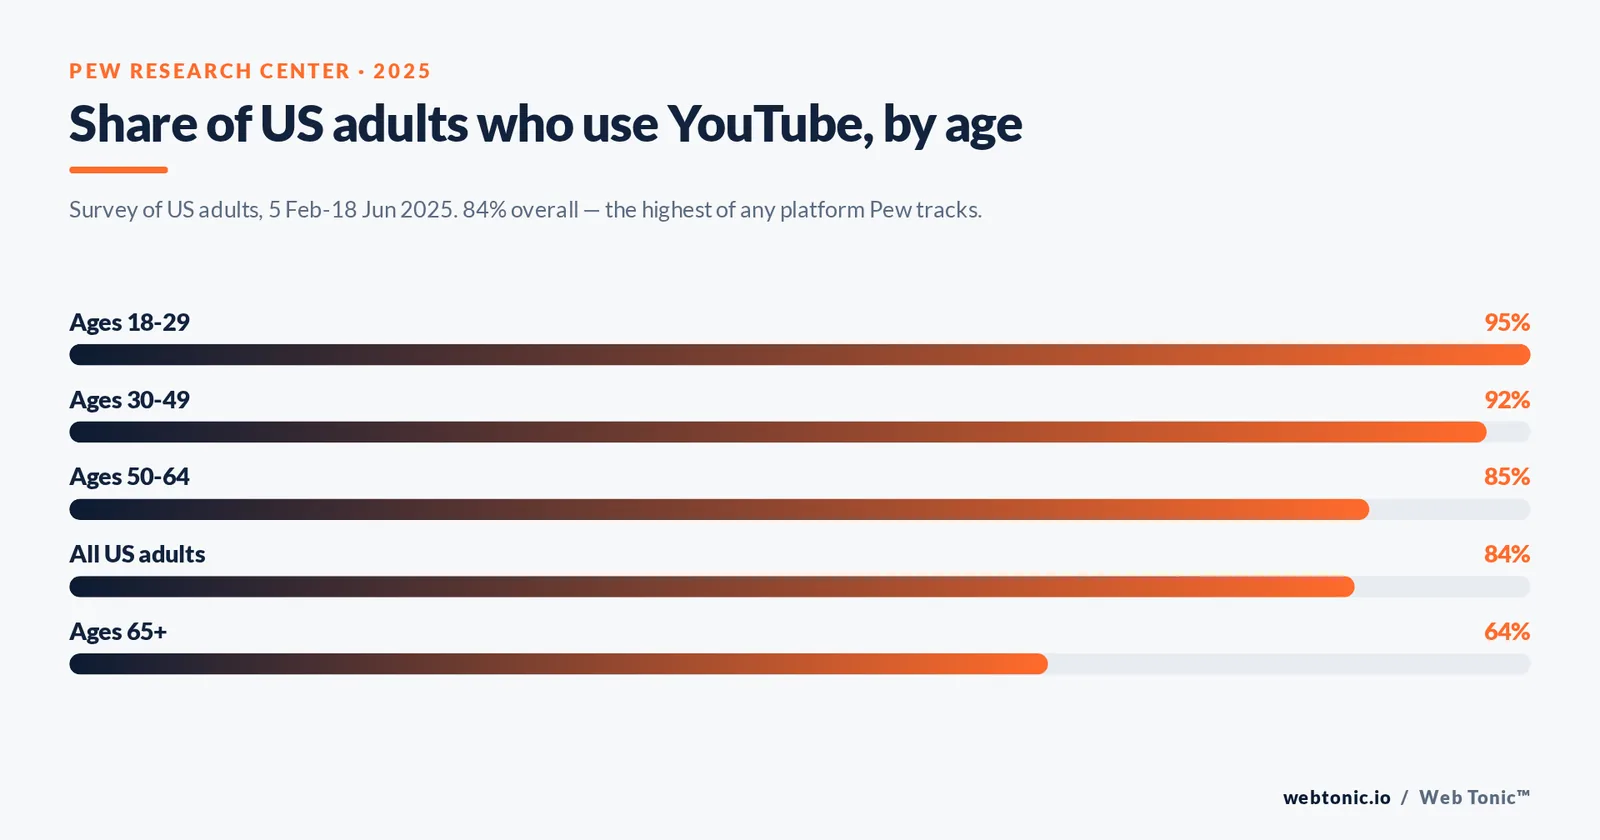
For U.S. audiences the authoritative source is Pew Research Center's social media fact sheet, based on a survey of U.S. adults conducted 5 February to 18 June 2025. YouTube tops every platform it measures, and unusually for a social platform its reach holds up across age brackets.
| Segment | % who use YouTube | Comparison: Facebook | Comparison: Instagram |
|---|---|---|---|
| All U.S. adults | 84% | 71% | 50% |
| Ages 18–29 | 95% | 68% | 80% |
| Ages 30–49 | 92% | 80% | 62% |
| Ages 50–64 | 85% | 74% | 40% |
| Ages 65+ | 64% | 57% | 19% |
| Men | 86% | 63% | 44% |
| Women | 83% | 78% | 55% |
| Asian adults | 92% | 62% | 58% |
| Hispanic adults | 88% | 74% | 62% |
| Black adults | 85% | 74% | 54% |
| White adults | 82% | 70% | 45% |
Globally the picture skews slightly differently: advertising-audience data indicates YouTube's audience is 53% male and 47% female, with 25–34-year-olds the largest single age group at 21.3% and 35–44s next at 18.7%. Compare that with the 64% of U.S. over-65s who use the platform in Pew's fact sheet and the strategic read is clear: YouTube is the only major platform where a single video can plausibly reach a 22-year-old and a 68-year-old in the same week.
YouTube usage by country
Audience size and commercial value diverge sharply by market. India has the largest audience by headcount, but the U.S. drives a much larger share of total traffic and the overwhelming majority of ad revenue per viewer.
| Country | Approximate users | Share of platform traffic (April 2026) |
|---|---|---|
| India | 518 million | 5.39% |
| United States | 259 million | 21.07% |
| Indonesia | 151 million | Not in top 2 |
The gap between India's 518 million users and its 5.39% traffic share versus the U.S. at 259 million users and 21.07% of traffic is the single most useful number in this article for anyone planning international spend. Reach is cheap in high-population, low-CPM markets and expensive where monetisation is dense; Statcounter's social media stats are useful for tracking those shifts by region over time.
Engagement, watch time and session length
Engagement is where YouTube separates from short-form-only platforms. Session length, not follower count, is the metric that explains its advertising economics.
| Platform | Average session length | Average daily time per user (Android) |
|---|---|---|
| YouTube | 14 min 29 sec | ≈1 hr 25 min |
| TikTok | 9 min 42 sec | 1 hr 37 min |
| Shorter than TikTok | 1 hr 13 min | |
| Shorter than Instagram | 1 hr 7 min |
A 14 min 29 sec average session is roughly 50% longer than TikTok's 9 min 42 sec, and TikTok's higher daily total comes from more frequent, shorter visits. Interaction volume is enormous in absolute terms too: YouTube videos averaged over 3.5 billion likes and about 100 million comments per day in 2024. Sprout Social's roundup of YouTube statistics consolidates these behavioural figures, and the mechanics behind what gets recommended are documented in How YouTube Works.
YouTube Shorts statistics
Shorts is now the platform's growth engine and the reason "YouTube versus TikTok" is a less useful framing every year.
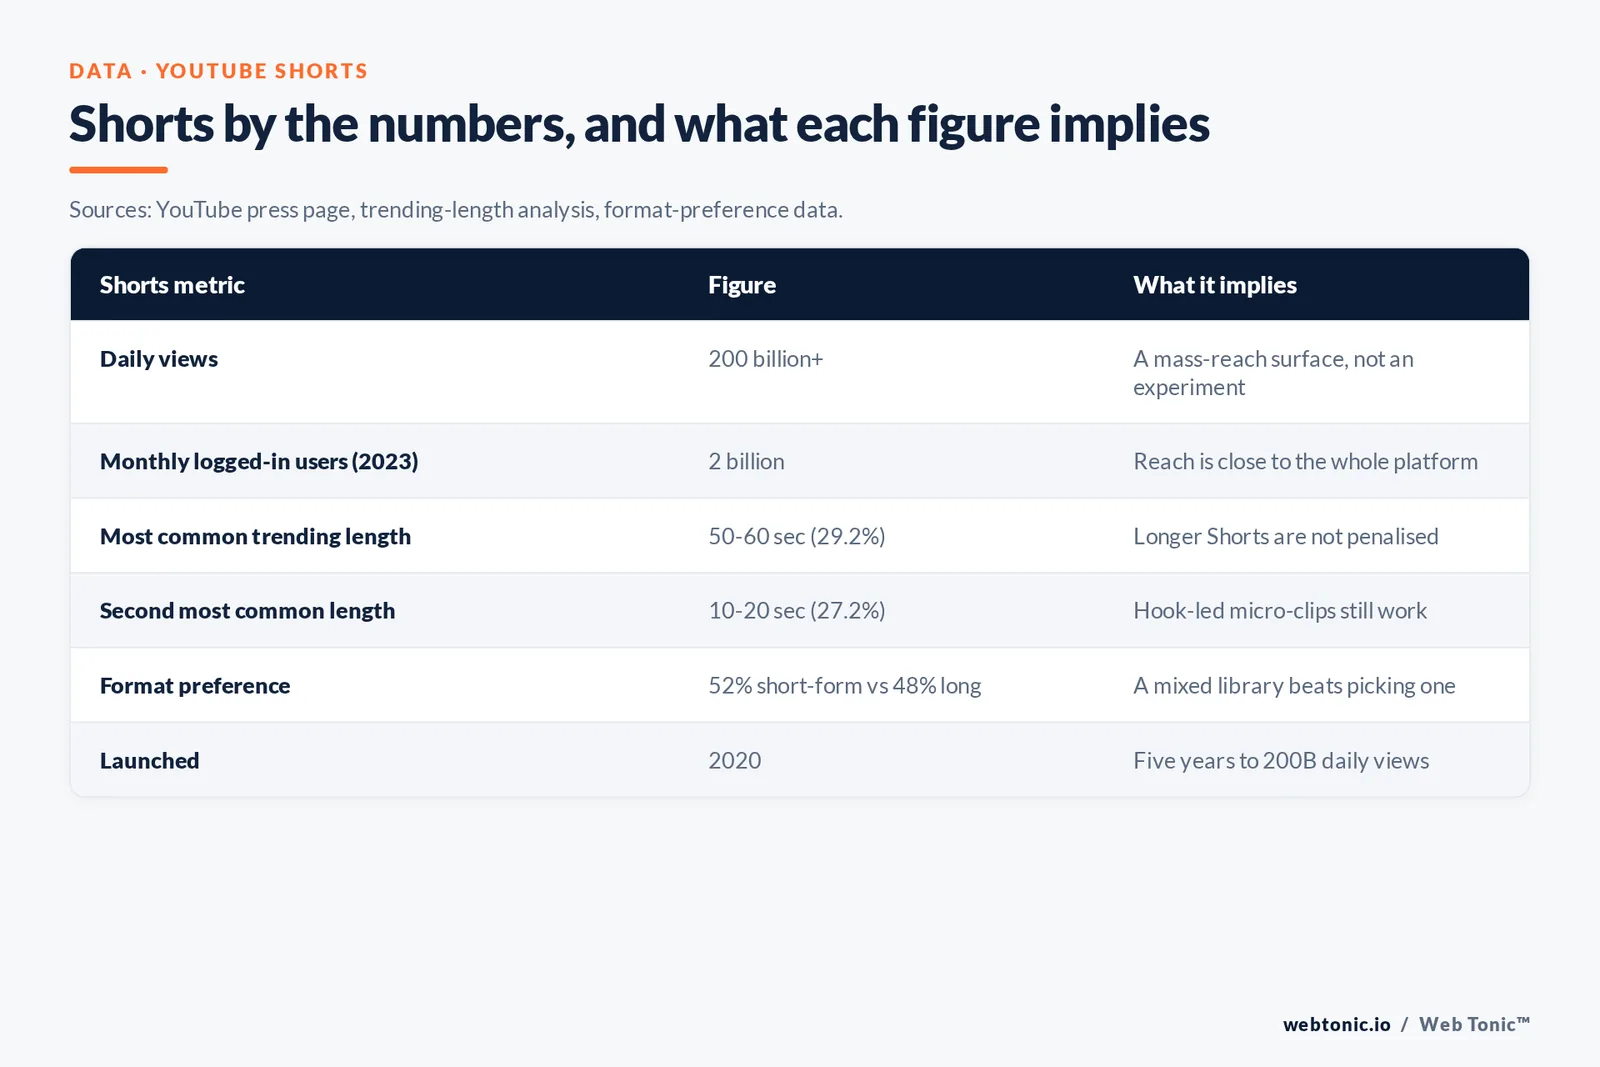
| Shorts metric | Figure | What it implies |
|---|---|---|
| Daily views | 200 billion+ | Shorts is a mass-reach surface, not an experiment |
| Monthly logged-in users (2023) | 2 billion | Reach is close to the whole platform |
| Most common trending length | 50–60 sec (29.2% of trending Shorts) | Longer Shorts are not penalised |
| Second most common length | 10–20 sec (27.2%) | Hook-led micro-clips still work |
| Format preference | 52% short-form vs 48% long-form | A mixed library beats picking one |
| Launched | 2020 | Five years to 200B daily views |
The interesting nuance is length. 29.2% of trending Shorts run 50–60 seconds and 27.2% run 10–20 seconds, so the distribution is bimodal rather than "shorter is better". What the recommendation system rewards is sustained attention within whatever length you choose — which is why measuring average view duration matters more than chasing a target runtime. If you are building a video library that has to serve both surfaces, that is the trade-off our performance creative team works through first.
Revenue, monetisation and creator economics
YouTube's advertising business is now large enough to be read as a media company in its own right, and the trend line matters more than the absolute number.
| Metric | Figure | Year |
|---|---|---|
| Ad revenue | $40.37 billion | 2025 |
| Ad revenue (prior year) | $36.15 billion | 2024 |
| Year-over-year growth | ≈11.7% | 2024 to 2025 |
| Total platform revenue | $60 billion+ | 2025 |
| Ads as share of total | More than 50% | 2025 |
| Premium and Music subscribers | 125 million+ | Reported 2026 |
| Marketers planning to invest more | 56% of companies | 2026 |
Two implications follow. First, ads at more than 50% of a $60 billion-plus business alongside 125 million-plus subscribers means a meaningful and growing share of the audience never sees an ad — subscription reach has to be earned with organic content. Second, 56% of companies raising YouTube budgets in 2026 means auction pressure is increasing, so creative efficiency is the lever, not bid ceilings. Alphabet reports YouTube advertising revenue in its quarterly results on its investor relations site, and eligibility rules for creator monetisation are set out in Google's YouTube Partner Program documentation.
What these statistics mean for a 2026 video strategy
Numbers without a decision attached are trivia. These are the five reads we act on for clients, in priority order.
- Priority 1 — treat YouTube as television. With #1 U.S. streaming watch time for nearly 3 years, connected-TV framing, pacing and legibility should drive creative decisions, not mobile-feed conventions.
- Priority 2 — publish for both surfaces. At a 52/48 split between short- and long-form interaction, a library with only one format concedes half the audience.
- Priority 3 — plan for 14-minute sessions. A 14 min 29 sec average session supports considered content: comparisons, demos and teardowns that would fail on a 9-minute-session platform.
- Priority 4 — segment spend by market economics. The 518 million vs 259 million user gap between India and the U.S. inverts once you look at the 21.07% traffic share; set CPM and CPA expectations per market.
- Priority 5 — reach the over-50s deliberately. With 85% of 50–64s and 64% of over-65s on the platform, YouTube is often the only efficient digital route to older buyers.
Google's own guidance on video planning sits in Think with Google's video strategy hub, and the longer-term data trail for the platform is tracked on Statista's YouTube topic page. If you would rather see these benchmarks applied to your own channel, our growth marketing team runs that analysis quarterly — get in touch, or browse more data breakdowns on the Web Tonic blog.
How to read YouTube statistics without getting burned
Most bad YouTube claims are not invented; they are simply mismatched. A figure describing logged-in users gets quoted as total viewers, a 2023 number gets repeated in 2026, or a single-market survey is presented as global. Before you put a number in a deck, check which of these five categories it comes from — the reliability difference is large.
| Type of source | What it can tell you | Where it misleads | Confidence |
|---|---|---|---|
| 1. Platform disclosures | Uploads, Shorts views, language coverage | Selective, rarely dated precisely | High for direction, low for precision |
| 2. Advertising-reach tools | Reachable users, age and gender split by market | Counts accounts and devices, not people | High, with a stated definition |
| 3. Panel measurement | Share of TV and streaming watch time | U.S.-only, TV-screen weighted | Very high within scope |
| 4. Probability surveys | Population-level usage such as the 84% U.S. figure | Self-reported, annual cadence | Very high for national reach |
| 5. Clickstream and app panels | Visits, session length, traffic share by country | Modelled estimates, platform-specific | Medium, good for comparison |
Three rules follow from that table. Rule 1: never mix categories in one claim — a reach figure from advertising data and a watch-time figure from a TV panel cannot be divided into each other. Rule 2: date every number, because YouTube's own metrics such as the 200 billion daily Shorts views have moved by an order of magnitude in under 3 years. Rule 3: quote the definition, not just the value — "2.58 billion reachable users" and "billions of monthly logged-in users" are different claims from different measurement systems, and only one of them is a company statement.
Channel benchmarks worth tracking instead of vanity metrics
Platform-level statistics set expectations; channel-level metrics decide outcomes. If you only track subscribers you will optimise for the one number that has the weakest relationship to business results.
| Metric | Why it matters | Review cadence |
|---|---|---|
| Average view duration | The signal recommendation systems respond to, at any length | Weekly |
| Average percentage viewed | Normalises comparison between a 45-second Short and a 12-minute video | Weekly |
| Impressions click-through rate | Tests packaging — title and thumbnail — independently of content | Weekly for the first 7 days |
| Traffic source mix | Search-led and suggested-led growth behave very differently | Monthly |
| Returning viewers | The closest proxy on the platform to audience ownership | Monthly |
| Device split | Decides text size, pacing and whether captions carry the message | Quarterly |
| View-through and conversion rate | The only metrics that connect video to revenue | Monthly |
FAQ
How many people use YouTube in 2026?
Roughly 2.58 billion users can be reached on YouTube each month according to the Digital 2026 Global Overview Report, which is about 45% of the 5.66 billion people using social media worldwide. YouTube itself describes the platform as having billions of monthly logged-in users but does not publish a precise figure, so advertising-reach data is the most defensible number to quote.
What percentage of Americans use YouTube?
84% of U.S. adults use YouTube, according to Pew Research Center's survey conducted 5 February to 18 June 2025 — the highest figure of any platform Pew tracks, ahead of Facebook at 71% and Instagram at 50%. Usage is 95% among 18–29s, 92% among 30–49s, 85% among 50–64s and 64% among adults 65 and older.
How many videos are uploaded to YouTube every day?
More than 20 million videos are uploaded daily, per YouTube's own press page. That volume is the practical argument for treating discovery as a search and packaging problem: titles, thumbnails, and the first 15 seconds decide whether a video enters the recommendation system at all.
How much revenue does YouTube generate?
YouTube advertising revenue was $40.37 billion in 2025, up from $36.15 billion in 2024, representing more than half of the platform's total revenue of over $60 billion. Alphabet reports the advertising line each quarter in its results, with subscription income from YouTube Premium, Music and TV disclosed separately within Google's other revenue segments.
Is YouTube bigger than TikTok for marketers?
On reach and session depth, yes: YouTube's 2.58 billion reachable users and 14 min 29 sec average session outweigh TikTok's shorter 9 min 42 sec sessions, though TikTok users spend more total daily time in shorter bursts. The practical answer is that they serve different jobs — TikTok for rapid cultural reach, YouTube for considered content, search visibility and connected-TV reach.
Sources
YouTube press page (uploads, Shorts views, localisation, Nielsen watch-time claim) · Pew Research Center, social media fact sheet, survey of U.S. adults 5 Feb–18 Jun 2025 · DataReportal, Digital 2026 Global Overview Report · Sprout Social, YouTube statistics, May 2026 · Statista, global social network ranking and YouTube topic page · Similarweb data via Sprout Social · Nielsen, The Gauge · Alphabet investor relations · Google, YouTube Partner Program documentation · Statcounter · Think with Google. All sources accessed August 2026.