



Table of contents
A win-rate benchmark is meaningless until its denominator is named. This 2026 reference page separates opportunity close rates from stage conversion, pipeline coverage, slippage and deal-size mix, using observed B2B sales evidence rather than a universal quota.
Key Takeaways
- Ebsta’s 2024 benchmark analyzed 4.2 million opportunities across 530 companies, representing more than USD 54 billion in revenue.
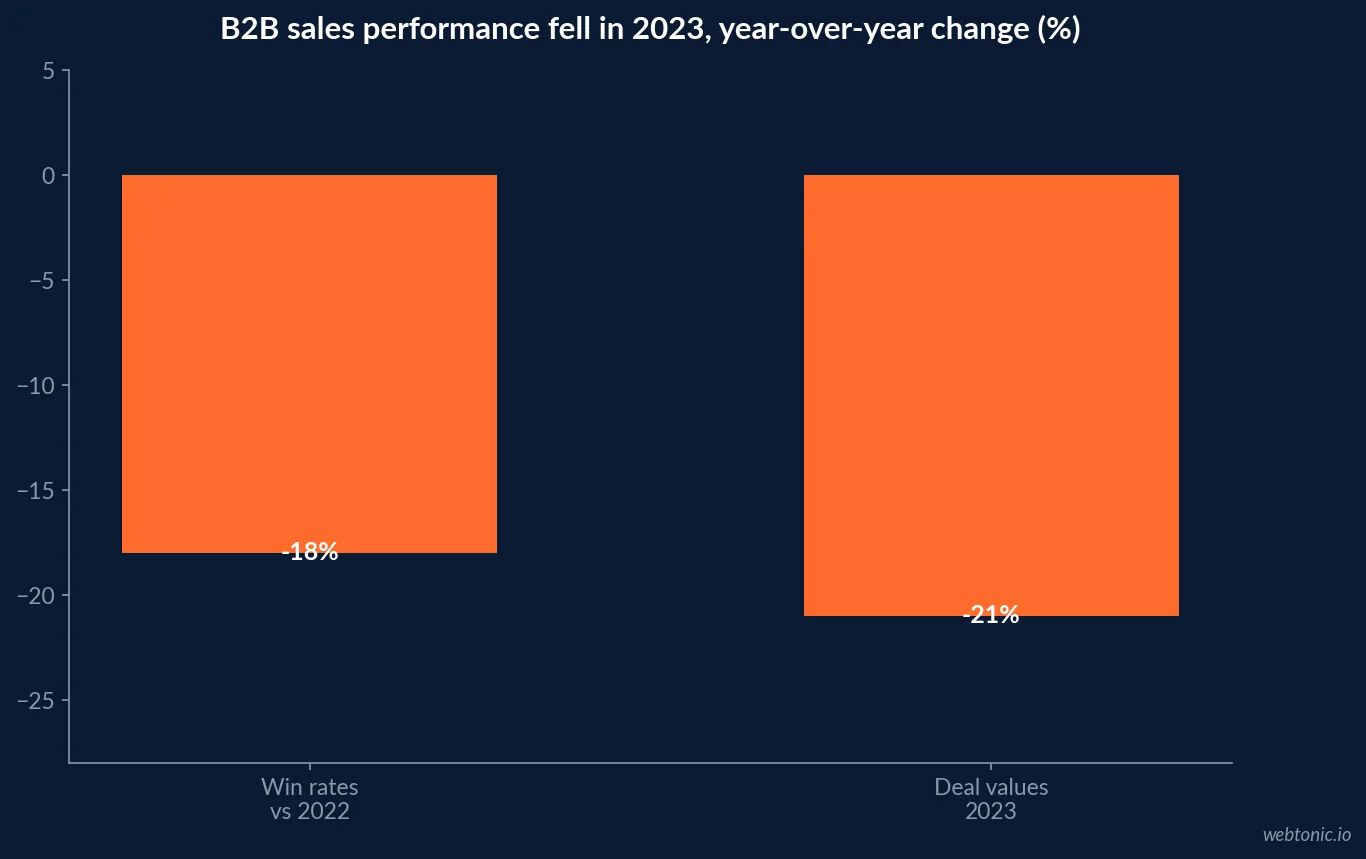
- Its B2B win rates fell 18% in 2023 versus 2022 and 27% versus 2021.
- Average deal values fell 21% and sales cycles grew 16% in H1 2023, before shifting in H2.
- 44% of deals were delayed or pushed back in Ebsta’s benchmark.
- When deals slipped, win rates fell 67%, particularly when delay exceeded eight weeks.
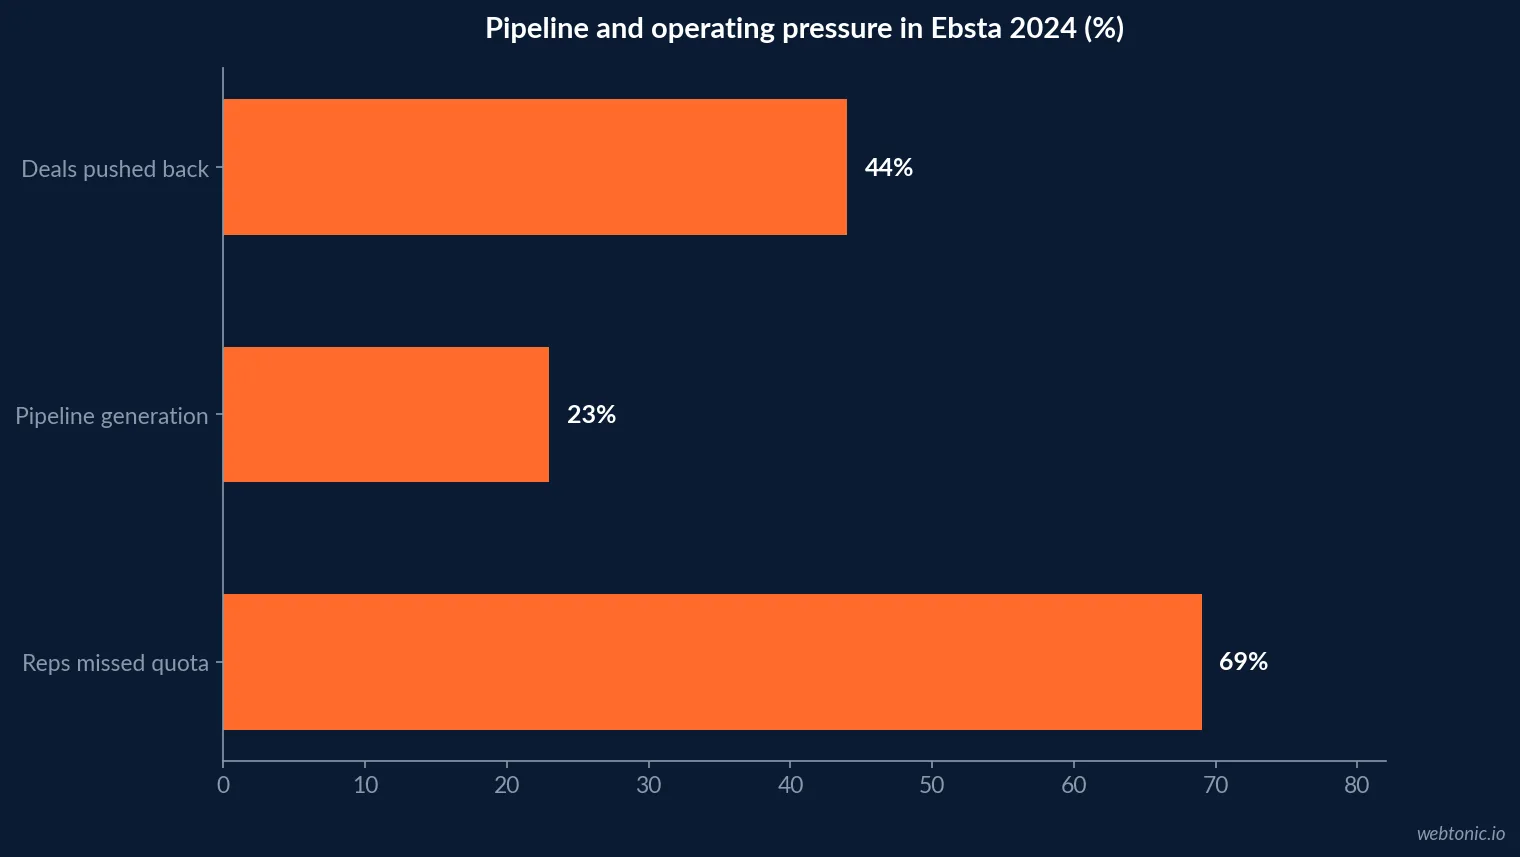
- Pipeline generation rose 23% as win rates declined: more pipeline alone did not solve conversion.
- 69% of sales reps missed quota on average in the 2024 report, with smaller quota targets affecting year-over-year comparison.
- 17% of reps generated 81% of revenue in Ebsta’s observed sample.
- Weekly opportunity updates were associated with a 17% greater likelihood of closed-won.
- Opportunities that skipped a stage were 46% less likely to close.
- Discounts introduced before negotiation corresponded with a 39% lower win rate in the report.
- Separate opportunity win rate from pipeline coverage and stage-to-stage conversion; their denominators are not interchangeable.
Win rate is a formula, not a market constant
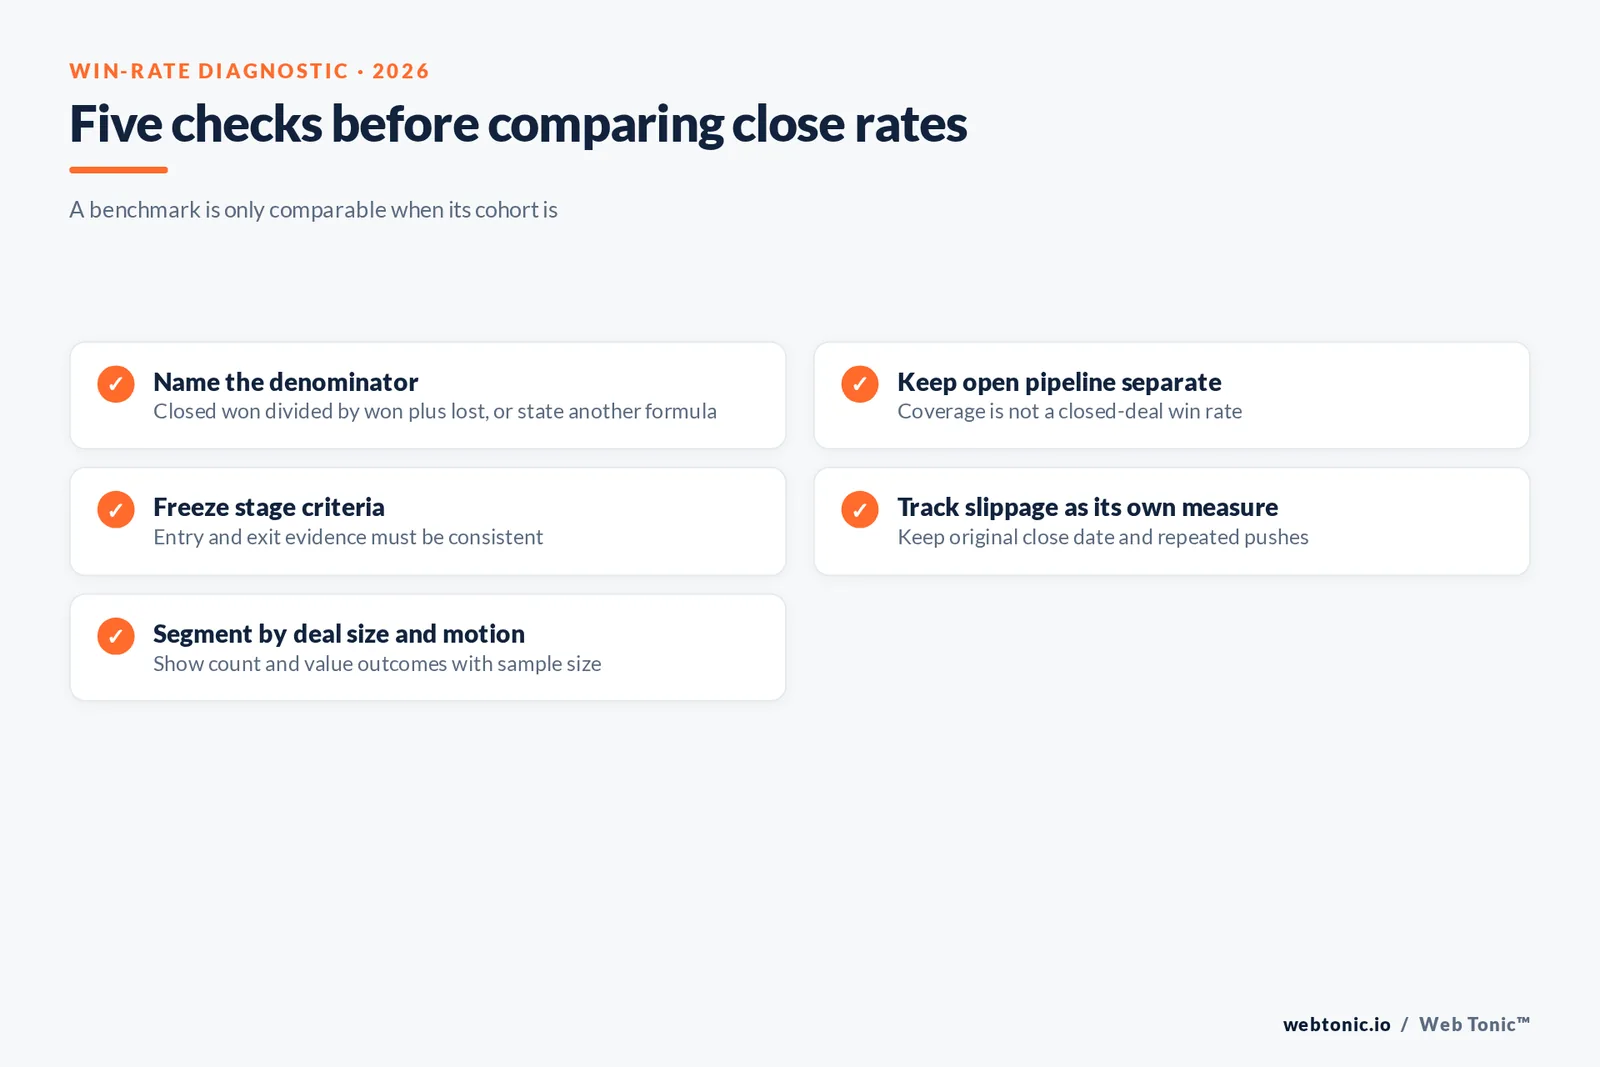
For a closed-opportunity win rate, a transparent formula is closed-won opportunities divided by all closed opportunities (closed-won plus closed-lost) in the selected cohort. State the cohort start date, close date window, sales motion, segment, geography and whether reopened or duplicate opportunities are included. If measuring dollars rather than deal count, say so: value-based win rate is won amount divided by won-plus-lost closed amount.
Do not count open pipeline in that closed-deal denominator. Open opportunities belong in pipeline coverage, stage aging and forecast views. Stage conversion is a different question again: opportunities reaching a next stage divided by opportunities entering the prior stage. A team may show a healthy stage conversion but weak closed-won outcomes when deals stall late, or apparently high wins when it counts only a narrowly qualified set.
External reports may use proprietary definitions. Ebsta describes its sales-velocity analysis across opportunity data and sales processes, but its year-over-year index movement is not an industry-wide absolute win-rate percentage. Treat it as a directional benchmark, not a portable target.
What the 2024 benchmark measured
Ebsta and Pavilion’s 2024 B2B Sales Benchmarks report analyzed 4.2 million opportunities, more than one million hours of conversations, and 530 companies representing over USD 54 billion in revenue. It was designed to examine sales performance across small, medium and enterprise processes. Those characteristics make it a substantial observed-data benchmark, but still one study’s customers, definitions and period.
The report’s “State of Sales in 2024” section describes a difficult 2023: win rates declined 18% from 2022 and 27% from 2021. Average deal values decreased 21%; sales cycles grew 16% in H1 and 38% compared with 2021, then cycles reduced 23% by year end as conditions stabilized. Keep the within-year sequence intact rather than collapsing it into one simple annual trend.
In a separate H1 2024 update, Ebsta reported win rates down 7% versus 2023, deal values up 7%, and deal slippage reaching 46% in Q1 before falling to 34%. That update is a newer but separate measurement; it should not be blended with the original report’s 2023 figures.
| Measure | Ebsta 2024 report: 2023 context | Ebsta H1 2024 update | Interpretation |
|---|---|---|---|
| Win rates | −18% vs 2022; −27% vs 2021 | −7% vs 2023 | Separate periods and report vintages |
| Deal values | −21% in 2023 | +7% vs 2023 in update | Value mix and market conditions shifted |
| Sales cycle | +16% in H1; +38% vs 2021; −23% by year end | Not equivalent to the full-year trend | Read chronology, not one annual average |
| Deal slippage | 44% of deals pushed back | 46% in Q1, then 34% | Define slip window and denominator |
| Pipeline generation | +23% | Pipeline up 25% since end of 2023 | Volume did not alone solve close rates |
Stage conversion: find where the funnel loses momentum
Track the count and value entering each stage, advancing, closing, or exiting. A stage dashboard should show conversion by cohort, median days in stage, aging distribution and next-step coverage. Ebsta reported opportunities that skipped a stage were 46% less likely to close; deals spending more than seven days without future activity had win rates 65% lower. Those relationships support disciplined stage management, but they are not proof that forcing every opportunity through a checklist causes a win.
Stage definitions need entry and exit criteria that reps can apply consistently. If “proposal” means a verbal discussion for one team and a buyer-reviewed document for another, the transition rate is not comparable. Define a meaningful buyer action for each stage and audit samples of records. Review conversion by segment and rep, but keep small denominators visible; tiny cohorts produce volatile percentages.
Track the percentage of opportunities with a dated next step and the count of close-date changes. In Ebsta’s report, opportunities updated weekly were 17% more likely to close won, and dates moved more than three times corresponded to a 77% reduction in win rates. Use these indicators to improve forecast hygiene and buyer momentum, not as a punitive activity quota.
| Funnel metric | Formula | Use it to diagnose | Do not confuse with |
|---|---|---|---|
| Stage conversion | Reached next stage ÷ entered prior stage | Where qualified deals stop progressing | Closed opportunity win rate |
| Closed opportunity win rate | Won ÷ (won + lost) closed opportunities | Outcome among resolved deals | Pipeline coverage |
| Value win rate | Won amount ÷ (won + lost amount) | Outcome weighted by deal value | Deal-count win rate |
| Pipeline coverage | Open pipeline ÷ quota or target | Potential future supply | Probability of closing |
| Slippage rate | Deals pushed beyond close date ÷ defined cohort | Forecast movement and delay | Lost deal rate |
Pipeline coverage is not a substitute for conversion
Coverage asks whether open pipeline value is sufficient relative to a revenue target. Win rate asks how often closed opportunities are won. A rising coverage ratio can be caused by more opportunities, inflated values, stale dates or longer cycles. Ebsta’s report noted pipeline generation increased 23% while revenue fell and win rates deteriorated; the company cautioned that seeking more coverage could be hopeful rather than effective if qualification remained weak.
Use coverage together with stage- and segment-specific conversion and expected close timing. Apply a consistent value convention (ARR, first-year value, total contract value) and compare it with a quota measured on the same basis. If a business has materially different deal sizes, report both count coverage and value coverage to make concentration visible.
For practical operation, pair each coverage report with the percent of opportunities matching the ideal customer profile, a qualification score, close-date confidence and aged pipeline share. Ebsta’s H1 2024 update reported only 18% of 2024 pipeline matched ICP in its dataset and reported win rates were 3.1 times higher when opportunities matched ICP. That is a strong reason to test fit, not to inflate coverage indiscriminately.
Slippage tells you about timing and probability
Slippage is not the same as a lost deal: a purchase can move to a later date and eventually close. But repeated slippage is a forecast signal. Ebsta reported 44% of deals being pushed back in its 2024 report; win rates fell 67% when deals slipped, particularly those delayed more than eight weeks. Its H1 2024 update showed 46% deal slippage in Q1 and 34% later in the period. These figures differ by observation window and must remain clearly labeled.
Track first slippage, cumulative slippage, days beyond original close date and the eventual outcome. Compare delays by stage, segment and reason. A buyer-driven legal review is different from a seller’s unqualified date. Keep the original date as a historical field; overwriting it hides forecast error. Sales operations should define the time window and whether multiple push-outs count once or repeatedly.
When close dates move, revisit decision process, budget, urgency, stakeholder access and competing priorities. A forecast call should produce a concrete next step or a deliberate reset—not a new date unsupported by buyer evidence.
Deal size: segment before averaging
A mean deal size can be dominated by a handful of large contracts. Report median and distribution bands, with value basis and time period. Ebsta’s 2024 appendix categorizes ARR bands from USD 10,001–25,000 through USD 1 million-plus and breaks out industries and employee ranges. This segmentation is more useful than taking one average and applying it to every pipeline.
Win rate by count may tell a different story from win rate by value. If a team closes many small deals and loses a few enterprise opportunities, deal-count close rate can look stable while revenue attainment falls. Keep both measures, median deal value and contribution by band. Also compare sales cycle and slippage by band, since longer enterprise cycles create a timing mismatch with monthly or quarterly close cohorts.
Never label a source band as the “average deal size” unless it reports an average. The Ebsta report’s appendix provides categorical ranges; it does not license a universal average contract value.
| Deal-size reporting cut | Recommended statistic | Why it matters | Cohort rule |
|---|---|---|---|
| All closed deals | Median and quartiles | Limits outlier distortion | Use close date and currency |
| ARR bands | Win rate by count and value | Shows segment-specific outcomes | Keep the same band edges |
| Industry × band | Cycle and slippage | Separates buying-process differences | Avoid very small samples |
| New vs expansion | Separate deal count and amount | Different motions have different economics | Do not blend renewal effects |
| Large-deal concentration | Share of total won amount | Flags reliance on a few contracts | Compare across matched periods |
Quota attainment is adjacent, not equivalent.
A rep missing quota does not prove poor conversion alone. Quota size, territory potential, attainment period, ramp status and account assignment all affect attainment. Ebsta reported 69% of reps falling short on average in its 2024 report; it also noted average quota targets were 19% smaller year over year, and on a consistent-target basis it estimated 79% would have missed. The report further observed that 17% of reps generated 81% of revenue. That concentration is important to planning, but not a personal performance standard by itself.
HubSpot’s 2024 Sales Trends Report, a survey of more than 1,400 sales professionals covering 2023 performance, reported an average sales win rate of 21% and median deal size of USD 4,000. Those are survey-reported broad-market values and may use different definitions from Ebsta’s observed B2B opportunities; they are not a target for a specific team.
Salesforce Research’s 2025 U.S. sales compensation report, based on survey data fielded in 2025, also highlights how few U.S. sales representatives made quota in the prior year. Its results are self-reported survey evidence and use a different sample and definition than Ebsta’s opportunity data. Do not stitch the rates together; use the contrast to ask what quota, rep and opportunity definitions drive the difference.
For a fair scorecard, report quota attainment alongside qualified pipeline created, conversion by stage, win rate, deal value, cycle time and territory potential. Separate new hires and ramp periods and show sample sizes.
Build the 2026 operating scorecard
Set a baseline from a full, stable historical window. Freeze definitions for stage, win, loss, slip and deal value. Create a closed cohort and keep open pipeline separately. Report win rate by count and amount; stage conversion; days in stage; median contract value; slippage; and quota attainment. Add slices only where the sample is adequate and the sales motion is comparable.
Use the report to target an operational question: is qualification weak, are buyer groups disengaged, are next steps missing, or are close dates unrealistic? Ebsta found 366% greater likelihood of closing at discovery among top performers and 203% greater likelihood to close in a historical “golden period”; treat these as relative observations from its study, not guaranteed lift from a single intervention. Test any process change and observe outcomes over a full sales cycle.
Our data intelligence practice can support metric definitions and dashboards, while growth marketing connects acquisition and pipeline measurement. See our channel planning guide and paid media cost guide for adjacent demand-generation context.
Benchmarking rules for management teams
When an external benchmark uses a different definition, record the source’s unit, period, sample and cohort. Compare your movement to your own baseline first; use external numbers to frame the market context and select a diagnostic, not to set an arbitrary performance target. Make the logic auditable: source data, filters, exclusions and formula should be reproducible from CRM records.
A win-rate report that separates stages, slippage and size bands gives operators levers. A single blended percentage offers none. Start with denominator discipline, preserve cohort context and keep forecast quality visible next to close outcomes. That is what makes a benchmark usable in the 2026 planning cycle.
What current survey benchmarks add—and what they cannot
Norwest’s 2025 B2B Sales & Marketing Benchmark Report reports funnel conversion medians including roughly 36% from marketing-qualified lead to sales-qualified lead, 40% from sales-qualified lead to opportunity, 42% from opportunity to proposal, and 45% from proposal to win. Those are survey-reported company benchmarks, not observed CRM-wide opportunity outcomes. Norwest also reports that 48% of respondents plan for approximately three-times quota in qualified pipeline coverage. That is a reported planning choice, not evidence that three-times coverage guarantees attainment.
These figures can be useful for a directional comparison when your definitions align. Validate how survey respondents define MQL, SQL, opportunity, proposal and win. The unit and selection bias differ from Ebsta’s observed opportunity dataset. Use your own historical funnel to set a target, then monitor whether changes in lead qualification and stage definitions alter the base rate.
Norwest’s 2025 report is based on survey responses from companies in its sample; the numbers should not be called a universal industry average. Put “survey median” and the report year in the chart label.
| Survey funnel stage | Norwest 2025 reported median | Measure locally with | Interpretation |
|---|---|---|---|
| MQL → SQL | ~36% | Accepted qualified leads ÷ MQLs | Agreement on lead qualification |
| SQL → opportunity | ~40% | Opportunities created ÷ SQLs | Sales acceptance and fit |
| Opportunity → proposal | ~42% | Proposals ÷ opportunity cohort | Stage criteria and buyer intent |
| Proposal → win | ~45% | Won proposals ÷ resolved proposal cohort | Resolution period and close rules |
| Pipeline coverage | ~3× quota most common plan | Comparable open pipeline ÷ target | Planning practice, not guarantee |
Watch out for denominator drift and survivorship
When a team changes what counts as an opportunity, historical win rates can move without any change in selling skill. A stricter qualification threshold may reduce opportunity volume and improve the closed-deal rate by removing weak records. That can still be good operating practice, but the shift should be annotated as a definition change. Keep a stable cohort or recalculate the prior period under the new rule where possible.
Closed-only rates also exclude deals still in progress. If a long sales cycle leaves a large share open at period end, the closed cohort may be unusually fast-moving. Track mature cohorts and show open share, age and elapsed time. This avoids calling an unfinished pipeline a win-rate improvement simply because the hard deals have not yet resolved.
Finally, distinguish rate from volume. A small team that closes 8 of 10 opportunities has an 80% observed win rate, but that rate is uncertain and may not predict the next cohort. Include counts and confidence intervals or at least sample-size flags when rates are used for high-stakes decisions.
Use evidence to prioritize one bottleneck at a time. If stage progression is weak, inspect fit and buyer-defined exit criteria. If close dates slip, test discovery quality and access to decision-makers. If deal value falls, investigate segment and package mix. If attainment is concentrated in a small group, study the repeatable behaviors and territory conditions before prescribing a universal playbook.
Build a review cadence around a stable scorecard: weekly pipeline hygiene, monthly cohort conversion, and quarterly segment analysis. Keep the CRM event history so analysts can identify date changes and stage skips. At Web Tonic, the data intelligence practice helps establish measurement structure; our growth marketing service connects demand activity to qualified pipeline. For acquisition context see our Google Ads strategy guide and paid search cost analysis.
Use a consistent cohort cut: qualified opportunity creation dates for the funnel, close dates for resolved outcomes, and a fixed currency and deal-value basis. Separate new business from renewals and expansion. Flag missing close dates, duplicate records, reopened deals and opportunities that were administratively closed. Then compare both the percentage and the underlying count.
Use an external benchmark only if it shares the relevant population and definition. Ebsta’s observed CRM data, Norwest’s 2025 survey medians, and an internal CRM cohort do not measure the same thing. Write the source and timeframe into the title of every benchmark chart. If they differ, explain why and use the external result as a prompt rather than a target.
Keep a change log for stage criteria, ICP definition and quota design. It is better to show a break in the series than to pretend a redefined funnel is continuous. This helps leaders see when a change in win rate represents a business outcome versus a reporting change.
A practical benchmark should show the rate and its count, for example 45% of 100 resolved opportunities, rather than 45% alone. This exposes whether one unusually large contract or a handful of outcomes dominates the period.
| Comparison control | Requirement | Why it protects the read |
|---|---|---|
| Cohort window | Creation or close date stated | Avoids mixing immature and resolved deals |
| Win definition | Won ÷ (won + lost), or explicit alternative | Makes denominator reproducible |
| Deal value | ARR, ACV or TCV consistently | Prevents apples-to-oranges value rates |
| Segment | New business, renewal and expansion split | Sales motions differ |
| Sample size | Counts alongside percentages | Shows rate volatility |
| Definition changes | Dated change log | Separates process change from performance |
Read pipeline and deal-size benchmarks in context
Norwest’s 2025 survey also found that expected sales-cycle length scales with annual contract value: approximately two to three months for deals below USD 25,000 and nine to twelve months for deals above USD 500,000. That is a survey-reported range, not a forecast rule. It reinforces the need to cohort deal size before comparing slippage and conversion, because a quarter-end view can contain a very different share of immature enterprise opportunities.
Ebsta’s analysis segmented ARR bands and reported on opportunity movement and outcomes. Put the two kinds of evidence side by side only as context: one is a survey of leaders and the other an observed sales data set. The operational takeaway is to measure cycle and outcome within the same contract-value band, not to apply one sales-cycle target to every opportunity.
| Deal size band | Norwest 2025 survey cycle range | Analyst implication |
|---|---|---|
| Below USD 25K ACV | About 2–3 months | Compare smaller-deal cohorts separately |
| USD 25K–500K ACV | Varies between reported ends | Use finer bands if sample allows |
| Above USD 500K ACV | About 9–12 months | Use mature cohorts and longer windows |
| All deals combined | One blended average hides mix | Report median and distribution |
Frequently Asked Questions
What is a good sales win rate?
There is no universal good rate. It depends on whether the denominator is qualified opportunities, all pipeline, proposals or competitive deals; how the team defines won and lost; and the market, segment and period. Ebsta’s 2024 benchmark reported an 18% decline in B2B win rates during 2023 versus 2022 and a 27% decline versus 2021. That is a movement in its dataset, not a cross-industry target.
How do you calculate win rate?
State the unit and formula. A common opportunity win rate is closed-won opportunities divided by all closed opportunities (won plus lost) in a defined cohort. If using pipeline dollars, divide won amount by closed won-plus-lost amount. Do not mix open opportunities into a closed-deal conversion rate; report pipeline coverage separately.
Does more pipeline improve win rate?
Not automatically. Ebsta’s 2024 benchmark reported pipeline generation up 23% while win rates fell, and 44% of deals slipped. More volume can add poorly qualified opportunities or move the denominator without creating demand. Track qualification, stage conversion, slippage and capacity alongside coverage.
Why do larger deals have different win rates?
Larger deals often involve more stakeholders, longer cycles, procurement and more complex qualification, but no universal size penalty should be assumed. Segment win rate and cycle time by consistent deal-size bands and sales motion. Ebsta’s 2024 report segmented ARR deal size bands and industries; it does not provide a single average deal size that should be generalized to every seller.
Sources
Ebsta and Pavilion, 2024 B2B Sales Benchmarks
Ebsta, H1 2024 B2B Sales Benchmarks update
Salesforce Research, U.S. Trends in Sales Compensation
Gong Labs, analysis of sales opportunities and win-rate differences
Norwest, 2025 B2B Sales and Marketing Benchmark Report
HubSpot, 2024 Sales Trends Report
HubSpot, configure and define sales pipeline stages
Salesforce, sales pipeline definitions and management
Pipedrive, sales metrics guide
Microsoft Learn, sales pipeline overview


