



Table of contents
Wealth management firms with structured marketing analytics programs generate 29% year-over-year improvement in marketing attribution accuracy — yet nearly half still lack proper cross-channel tracking. Here are the adoption rates, performance benchmarks, and ROI measurement frameworks that separate data-driven RIAs from the rest in 2026.
Key Takeaways
- CRM penetration in RIA firms has reached 92%, with 82% using CRM for marketing automation (Gitnux).
- 83% of wealth management firms now use or pilot AI/ML tools, primarily for meeting prep, client communication, and workflow automation (InvestmentNews).
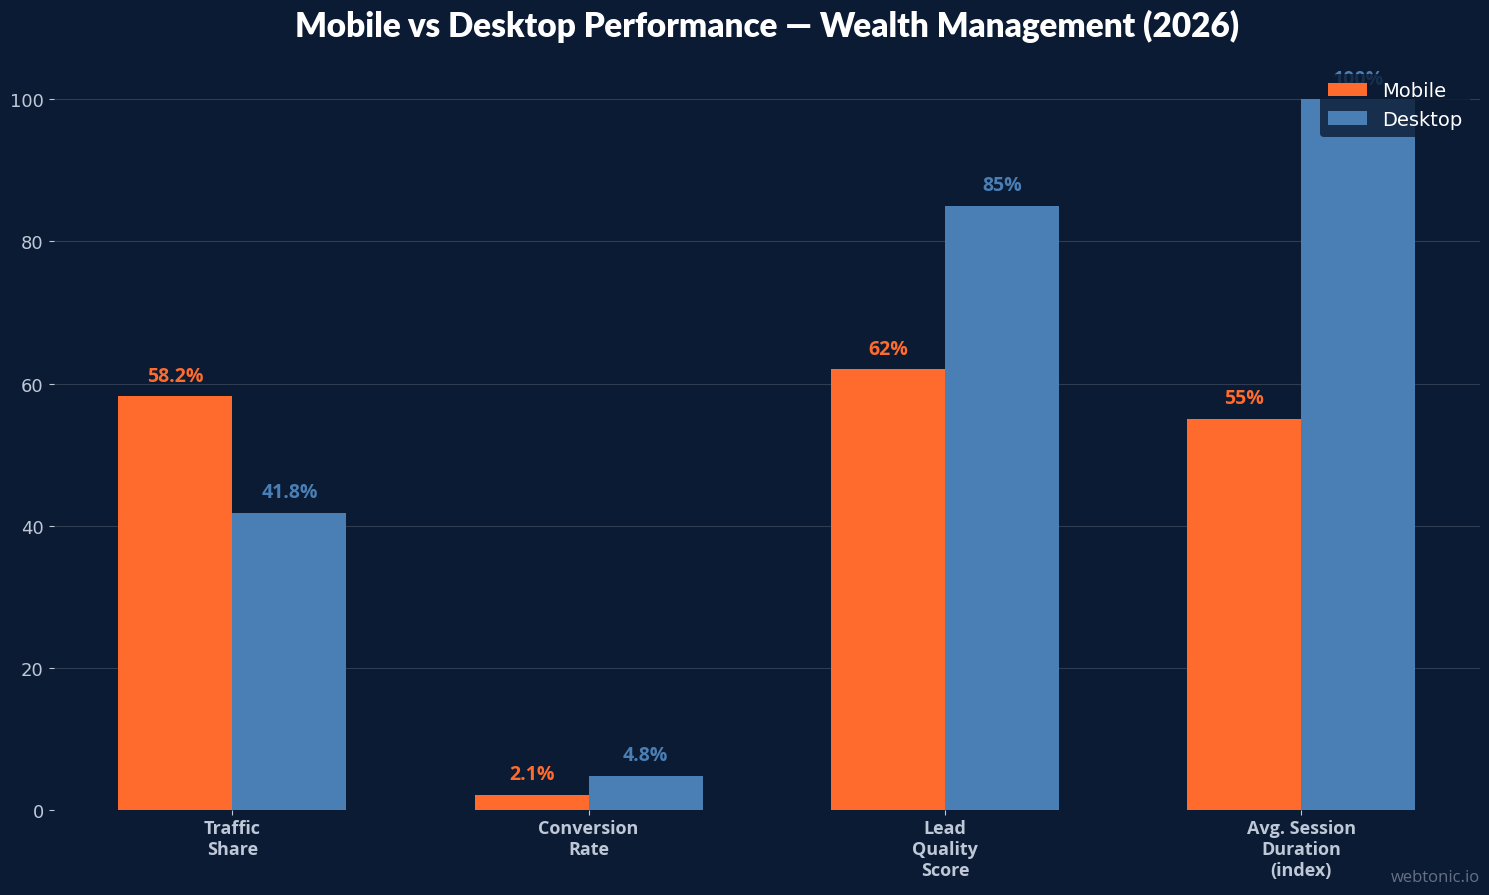
- Mobile traffic accounts for 58.2% of visits, but desktop converts at 4.8% vs. 2.1% — a 2.3× gap that demands device-specific tracking (CuFinder).
- Landing page conversion averages 3.4%, with top-performing wealth management firms reaching 11.5% (CuFinder).
- Email open rates hit 36.5% — among the highest across all industries — making email a critical analytics-tracked channel (CuFinder).
- 64% of wealth management firms increased AI budgets in 2026, yet ROI measurement for these investments remains elusive for most (InvestmentNews).
- Marketing attribution accuracy improved 29% YoY among RIA firms that adopted multi-touch attribution models (Gitnux).
Wealth Management Marketing Analytics Benchmarks at a Glance
| Metric | Benchmark | Source |
|---|---|---|
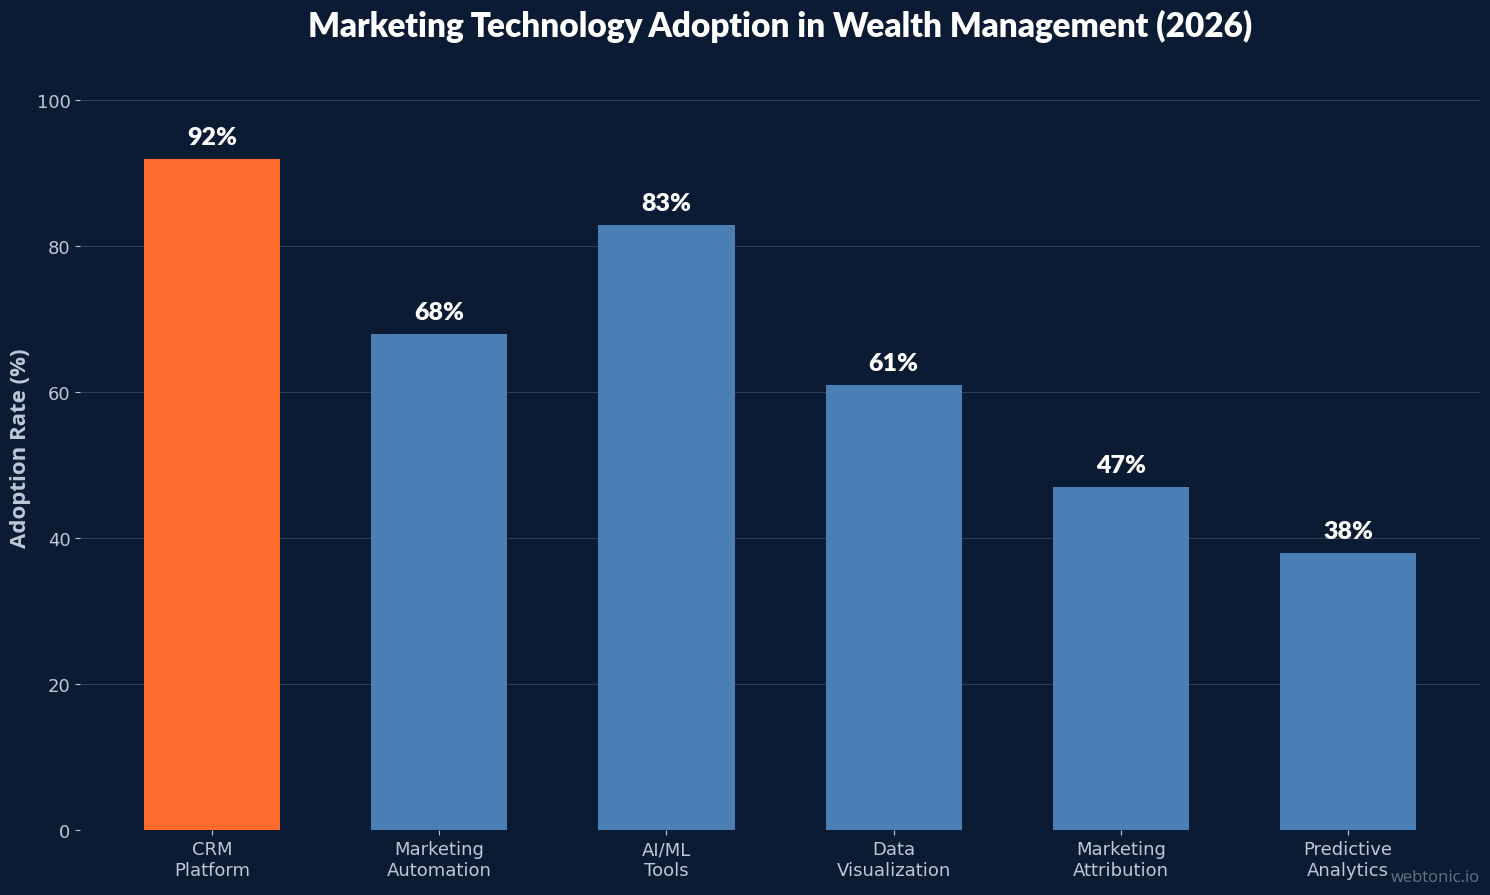
| CRM Adoption Rate | 92% | Gitnux 2026 |
| CRM for Marketing Automation | 82% | Gitnux 2026 |
| AI/ML Tool Adoption | 83% | InvestmentNews 2026 |
| Mobile Traffic Share | 58.2% | CuFinder 2026 |
| Desktop Conversion Rate | 4.8% | CuFinder 2026 |
| Mobile Conversion Rate | 2.1% | CuFinder 2026 |
| Avg. Landing Page CVR | 3.4% | Benchmarketing 2026 |
| Top 10% Landing Page CVR | 11.5% | CuFinder 2026 |
| Email Open Rate | 36.5% | CuFinder 2026 |
| Google Ads CPA | $284 | Benchmarketing 2026 |
CRM and Marketing Automation Adoption in Wealth Management
CRM usage in RIA firms has reached a 92% penetration rate, making it the most universally adopted marketing technology in the industry (Gitnux). What distinguishes growth leaders from the pack is how they use CRM: 82% of RIAs now leverage CRM for marketing automation, integrating email sequences, lead scoring, and pipeline tracking into a single workflow. Firms that connect their CRM to marketing channels report faster lead-to-client conversion times and more accurate revenue attribution.
The Schwab 2026 RIA Benchmarking Study — drawing on data from 1,236 independent advisory firms representing over $2.5 trillion under management — found that marketing strategy now separates growth leaders more than market performance (ProFundCom). Firms in the top quartile for growth invest more heavily in data infrastructure and track marketing ROI systematically, while bottom-quartile firms still rely on gut-feel budget allocation.
AI and Machine Learning Adoption in Wealth Management Analytics
The adoption of AI and machine learning tools in wealth management has accelerated dramatically. 83% of wealth management firms are now using or piloting AI tools, most commonly for meeting preparation, client communication drafting, and workflow automation (InvestmentNews). However, the data reveals a significant gap between investment and measurement: 64% of firms increased their AI budgets in 2026, but most admit they cannot yet quantify the ROI of these investments.
The EY GenAI in Wealth and Asset Management survey found that regulatory and compliance complexities surprised 86% of firms implementing AI, with data privacy concerns ranking as the top barrier to broader adoption (EY). For marketing analytics specifically, AI's primary impact is in predictive lead scoring, content personalization, and automated reporting — areas where firms report time savings of 5–10 hours per advisor per week when properly implemented.
Marketing Attribution and ROI Measurement Frameworks
Accurate marketing attribution remains one of the most challenging analytics problems in wealth management. RIA firms using multi-touch attribution models report a 29% year-over-year improvement in attribution accuracy (Gitnux), but the industry still struggles with the long and complex buyer journey typical of high-value financial services. A prospect may interact with unclicked ads, website content, YouTube videos, media articles, and referral conversations before entering the formal lead pipeline (Fast Slow Motion).
The practical measurement framework recommended by Select Advisors Institute connects marketing spend directly to measurable revenue outcomes through four layers: marketing-sourced pipeline, revenue influenced by campaign, MQL-to-SQL-to-Win conversion rates, and campaign ROI by channel (Select Advisors Institute). For advisors building their growth marketing stack, the key KPIs to track include cost per booked appointment by channel, show rate for appointments, CPA per closed client, and first-year revenue per marketing-sourced client (OJay Media).
| Attribution Model | Accuracy Level | Best For | Complexity |
|---|---|---|---|
| Last-Click | Low — misses 60%+ of journey | Basic reporting, small budgets | Simple |
| First-Touch | Low — ignores nurture | Brand awareness campaigns | Simple |
| Multi-Touch Linear | Medium — equal credit | Balanced channel evaluation | Moderate |
| Position-Based (U-Shaped) | High — weights first + last | RIA firms with long sales cycles | Moderate |
| Data-Driven / Algorithmic | Highest — ML-weighted | Firms with 100+ monthly conversions | Advanced |
Device and Channel Performance Analytics
The mobile-desktop divide in wealth management creates a critical analytics challenge. Mobile traffic dominates at 58.2% of total visits, but desktop converts at 4.8% vs. 2.1% on mobile — a 2.3× conversion gap that demands device-segmented tracking and optimization (CuFinder). This gap is larger than most industries and reflects the high-consideration nature of financial advisory services: prospects research on mobile but convert on desktop where they can review documents, fill detailed forms, and schedule calls more comfortably.
Channel-level analytics reveal that email marketing achieves a 36.5% open rate in wealth management — among the highest across all industries — with click-through rates of 2% to 6% for broadly targeted sends and 6% to 12% for hyper-segmented content (Select Advisors Institute). LinkedIn outperforms all other social platforms with a 1.6% engagement rate, making it the most trackable social channel for performance-driven wealth management firms (CuFinder).
Building a Wealth Management Analytics Dashboard
An effective marketing analytics dashboard for wealth management should track metrics across three tiers: activity metrics, pipeline metrics, and revenue metrics. The recommended KPI framework from Select Advisors Institute includes: website sessions by source, lead form submissions, MQL-to-SQL conversion rate, cost per booked appointment, appointment show rate, new client close rate, and first-year revenue per client by acquisition channel (Select Advisors Institute).
For data-driven wealth management firms, the critical dashboard elements include: Google Ads performance (2.64% CTR, $18.84 CPC, $284 CPA), Meta Ads results (0.84% CTR, 2.2× ROAS), email engagement (36.5% open rate), and landing page conversion (3.4% average, 11.5% top performers) (Benchmarketing). Firms that review these dashboards weekly and reallocate budget monthly based on data consistently outperform those on quarterly review cycles.
Email and Social Channel Analytics Performance
Email marketing remains one of the most analytically transparent channels in wealth management. With open rates averaging 36.5%, wealth management firms consistently outperform the all-industry average of approximately 21%. Click-through rates range from 2% to 6% for broadly targeted campaigns, rising to 6% to 12% for hyper-segmented content tailored to specific client personas or life-stage triggers (Select Advisors Institute).
From an analytics perspective, the most valuable email metrics extend beyond open and click rates. Forward rate and reply rate serve as indicators of content resonance, while email-to-meeting conversion rate ties email directly to pipeline value. Firms tracking revenue per email subscriber find that well-maintained lists generate $15 to $55 per subscriber annually in attributed new-client revenue — a metric that justifies continued investment in list hygiene and segmentation tools.
Social media analytics in wealth management center on LinkedIn, which outperforms all other social platforms with a 1.6% engagement rate (CuFinder). The key analytical challenge is connecting social engagement to downstream revenue — a gap that most firms bridge through UTM-tagged links, CRM integration, and self-reported attribution surveys asking new clients how they first heard about the firm.
Conversion Funnel Analytics and Optimization
Wealth management conversion funnels differ from consumer funnels in one critical way: the consideration period spans weeks to months, not minutes. This extended timeline makes accurate analytics essential but technically difficult. The average wealth management funnel progresses through 5–7 touchpoints before a prospect books an initial consultation, and the consultation-to-client close rate averages 25–35% for well-positioned firms (OJay Media).
Funnel-stage analytics reveal where most firms lose prospects. The largest drop-off occurs between website visit and lead-form submission — only 3.4% of visitors convert on average, though top-performing firms achieve 11.5% through optimized forms, clear value propositions, and trust signals (CuFinder). The second-largest drop-off occurs between lead submission and qualified appointment, where firms without automated lead nurture lose 40–60% of potential prospects who go cold during manual follow-up delays.
| Funnel Stage | Benchmark Rate | Top Performer Rate | Primary Tracking Tool |
|---|---|---|---|
| Visit → Lead Form | 3.4% | 11.5% | Google Analytics, heatmaps |
| Lead → Qualified Appt. | 35–45% | 60–70% | CRM lead scoring |
| Appointment → Close | 25–35% | 45–55% | CRM pipeline tracking |
| Overall Visit → Client | 0.3–0.5% | 1.5–3.5% | Multi-touch attribution |
Related reading
- The Complete Wealth Management Attribution & BI Statistics Report (2026)
- What 90+ Data Points Reveal About Dashboards & Reporting for Wealth Management (2026)
- Wealth Management Email Marketing Statistics: Benchmarks & ROI Data (2026)
- Marketing Analytics services at Web Tonic
FAQ
What percentage of wealth management firms use CRM for marketing?
92% of RIA firms have adopted CRM platforms, and 82% actively use CRM for marketing automation — integrating email sequences, lead scoring, and pipeline management into unified workflows. Firms connecting CRM to marketing channels report faster conversion times and more accurate attribution.
How does mobile vs. desktop performance differ in wealth management?
Mobile accounts for 58.2% of traffic but converts at just 2.1%, while desktop converts at 4.8% — a 2.3× gap. This reflects the high-consideration nature of financial advisory services, where prospects research on mobile but prefer desktop for form completion and appointment scheduling.
What is the best attribution model for wealth management marketing?
For most RIA firms, a position-based (U-shaped) attribution model provides the best balance of accuracy and complexity. It weights the first and last touchpoints more heavily while crediting nurture interactions — critical for the typically long wealth management sales cycle. Firms with 100+ monthly conversions should consider data-driven algorithmic models.
Are wealth management firms adopting AI for marketing analytics?
83% of wealth management firms now use or pilot AI tools, with 64% increasing AI budgets in 2026. Primary marketing applications include predictive lead scoring, content personalization, and automated reporting, though most firms cannot yet quantify AI's ROI.
What marketing KPIs should financial advisors track?
Essential KPIs include cost per booked appointment by channel, MQL-to-SQL conversion rate, appointment show rate, new client close rate, and first-year revenue per marketing-sourced client. The most effective wealth management firms track these weekly and reallocate budgets monthly.
Sources
CuFinder — Wealth Management Industry Marketing Benchmarks 2026
Benchmarketing — Wealth Management Fs Marketing Benchmarks 2026
InvestmentNews — AI in Wealth Management Budgets Surge 2026
Gitnux — Marketing in the RIA Industry Statistics 2026
ProFundCom — Schwab's 2026 RIA Benchmarking Study
Select Advisors Institute — Wealth Management Marketing Benchmarks
OJay Media — Marketing KPIs for Financial Advisors 2026
Fast Slow Motion — Marketing Attribution for Financial Services
EY — GenAI in Wealth & Asset Management Survey 2025


