



Table of contents

Prompting action is the top challenge for 40% of B2B teams, ahead of resources and measurement. A scorecard that nobody acts on is a reporting cost, not a management tool. Here is what the 2026 data says about keeping one alive.
Key Takeaways
- Prompting action blocks 40% of B2B teams, the top-ranked challenge.
- Resources block 39% and measurement 33%.
- Quality blocks 28% and differentiation 24%.
- Only 52% of top performers call their governance mature.
- 97% of organisations have a content strategy.
- Martech has fallen to 19.4% of marketing budget from 26.6% in 2021.
- 62% of CMOs still plan to invest more in martech.
- 56% of spend has moved to consumption-based pricing.
- 41% are adding usage controls and 24% overhauling systems.
- Only 9% describe their stack as fully AI-optimised.
- Systems integration self-rates 4.8 out of 7.
- Training self-rates 3.9 and hiring 3.7, the two lowest scores.
- Training has fallen to 3.8% of marketing spend from 5.8%.
- Data architecture blocks 19.1% of teams and bandwidth 14.1%.
- Median CAC payback is 16 months, the strong quartile 10.
Adoption fails at the decision, not the dashboard
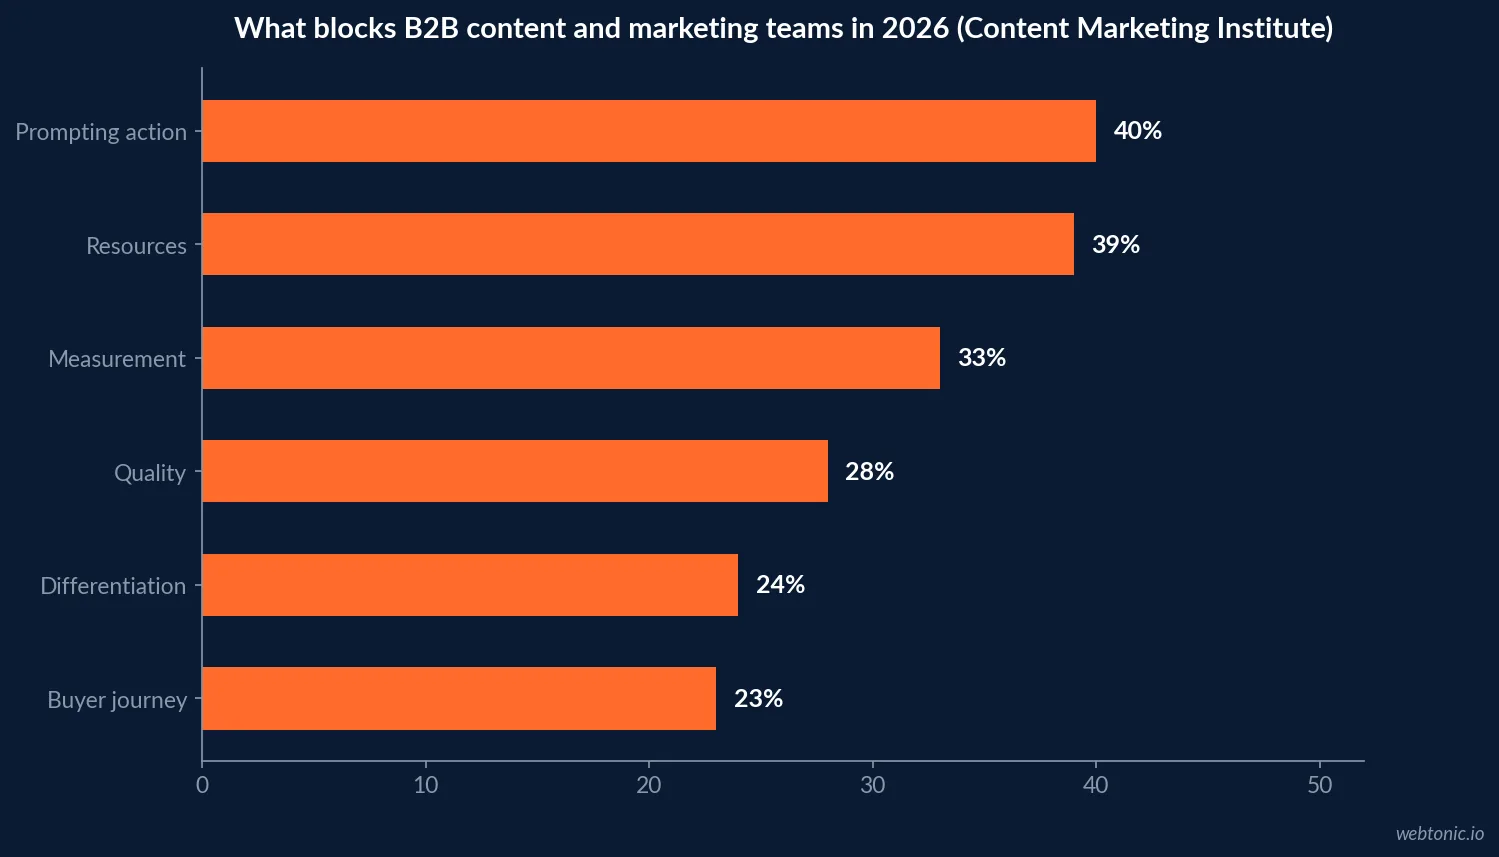
The Content Marketing Institute's 2026 B2B research ranks challenges as prompting action 40%, resources 39%, measurement 33%, quality 28%, differentiation 24%, the buyer journey 23%, collaboration 21%, audience needs 20% and planning 16%, while 97% of organisations have a content strategy and only 52% of top performers call their governance mature.
Strategy exists almost everywhere; governance does not. That gap is where a scorecard either becomes the management instrument or becomes a weekly slide.
The stack is getting a smaller share and a bigger bill
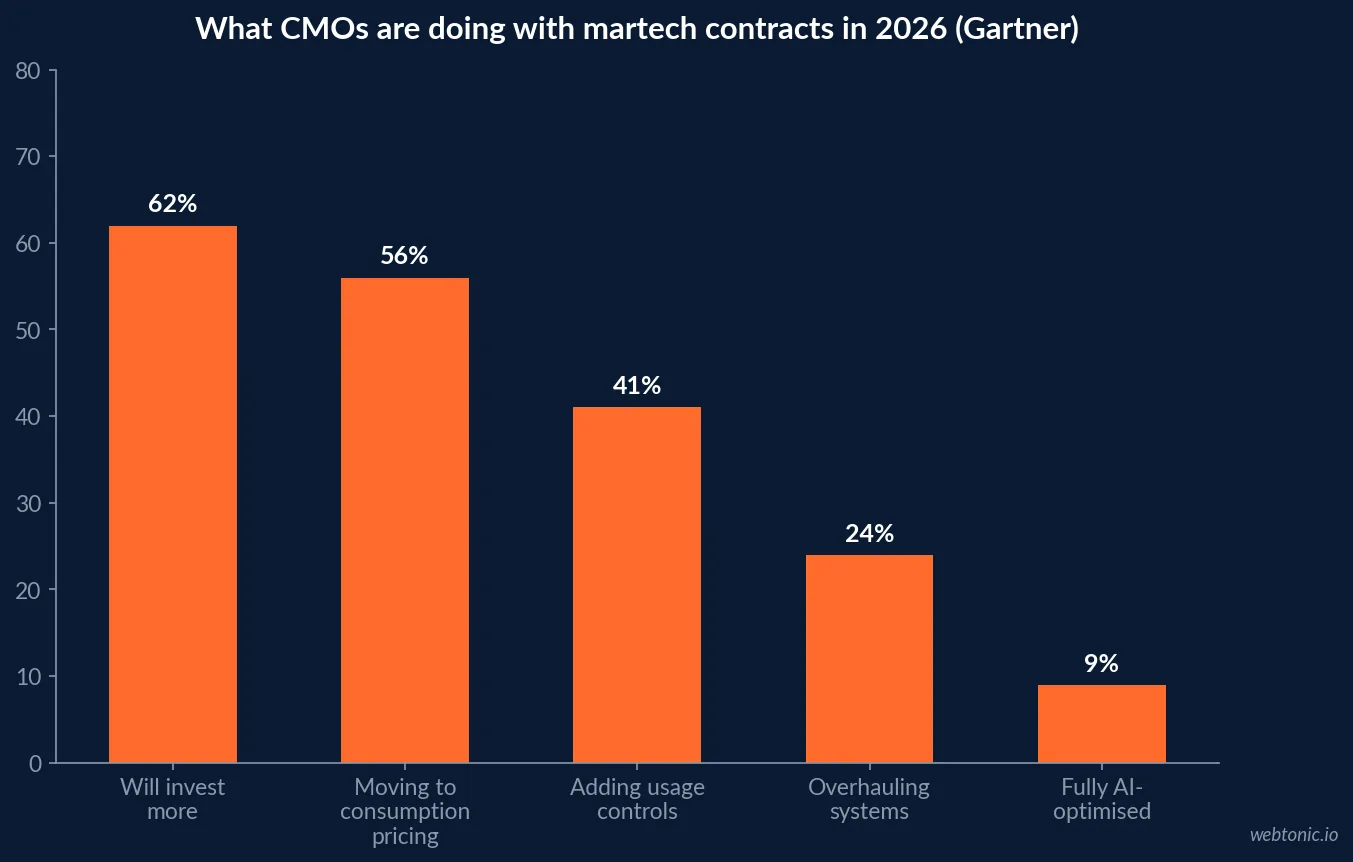
Gartner's 2026 CMO Spend Survey puts martech at 19.4% of marketing budget, a five-year low against 26.6% in 2021, with 62% planning to invest more, 56% of spend on consumption-based pricing against 9% cutting, 41% adding usage controls, 24% overhauling systems and only 9% describing their stack as fully AI-optimised.
For reporting specifically this is a live cost risk. Wider adoption means more refreshes, and on a consumption contract more refreshes means a larger invoice at the exact moment the scorecard starts working.
| Martech signal | 2026 figure | Consequence for a scorecard |
|---|---|---|
| Share of marketing budget | 19.4% (26.6% in 2021) | No new tool without a switch-off |
| Planning to invest more | 62% | Budget exists, but it is contested |
| Consumption-based pricing | 56% of spend | Adoption growth raises the bill |
| Adding usage controls | 41% | Cap queries before you widen access |
| Overhauling systems | 24% | Expect a data-source change mid-year |
| Fully AI-optimised stacks | 9% | Automation claims need evidence |
Integration, not features, is the constraint
The CMO Survey 2026 asks marketers to self-rate from 1 to 7: vendor selection 4.9, tactical use of data 4.8, systems integration 4.8, generating technology ROI 4.5, demonstrating that ROI 4.2, training 3.9 and hiring 3.7. Nothing scores above 5, and the scores are flat against 2024.
Buying another tool cannot lift a 4.8 on integration or a 3.9 on training. Those two numbers explain most failed rollouts better than any product comparison does.
| Capability | Self-rating out of 7 | Adoption consequence |
|---|---|---|
| Selecting vendors | 4.9 | Tool choice is not the bottleneck |
| Using data tactically | 4.8 | Numbers arrive, but late |
| Integrating systems | 4.8 | Reconciliation eats the review slot |
| Generating technology ROI | 4.5 | Value claimed, not demonstrated |
| Demonstrating that ROI | 4.2 | The disputed line every quarter |
| Training people | 3.9 | Owners cannot maintain their own metric |
Training was cut exactly when it was needed
The CMO Survey shows training down to 3.8% of marketing spend from 5.8%, headcount growth down 50% year on year and overall spend growth of 1.7%. Barriers to progress are ranked AI knowledge and skill gaps 35.7%, resourcing 22.3%, data architecture 19.1%, team bandwidth 14.1% and talent availability 13.1%.
A scorecard rollout with no training line is a rollout that depends on one person. When that person moves, adoption goes with them, and the board reverts to whatever the reporting tool produces by default.
Cadence is the cheapest adoption mechanism
A fixed weekly meeting with a short board, one owner per line and an explicit issues list costs nothing in licences. EOS Worldwide cites TrueSpace and Gallup-validated analysis of 305 companies finding firms running EOS with a professional implementer grew 2.8 times faster. That is vendor research and should be read as directional support for cadence, not as proof one framework beats another.
The defensible version of the claim is narrow: cadence is cheap, and the measurement weaknesses in the survey data above are structural problems that a weekly review with named owners addresses better than software does.
Give the board one efficiency anchor
Benchmarkit's CY-2025 benchmarks report a median CAC payback of 16 months, improved from 18, with the strong quartile at 10 months, the weak quartile at 24 and top performers at six months or less. The fastest-growing companies recover CAC in 10 months against 18.
One slow-moving efficiency number keeps a weekly board honest. It cannot be improved by reporting differently, which is exactly why it belongs there.
| Adoption test | How to check it | 2026 comparator |
|---|---|---|
| Every line has one owner | Ask who explains the movement | Training self-rates 3.9 of 7 |
| Every line triggers a decision | Two-quarter decision log | Prompting action blocks 40% |
| Definitions are frozen | Change requests per quarter | Only 52% call governance mature |
| Tool usage is capped | Query volume against the cap | 56% on consumption pricing |
| Something gets switched off | Quarterly licence review | Martech at 19.4% of budget |
| One efficiency anchor is present | Payback on the monthly board | 16-month median payback |

What to switch off first
Any dashboard nobody has opened in a quarter, any duplicate source of the same metric, and any licence whose owner has left. With martech at 19.4% of budget and 41% of organisations adding usage controls, the switch-off list is how a scorecard programme funds itself instead of asking for new money against 1.7% spend growth.
That review is also the cheapest place to find reporting errors, because a duplicate source is usually the reason two people quote two numbers - the same discipline we apply in our data intelligence work.
The adoption scorecard for the scorecard
Six checks: one owner per line, a decision per line, frozen definitions, a usage cap, a quarterly switch-off list and one efficiency anchor at the 16-month payback median. Fail two of them and the board is decoration, whatever the tooling cost.
If you want the checks run against your own reporting stack, our growth team can do it in a week, or send us your current reporting pack. Our channel strategy guidance follows the same rule: no metric without a decision.
Governance shows up in the growth data
Hinge's 2026 High Growth Study reports median growth of 9.9%, the lowest since 2018, with high growth at 36.6%, average at 8.5% and no growth at -11.4% and profitability at 39.5%, 29.6% and 20.3%. High-growth firms spend 12.0% of revenue on marketing against 5.0%, and 80% of firms run research - competitive 46.1%, client 45.2% - while 20% run none.
Comparing a board against a single market average hides which tier you are in. Carrying all three tiers turns the same table from a status report into a decision about which behaviour to copy.
| Comparator on the board | 2026 figure | Cadence |
|---|---|---|
| Growth against tier | 36.6% / 8.5% / -11.4% | Quarterly |
| Profitability against tier | 39.5% / 29.6% / 20.3% | Quarterly |
| Marketing spend of revenue | 12.0% high growth vs 5.0% | Quarterly |
| Research coverage | 80% run research, 20% none | Quarterly |
| Keyword and SEO research | Fell from 33.5% to 27.0% | Quarterly |
The short-termism a weekly board amplifies
The CMO Survey puts spending at a 68/32 split between present and future needs, with 70.6% reporting a shift toward short-term results, 71% calling agility key and 47.1% describing their approach as established. Growth spend concentrates in market penetration at 56.4%, product development 22.9% and new markets 14.1%.
A weekly cadence amplifies whatever it measures. If every line has a one-week horizon, the meeting will keep choosing one-week actions, which is how a company arrives at a 68/32 split without ever deciding on it. One quarterly line on the same board is the cheapest counterweight.
Access is not adoption
The Content Marketing Institute's 2026 research shows how thought leadership is measured - engagement 80%, business impact 63%, audience feedback 40% and brand authority 38%. The gap between engagement at 80% and business impact at 63% is the vanity-metric problem stated numerically: the easy number is reported more often than the consequential one.
Giving more people access to a dashboard does not close that gap. Pairing every engagement number with an outcome number does, and it costs one column.
| Reported metric | Share of teams | Pair it with |
|---|---|---|
| Engagement | 80% | Pipeline or revenue influenced |
| Business impact | 63% | Its own definition, frozen |
| Audience feedback | 40% | A decision on what changes next |
| Brand authority | 38% | A search or citation measure |
Related reading
- AI Marketing Advisory Statistics: Adoption and Tooling
- Growth Consulting Statistics: Adoption and Tooling in 2026
- Marketing Strategy Consulting Statistics: Adoption and Tooling
- Marketing Strategy Consulting services at Web Tonic
Frequently Asked Questions
Why do marketing scorecards stop being used?
Because reading a number is not the same as acting on it. The Content Marketing Institute's 2026 B2B research ranks prompting action as the top challenge at 40%, ahead of resources at 39% and measurement at 33%, and only 52% of top performers call their governance mature. A board with no decision attached to a line will be read for two quarters and then skipped.
What tooling does a marketing scorecard actually need?
Less than most stacks already contain. Gartner's 2026 CMO Spend Survey puts martech at 19.4% of marketing budget, a five-year low against 26.6% in 2021, while 62% of CMOs plan to invest more and 24% are overhauling systems. The CMO Survey 2026 has systems integration self-rated at 4.8 out of 7, which is the real constraint rather than a missing tool.
Is consumption-based pricing a risk for reporting tools?
It is the risk to plan for. Gartner reports 56% of martech spend moving to consumption-based pricing against 9% of CMOs cutting spend, with 41% adding usage controls. A dashboard that queries a usage-metered warehouse on every refresh converts an adoption success into an unpredictable bill, so cap and review before you widen access.
How much training does a scorecard rollout need?
More than most budgets allow for. The CMO Survey 2026 shows training falling to 3.8% of marketing spend from 5.8%, with training capability self-rated at 3.9 out of 7 and hiring at 3.7 - the two lowest scores measured. If owners cannot maintain their own metric without help, adoption fails regardless of tooling quality.
What proves a scorecard is being adopted?
Decisions, not logins. A workable test is whether every line changed at least one decision in the last two quarters, whether each has one named owner, and whether disputed definitions are frozen rather than debated weekly. With measurement a challenge for 33% of organisations, definition stability is the leading indicator of adoption.
Sources
Content Marketing Institute - B2B Content Marketing Trends 2026
Gartner 2026 CMO Spend Survey via Chief Marketer
The CMO Survey - Highlights and Insights Report 2026
EOS Worldwide - EOS with a professional implementer grew 2.8x faster
Benchmarkit - CY-2025 B2B SaaS Performance Metrics Benchmarks
Hinge Research Institute - 2026 High Growth Study


