



Table of contents

Wealth management firms spend between $3 and $15 per click on paid channels while battling strict compliance rules that limit creative freedom — yet the firms that invest in data-driven ad creative consistently outperform those relying on generic brand messaging. Below are the benchmarks, channel-level breakdowns, and creative performance data every financial advisor marketing team should know in 2026.
Key Takeaways
- Search ads deliver a 5.10% CTR in wealth management — the highest of any paid format (CuFinder).
- Display ads average a 0.55% CTR, but serve a critical awareness and retargeting role in the high-consideration advisory funnel (CuFinder).
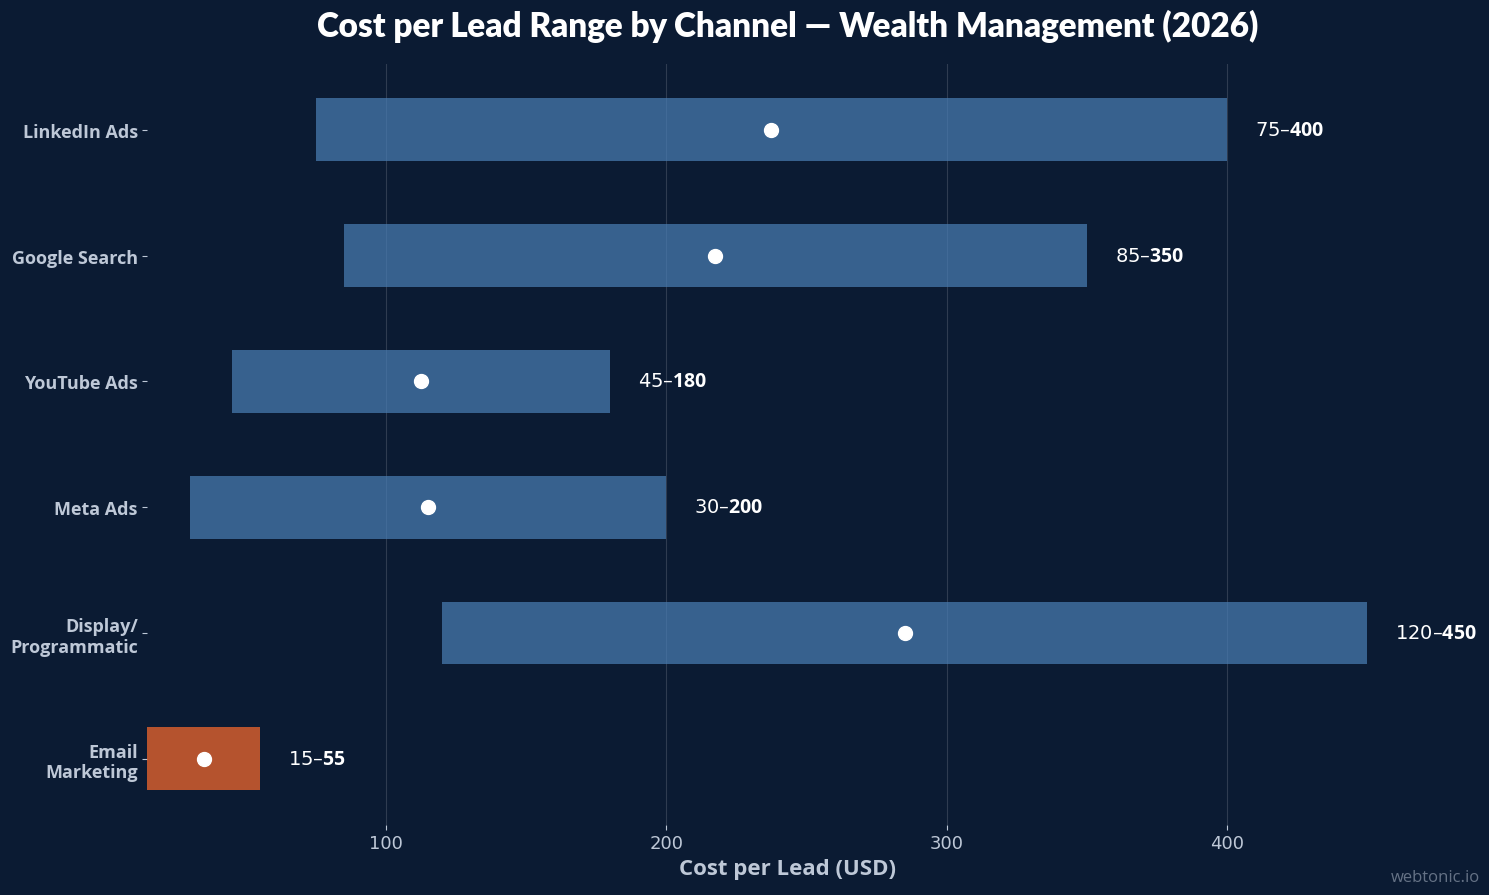
- LinkedIn CPL ranges from $75 to $400, while Meta Ads CPL sits between $30 and $200 for wealth management lead capture (Select Advisors Institute).
- Google Ads CPC in wealth management averages $18.84 with a 3.2% conversion rate (Benchmarketing).
- Video ads achieve up to 1.80% CTR on YouTube pre-roll, outperforming display by 3.3× (OJay Media).
- Only 4% of financial services brands run a high variety of distinct ad creatives (Ad Library).
- Meta Ads CTR for wealth management sits at 0.84% with a 2.2× ROAS (Benchmarketing).
Wealth Management Ad Creative Benchmarks at a Glance
| Metric | Benchmark | Source |
|---|---|---|
| Search Ads CTR | 5.10% | CuFinder 2026 |
| Display Ads CTR | 0.55% | CuFinder 2026 |
| Google Ads CPC | $18.84 | Benchmarketing 2026 |
| Google Ads CVR | 3.2% | Benchmarketing 2026 |
| Google Ads CPA | $284.00 | Benchmarketing 2026 |
| Meta Ads CTR | 0.84% | Benchmarketing 2026 |
| Meta Ads ROAS | 2.2× | Benchmarketing 2026 |
| LinkedIn CPL | $75–$400 | Select Advisors Institute |
| Meta Ads CPL | $30–$200 | Select Advisors Institute |
| LinkedIn CTR | 0.2%–1.5% | Select Advisors Institute |

Search Ad Creative Performance in Wealth Management
Search advertising remains the highest-intent channel for wealth management firms. Google Ads delivers a 2.64% CTR across all financial planning search campaigns, but wealth-management-specific keywords push CTR up to 5.10% when ads are tightly matched to high-intent queries like "financial advisor near me" or "wealth management firm" (CuFinder). The average cost per click sits at $18.84, with competitive terms like "wealth management" and "estate planning" frequently exceeding $20 per click (Benchmarketing).
Despite higher CPCs, conversion rates hold at 3.2% and the average CPA is $284 — a figure that many RIA firms consider acceptable given typical client lifetime values exceeding $25,000 (Benchmarketing). Ad copy that includes specific credentials (CFP, CFA), fiduciary language, and localized value propositions consistently outperforms generic "grow your wealth" messaging. Top-performing Google Ads campaigns incorporate sitelink extensions and callout extensions mentioning fee transparency and AUM thresholds.
Social Media Ad Creative Benchmarks for Financial Advisors
Social media advertising for wealth management follows a distinct pattern: LinkedIn produces the most qualified leads but at the highest cost, while Meta platforms deliver volume at lower CPL. LinkedIn sponsored content generates a CTR between 0.2% and 1.5% depending on creative format and targeting, with CPL ranging from $75 to $400 (Select Advisors Institute). Facebook and Instagram ads achieve CTR of 0.5% to 2.0% with CPL of $30 to $200 for lead capture forms.
The creative gap in financial services is significant. Only 4% of financial brands run a high variety of distinct ad creatives, meaning most firms cycle the same 3–5 ads indefinitely (Ad Library). Firms that diversify their creative approach — mixing educational carousels, client testimonial videos, and market-commentary posts — see 20–40% lower CPL compared to single-format advertisers. Meta Ads deliver a 2.2× ROAS for wealth management when creative includes social proof, specific outcomes, and compliance-cleared testimonials (Benchmarketing).
| Platform | CTR Range | CPL Range | Best Creative Format |
|---|---|---|---|
| 0.2%–1.5% | $75–$400 | Thought leadership articles, carousel case studies | |
| 0.5%–2.0% | $30–$200 | Video testimonials, educational reels | |
| 0.5%–2.0% | $30–$200 | Carousel infographics, stories with polls | |
| YouTube | 1.2%–1.8% | $45–$180 | Pre-roll explainer, long-form education |
Video Ad Creative Performance for Wealth Management Firms
Video advertising has become a critical channel for wealth management firms seeking to build trust before the first meeting. YouTube pre-roll ads achieve a CTR of up to 1.80% — more than 3× the performance of standard display ads (OJay Media). For firms running YouTube Ads, a closed-client CPA under $2,500 is considered profitable when average first-year client revenue exceeds $5,000 (OJay Media).
The most effective wealth management video ads follow a specific structure: hook within the first 3 seconds (market data or provocative question), credibility at 5–10 seconds (credentials, AUM, client count), and a clear CTA by 15 seconds for skippable formats. Financial services video creative that includes verifiable statistics — such as "12,000 clients saved an average of 18% on monthly premiums" — builds measurably higher credibility with comparison-shopping prospects (Levitate Media). Short-form video (under 60 seconds) drives reach and 3-second plays, while long-form educational content (3–8 minutes) generates higher appointment booking rates.
Display and Programmatic Ad Benchmarks
Display advertising in wealth management serves primarily as an awareness and retargeting vehicle rather than a direct-response channel. The average display CTR is 0.55%, which sits above the all-industry average but below search and social channels (CuFinder). Programmatic display CTR ranges from 0.05% to 0.30% for upper-funnel awareness campaigns, with CPL highly variable depending on targeting precision (Select Advisors Institute).
The key creative insight for display is that not every impression needs to generate a click. Display ads function within a longer consideration cycle where a prospect may see 7–12 touchpoints before booking a consultation. Retargeting display campaigns using dynamic creative that references the specific service page a prospect visited (retirement planning, tax optimization, estate planning) achieve 2–3× higher CTR than generic brand display. Wealth management firms investing in strategic programmatic buying report stronger brand recall and shorter sales cycles when display is layered with search and social.
Creative Format Performance by Audience Segment
The performance of wealth management ad creative varies dramatically depending on the target audience segment. High-net-worth individuals (HNWIs) respond best to educational and authority-driven content, while mass-affluent prospects engage more with lifestyle and aspirational creative. For HNW targeting on LinkedIn, long-form thought leadership ads achieve 2× the engagement rate of standard promotional posts, driven by the audience's preference for substantive analysis over marketing messages.
Advisors targeting pre-retirees (ages 55–70) see the highest conversion rates from search ads — this segment actively searches for retirement planning solutions and responds to specificity in ad copy. Younger wealth accumulators (ages 35–50) favor video content and social proof, with Instagram and YouTube outperforming search for initial awareness. The data highlights a clear pattern: the closer the prospect is to a financial decision point, the more effective direct-response creative becomes. For top-of-funnel campaigns targeting younger demographics, short-form video (under 30 seconds) with clear financial insights generates 3× the completion rate of generic brand awareness spots.
| Audience Segment | Top Channel | Best Creative Type | Avg. Engagement Lift |
|---|---|---|---|
| HNW ($1M+ AUM) | Thought leadership, white papers | +45% vs. standard | |
| Mass Affluent ($250K–$1M) | Meta Ads | Client success stories, video | +30% vs. standard |
| Pre-Retirees (55–70) | Google Search | Specific-outcome search copy | +55% conversion rate |
| Young Accumulators (35–50) | YouTube / Instagram | Short-form educational video | +38% view completion |
Return on Ad Spend and Budget Allocation Trends
Wealth management firms allocate between 1.5% and 3% of revenue to marketing, with advertising creative production and media spend consuming the largest share. Google Ads delivers a CPA of $284 in wealth management — a cost that translates to a strong ROI when measured against the average first-year client revenue of $5,000 to $15,000 and lifetime values often exceeding $50,000 (Benchmarketing).
Budget allocation trends show a clear shift toward video and social ad formats. In 2026, top-performing RIA firms invest 25–35% of their ad budget in video creative, compared to less than 10% in 2022. This shift reflects the higher trust transfer rate of video — prospects who watch an advisor's educational video before booking a consultation show up to 40% higher conversion-to-client rates than those arriving through text-only search ads. The most efficient budget split for mid-size wealth management firms typically follows a 40/30/20/10 model: 40% search, 30% social (LinkedIn + Meta), 20% video/YouTube, and 10% display retargeting.
Ad Creative Compliance and Regulatory Constraints
Wealth management advertising operates under stricter compliance requirements than most industries, directly impacting creative production timelines and format choices. The SEC Marketing Rule governs how RIAs can use testimonials, endorsements, and performance claims in advertising, requiring specific disclosures and compliance review before any creative goes live (Vidico).
These constraints create both challenges and opportunities. Firms that build pre-approved creative templates — with compliance-cleared copy blocks, disclosures, and imagery — can reduce production time by 40–60% while maintaining regulatory adherence. The financial services brands that outperform do so not despite compliance but because of it: specificity required by regulators (exact client counts, verifiable returns, documented outcomes) also builds higher trust with prospects. Creative that leans into transparency — fee structures, fiduciary commitments, and credential verification — consistently produces higher engagement and lower bounce rates than vague aspirational messaging.
| Creative Element | Impact on Performance | Compliance Consideration |
|---|---|---|
| Client testimonials | +35% engagement | SEC Marketing Rule requires disclosures |
| Performance claims | +25% CTR when specific | Must show net-of-fee returns with disclaimers |
| Credential badges (CFP, CFA) | +18% trust signals | Must be current and verifiable |
| Fee transparency | +22% conversion rate | Align with ADV Part 2 disclosures |
| AUM references | +15% qualified leads | Must reflect current audited figures |
Ad Creative Testing and Optimization Strategies
Wealth management firms that systematically test ad creative see 20–40% improvement in CPL within the first 90 days compared to firms running static campaigns. The recommended testing cadence involves refreshing 2–3 creative variants every 4–6 weeks to combat fatigue — particularly important in wealth management where audience pools are smaller and frequency caps are reached faster.
Effective testing follows a structured approach: test hooks first (headline and opening frame), then proof devices (social proof, data, credentials), then CTA variations. Financial advisor campaigns that A/B test one element at a time produce cleaner data and faster optimization cycles (Get X Media). For Meta Ads, the top creative patterns in financial services include problem-agitation-solution frameworks, statistical authority hooks, and before-after comparison formats (Ad Library).
Related reading
- Dental Ad Creative Statistics & Data 2026
- Fitness Ad Creative Statistics: UGC, Video & Testing Benchmarks (2026)
- HVAC Ad Creative Stats (2026)
- Branding services at Web Tonic
FAQ
What is the average CTR for wealth management ads?
Search ads in wealth management achieve an average CTR of 5.10%, significantly higher than display ads at 0.55%. Social platforms vary widely: LinkedIn ranges from 0.2% to 1.5%, while Meta platforms average 0.5% to 2.0% depending on creative quality and targeting.
How much do wealth management firms spend per lead on advertising?
LinkedIn leads cost $75–$400, making it the most expensive but often the highest-quality channel for RIAs. Meta Ads generate leads at $30–$200, and Google Search produces leads at approximately $85–$350 based on keyword competitiveness and geographic targeting.
What types of ad creative work best for financial advisors?
The highest-performing ad creative for wealth management includes video testimonials, data-driven educational content, and credential-forward messaging. Firms using social proof with specific outcomes and compliance-cleared performance data consistently outperform generic aspirational ads by 20–40% on CPL.
How often should wealth management firms refresh their ad creative?
Refresh creative every 4–6 weeks with 2–3 new variants. Wealth management audiences are typically smaller than consumer segments, meaning ad fatigue sets in faster. Testing hooks, proof devices, and CTAs sequentially produces the clearest performance data.
Do video ads outperform static ads in wealth management?
Yes — YouTube pre-roll ads achieve up to 1.80% CTR, more than 3× the performance of standard display ads. Short-form video drives awareness and reach, while long-form educational video (3–8 minutes) produces higher appointment booking rates and stronger trust signals with high-net-worth prospects.
Sources
CuFinder — Wealth Management Industry Marketing Benchmarks 2026
Benchmarketing — Wealth Management Fs Marketing Benchmarks 2026
Select Advisors Institute — Wealth Management Marketing Benchmarks
OJay Media — Video Marketing for Financial Advisors 2026
Ad Library — Best Financial Ads 2026 Creative Breakdowns
Vidico — Fintech Ads Best Practices for Visual Creative 2026
Levitate Media — Financial Services Video Advertising Strategy
Get X Media — Financial Advisor Marketing Benchmarks 2026


