Table of contents

The average water damage restoration website takes 9.91 seconds to render its main content while its server answers in 0.07 seconds. Hold those two numbers next to each other, because they settle the argument before it starts: restoration hosting is fine, and the entire Core Web Vitals failure in this industry is front-end weight. That matters more here than in almost any trade, because 85 to 90% of emergency-intent contractor traffic is on a phone and the person searching is standing in water. This is the 2026 technical SEO data for water damage restoration sites - real crawl numbers, the lead cost of the delay, and the fix order that closes it.
Key Takeaways
- Audited restoration sites average LCP 9.91s against a 2.50s threshold and FCP 3.75s against 1.80s - but TTFB 0.07s against 0.80s.
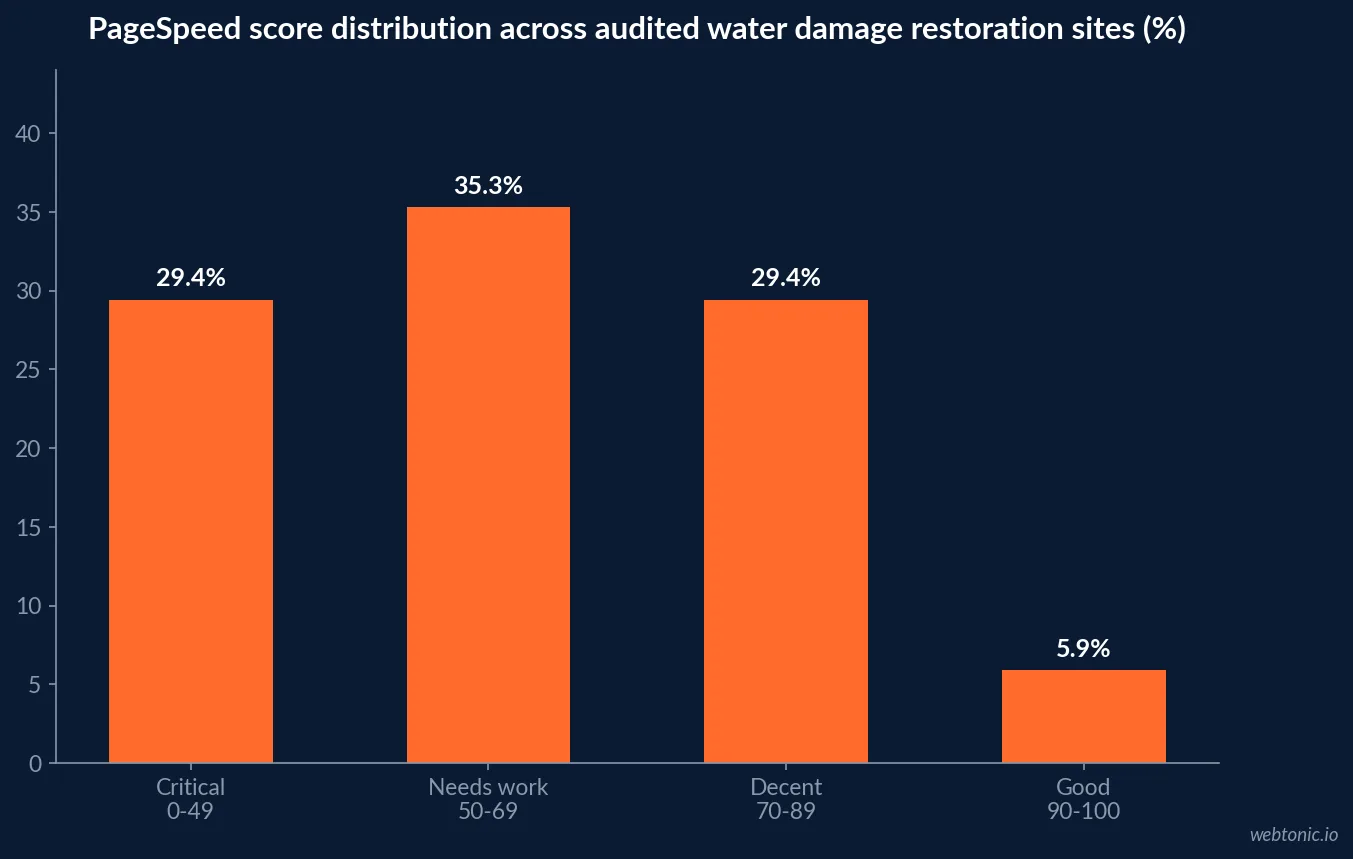
- 65% of restoration sites score below 70 on PageSpeed; only 5.9% reach 90+, and the sample average is 59/100.
- 81.3% of sites have main content rendering too slowly; 50% have duplicate title tags, 43.8% have no sitemap and 37.5% no robots.txt.
- Every second of mobile delay costs roughly 7% of conversions; a 5-second site loses about 35% of leads versus a 1.8-second one.
- Sites loading under 2.5s averaged 6.8% conversion in a 200-contractor study, against a 2-4% median.
- 87% of top-converting contractor sites run a sticky tap-to-call button, worth 25-40% more phone calls at the same traffic.
- "Water damage restoration" alone draws 49,500 US searches a month while emergency clicks cost USD 100-180 - the arbitrage that funds technical work.
Core Web Vitals: where restoration sites actually fail
The figures below come from full diagnostic crawls of US water damage restoration websites refreshed in July 2026 by Borah Labs. It is a small, production-site sample rather than a census, so read it as directional - but the shape of the failure is unmistakable and matches what we see in client audits.
| Metric | Restoration average | Google threshold | Verdict |
|---|---|---|---|
| Largest Contentful Paint | 9.91s | 2.50s | Fails by 7.4s |
| First Contentful Paint | 3.75s | 1.80s | Fails by ~2s |
| Cumulative Layout Shift | 0.02 | 0.10 | Passes comfortably |
| Time to First Byte | 0.07s | 0.80s | Excellent |
| PageSpeed score | 59/100 | 90+ good | Needs work |
| SSL adoption | 87.5% | 100% | 2 in 16 sites exposed |
A passing CLS and a near-instant TTFB alongside a ten-second LCP is a specific diagnosis, not a vague one. The layout is stable and the server is quick; the browser is simply waiting on assets. That is images, page-builder CSS and JavaScript, and third-party widgets - all of which are fixable without touching your host or your CMS.
The performance spread hides no heroes
Industry averages usually conceal a few excellent outliers dragging the mean up. Here they do not. 29.4% of restoration sites score in the critical 0-49 band, another 35.3% land in 50-69, 29.4% are decent at 70-89 and only 5.9% are good at 90-100. Two thirds of the market is below 70. For a competitive local operator, that is the cheapest edge available in the vertical: passing Core Web Vitals is currently a differentiator rather than table stakes.
Crawl and index hygiene gaps
Speed dominates the conversation, but the boring crawl-layer misses are what quietly cap rankings. Ranked by frequency across audited restoration sites:
| Issue | Share of sites affected | Impact | Effort to fix |
|---|---|---|---|
| Main content renders too slowly | 81.3% | High | Days |
| Two or more pages share a title tag | 50.0% | Medium | Hours |
| No sitemap.xml found | 43.8% | High | Under an hour |
| No robots.txt found | 37.5% | High | Minutes |
| Broken internal links | 31.3% | Medium | Hours |
| Missing meta description | 31.2% | Medium | Hours |
| No Open Graph tags | 31.2% | Low | Hours |
| No canonical tag | 18.7% | Medium | Hours |
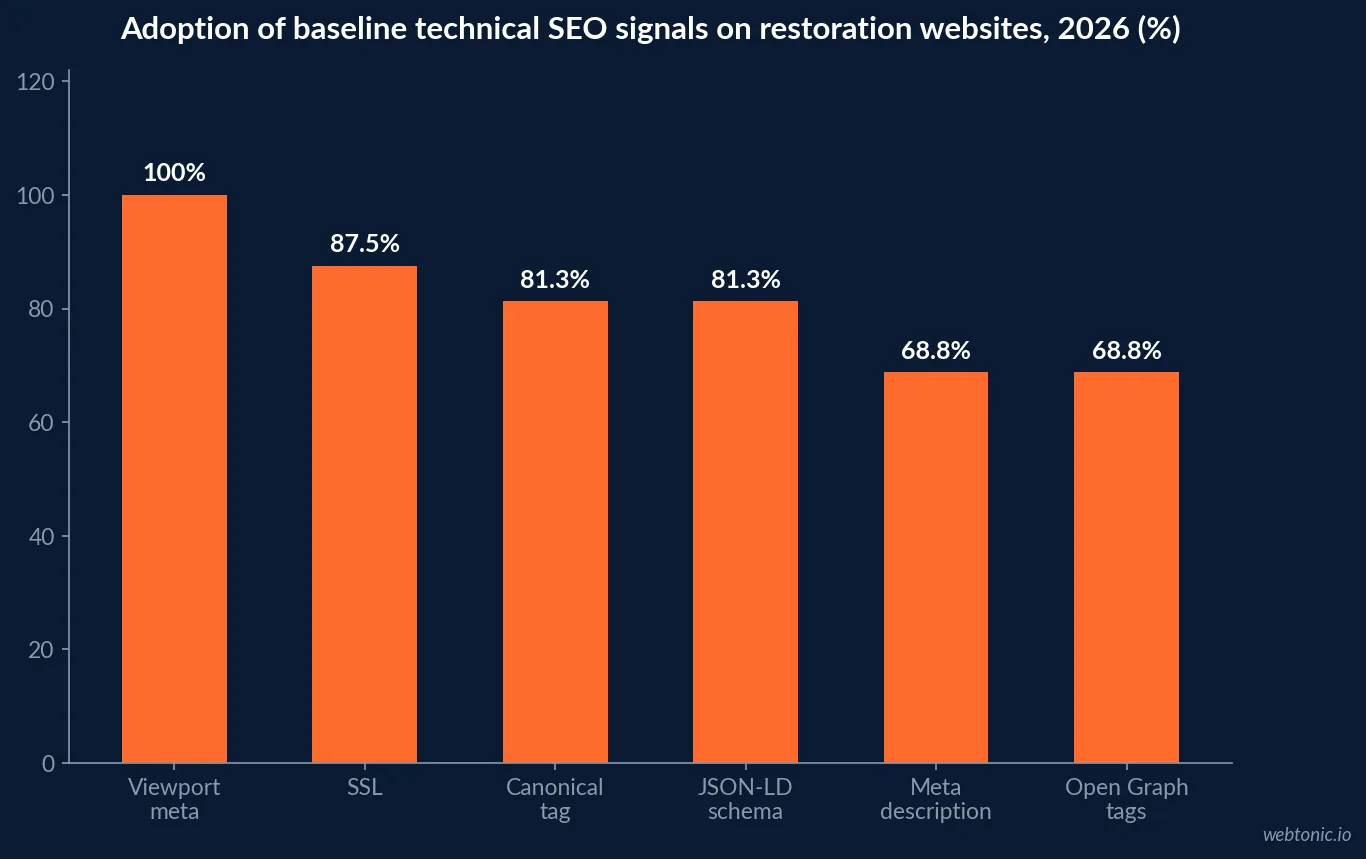
Adoption of the positive signals is the same story from the other side: viewport meta at 100%, canonical tags and JSON-LD schema both at 81.3%, meta descriptions and Open Graph tags at 68.8%, SSL at 87.5%. Nothing on that list requires a rebuild, a migration or a content strategy. It requires an afternoon and a checklist.
What the delay costs in leads and in ad spend
Technical SEO gets funded when it is priced in jobs. The elasticity numbers are consistent across sources: every additional second of mobile delay drops conversion roughly 7%, 53% of mobile visitors abandon a page slower than three seconds, and a five-second site loses about 35% of its leads against a 1.8-second site at identical traffic, per PipelineOn's 2026 contractor speed analysis.
| Scenario | Load time | Conversion rate | Leads from 4,000 sessions |
|---|---|---|---|
| Typical restoration site | 5.0s | 3.3% | ~130 |
| Tuned site | 1.8s | 5.0% | ~200 |
| Sub-2.5s contractor cohort | Under 2.5s | 6.8% | ~272 |
| Median contractor site | Varies | 2-4% | 80-160 |
| Top-quartile home-services page | Varies | 17.6% | Landing pages only |
The paid-media consequence is sharper. On a USD 4,000 monthly Google Ads budget, the same speed gap wastes roughly USD 1,400 a month in clicks that bounce before render. Restoration buys some of the most expensive clicks in local search - USD 100 to USD 180 on emergency terms - so a slow landing page is not a technical debt item, it is a monthly invoice. Our home-services landing page benchmarks break the conversion side down further.
Mobile and the tap-to-call layer
Restoration traffic is more mobile than nearly any other trade. 71 to 76% of contractor visitors arrive on a phone, rising to 85-90% on emergency intent, and in a study of 200 contractor websites across six trades including restoration, 94% of top-performing sites (8%+ conversion) passed Google's mobile-friendly test against only 31% of sites converting under 3%, per Onward Craft's 27-element conversion analysis.
- 87% of top-performing sites use a persistent sticky tap-to-call button, associated with 25-40% more phone calls at unchanged traffic.
- 91% of high-converting sites show a clickable phone number in the header on every page; 43% of low performers hide it or leave it unclickable.
- Phone leads convert at ~46% - the highest-converting channel in home services, which is why call handling belongs in the technical scope.
- Replace live Google Maps iframes with static images and lazy-load chat and review widgets; these are the two most common LCP offenders on restoration templates.
Schema, entities and the AI answer layer
With 81.3% of restoration sites already publishing JSON-LD, having schema is no longer the win - completeness is. The fields that matter for a 24/7 emergency service are the ones most often left empty: openingHoursSpecification covering round-the-clock availability, areaServed for each municipality you actually cover, hasOfferCatalog for water mitigation, mold remediation and reconstruction as distinct services, and FAQPage on the insurance and claims content that captures the 3,600 monthly searches for "does homeowners insurance cover water damage". Those same fields feed AI answer engines, which resolve "who to call for water damage" without a click more often each quarter.
The keyword and traffic case for fixing the technical layer
The demand is not in question. "Water damage restoration" alone draws 49,500 US searches a month, and the surrounding intent set is enormous: burst pipe repair near me at 2,400, flooded basement help at 1,900, sewage backup cleanup at 1,600, per PushLeads' restoration keyword dataset. Search volume also spikes 3 to 5 times baseline in markets hit by weather events - and a site that fails Core Web Vitals cannot absorb a 5x traffic spike without collapsing conversion exactly when it matters.
| Search term | US monthly searches | Paid CPC | Technical priority it implies |
|---|---|---|---|
| water damage restoration | 49,500 | High | Service page speed and schema |
| does homeowners insurance cover water damage | 3,600 | USD 8 | FAQPage markup, fast content page |
| burst pipe repair near me | 2,400 | USD 28 | Local landing page, tap-to-call |
| water damage insurance claim | 2,400 | USD 16 | Claims hub, internal linking |
| flooded basement help | 1,900 | USD 26 | Emergency page, mobile LCP |
| sewage backup cleanup | 1,600 | USD 38 | Dedicated service page, Service schema |
Meanwhile 71% of restoration companies have no local SEO strategy and 64% have not touched their Google Business Profile in six months or more, in a market where regional and local firms handle 73% of the work. The competitive floor is low. Our restoration local SEO benchmarks and technical SEO data from an adjacent trade show how consistent this pattern is across home services.
The fix order that produces most of the lift
Sequence matters, because the first three items usually deliver the majority of the gain and cost under USD 100 a year in tooling on a WordPress build - which is what roughly half of the audited restoration sites run.
| Step | Action | Typical effect | Time |
|---|---|---|---|
| 1 | Compress hero images to under 200KB in WebP | LCP down 40-60% | 2-3 hours |
| 2 | Strip page-builder bloat and unused CSS | LCP down 1-2s | 1 day |
| 3 | Defer non-critical JS, lazy-load widgets | FCP down ~1s | Half a day |
| 4 | Route through a CDN, enable caching | TTFB and repeat views | 1 hour |
| 5 | Publish sitemap.xml and robots.txt | Crawl coverage | 1 hour |
| 6 | De-duplicate title tags, fix broken links | Index clarity | 3-4 hours |
| 7 | Complete LocalBusiness, Service and FAQ schema | Rich results, AI citations | 1 day |
| 8 | Add sticky tap-to-call and header phone | 25-40% more calls | 2 hours |
A five or six-second WordPress restoration site can realistically reach under two seconds in a weekend with image compression, a caching plugin and a CDN. A rebuild only wins when the template itself is the constraint - typically a builder-heavy theme with 30+ plugins where every fix fights the stack. If you want that call made on evidence rather than instinct, our data intelligence team audits the render path against lead volume, not just against a score.
Frequently Asked Questions
How fast should a water damage restoration website load?
Google's Largest Contentful Paint threshold is 2.5 seconds on mobile, and anything over 4 seconds is classed as Poor. Audited restoration sites average 9.91 seconds - 7.4 seconds past the passing mark - while 53% of mobile visitors abandon a page that takes longer than three seconds. Because 71 to 76% of contractor traffic is mobile and emergency-intent traffic climbs to 85 to 90%, the homeowner standing in a flooded basement is the exact visitor your slowest render loses. Target under 2.5 seconds on a 4G connection, not on your office fibre.
Why is Time to First Byte good but LCP terrible on restoration sites?
Because hosting is not the problem. Audited restoration sites average a 0.07 second TTFB against a 0.80 second threshold - genuinely excellent - yet a 9.91 second LCP and 3.75 second First Contentful Paint. That gap can only come from the front end: uncompressed hero images, page-builder bloat, render-blocking JavaScript, chat and review widgets loading eagerly, and live Google Maps iframes. Compressing a 4MB hero to under 200KB in WebP alone typically cuts LCP by 40 to 60%, and it changes nothing about your host.
What technical SEO basics do restoration sites most often miss?
Ranked by how often auditors find them: main content rendering too slowly (81.3% of sites), two or more pages sharing the same title tag (50%), no sitemap.xml (43.8%), no robots.txt (37.5%) and broken internal links (31.3%). Adoption of the table-stakes signals is mixed - viewport meta 100%, SSL 87.5%, canonical tags 81.3%, JSON-LD schema 81.3%, but meta descriptions and Open Graph tags only 68.8%. Every one of those is a same-week fix that outperforms another month of blog posts.
Does site speed actually change lead volume for restoration companies?
Yes, and the elasticity is well documented: every additional second of mobile delay drops conversion roughly 7%, and a 5-second site loses about 35% of leads against a 1.8-second site at identical traffic. In a 200-site contractor study, pages loading under 2.5 seconds averaged 6.8% conversion. On 4,000 monthly sessions at a 5% target rate, the speed gap is the difference between roughly 200 and 130 leads a month - and on a USD 4,000 monthly Google Ads budget it wastes about USD 1,400 of spend you have already paid for.
What schema markup should a restoration website use?
Start with LocalBusiness (or a more specific service type) carrying exact NAP data, service area, opening hours including 24/7 emergency availability, and aggregate rating where you legitimately have reviews. Add Service schema per mitigation service, FAQPage on your claims and insurance pages, and BreadcrumbList across the site. Roughly 81.3% of audited restoration sites publish some JSON-LD, so schema alone is no longer a differentiator - completeness is, particularly emergency hours and service area, which are the fields that feed both rich results and AI answer engines.
The bottom line
Restoration is a vertical where the technical baseline is genuinely weak - 9.91s LCP, 65% of sites under 70 on PageSpeed, 43.8% without a sitemap - and where the traffic is the most mobile and most urgent in home services. That combination means the ROI on technical work here is unusually high and unusually fast: the fixes are measured in hours, the traffic is already arriving, and the clicks you are protecting cost USD 100-180 apiece. Fix the front end before you commission another blog post. Get in touch if you want the audit done against your own lead data.
Sources
Borah Labs - Water damage restoration website benchmarks (July 2026)
Onward Craft - 200-contractor website conversion study
PipelineOn - Contractor website speed optimization 2026
PushLeads - Water damage restoration keyword data
Authority Specialist - Water damage restoration SEO statistics
Tygart Media - Restoration SEO 2026
Barham Marketing - Home services conversion rate statistics 2026
Thomastown Digital - Contractor mobile benchmarks