



Table of contents
Virtual events remain useful when the format fits the job: a focused webinar can educate many people at once, while a virtual conference needs a different attendance and engagement model. Goldcast’s 2025 report reviewed 19,531 B2B webinars across 418 brands in calendar 2024 and found average registration-to-attendance of 33%. That benchmark is for short single-session webinars, not every type of online event.
Key Takeaways
- 33% average attendance in Goldcast’s 2025 report of 19,531 B2B webinars run in 2024.
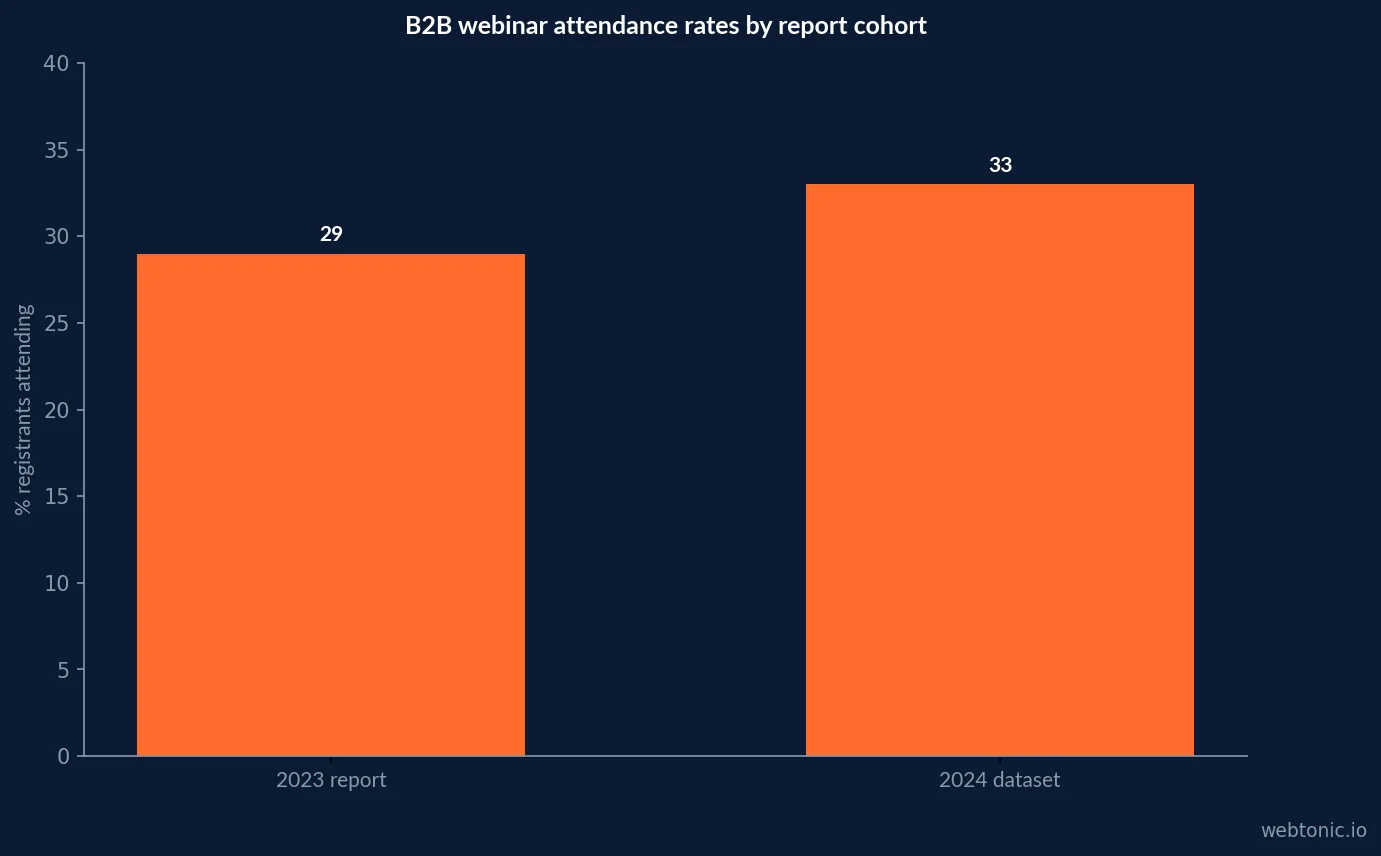
- The prior Goldcast report showed about 29% attendance, based on its smaller 2023 dataset.
- Goldcast’s webinar definition caps sessions at 90 minutes and excludes multi-session virtual conferences.
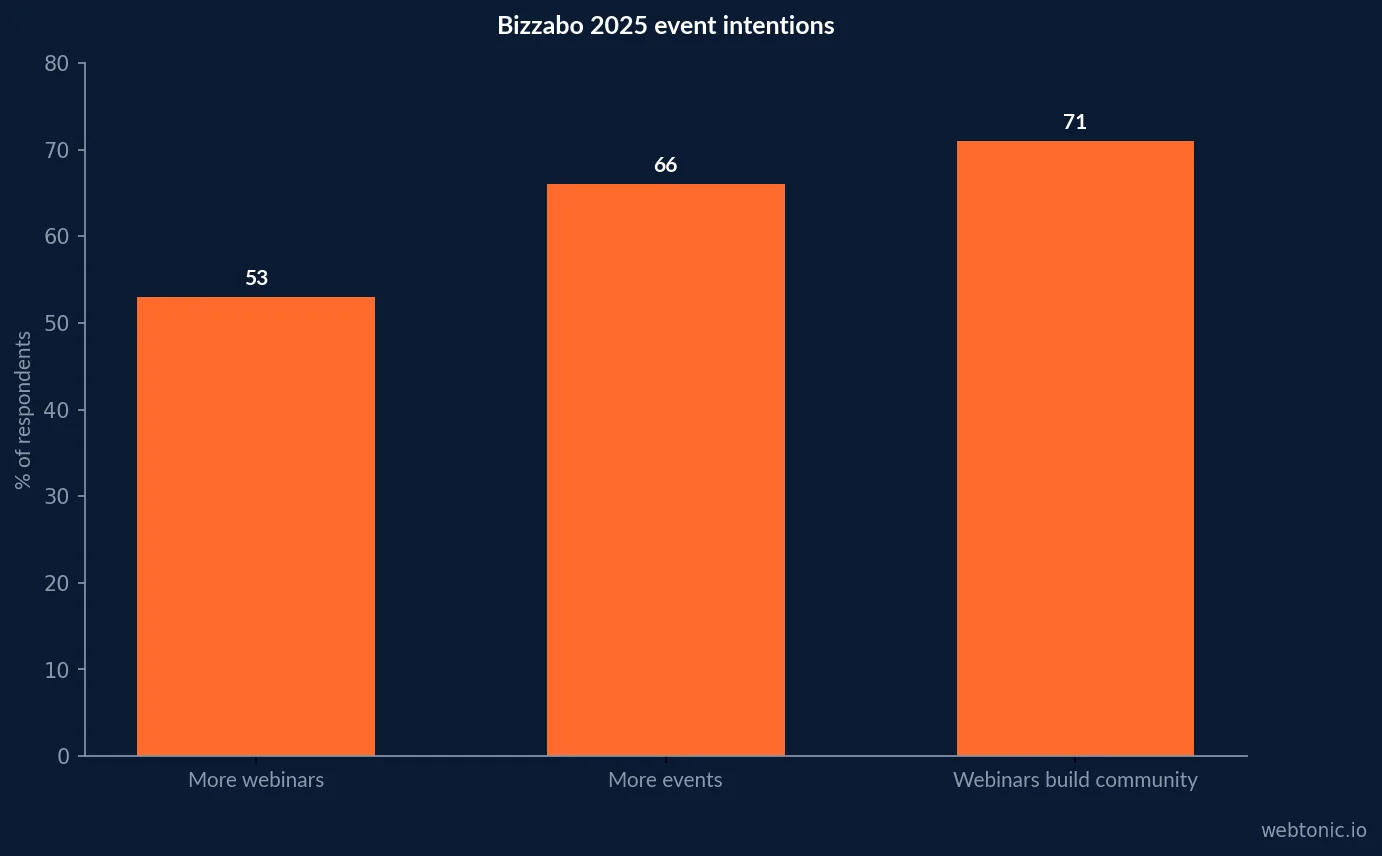
- 53% of surveyed Bizzabo attendees planned to attend more webinars in 2025.
- 1,500+ B2B organizers and attendees informed Bizzabo’s event survey, conducted in November 2024.
- 71% of Bizzabo organizers saw webinars as effective for building community.
- ON24’s 2025 digital engagement research draws on millions of interactions across experiences in 2024.
- 66% of Bizzabo organizers planned more events in 2025 than in the previous year.
The 2026 question is format fit, not format survival
Virtual events are not a substitute for every in-person experience. They remove travel and room constraints, let teams reuse expert time, and can make niche education accessible across geographies. They also lose hallway conversations, spontaneous networking and the physical cues that can make an in-person gathering valuable.
That trade-off means the 2026 decision should begin with the job: teach a product workflow, generate qualified conversations, bring a distributed community together, or host a broad industry gathering. A single KPI such as registrations cannot decide whether the format worked.
Attendance benchmarks: read the denominator
Goldcast’s 2025 B2B Webinar Benchmark Report reviewed 19,531 webinars across 418 brands in calendar 2024. It defines webinars as single-session virtual events lasting 90 minutes or less and excludes event series. Average attendance was 33% of registrants, compared with about 29% in the previous edition based on approximately 6,000 webinars from 300 brands.
The registration-to-attendance ratio is not the same as unique reach, session retention or engagement. Before using it, verify that your registration count excludes duplicates and that attendance uses the same rule for joining late, replaying or attending multiple sessions.
| Swoogo Eventscape 2025 | Figure | Measurement unit | Interpretation |
|---|---|---|---|
| Organizer survey | 500 event organizers | Survey, Nov 2024 | Stated workload concerns |
| ROI stress | 50% | Survey respondents | Evidence that measurement is difficult |
| Hybrid event activity | 25% fewer in 2024 vs 2023 | Swoogo platform activity | Platform-specific, not whole market |
| Event plans | 94% planned same number or more | Organizer survey, per report | Intent, not completed events |
| Micro-event activity | 16% increase | Events hosted on Swoogo | Platform activity change |
Interest in digital events and the in-person contrast
Bizzabo’s 2025 State of Events report surveyed more than 1,500 B2B organizers and attendees in November 2024. It found 53% of attendees planned to attend more webinars in 2025, while 66% of organizers planned to schedule more events overall. In the same report, 72% of attendees said in-person conferences provide the best networking opportunities. Interest in virtual learning and preference for live networking can both be true.
Use the survey as a directional signal of stated intention, not actual attendance or guaranteed demand. Local audience, subject urgency and competing events determine the eventual count.
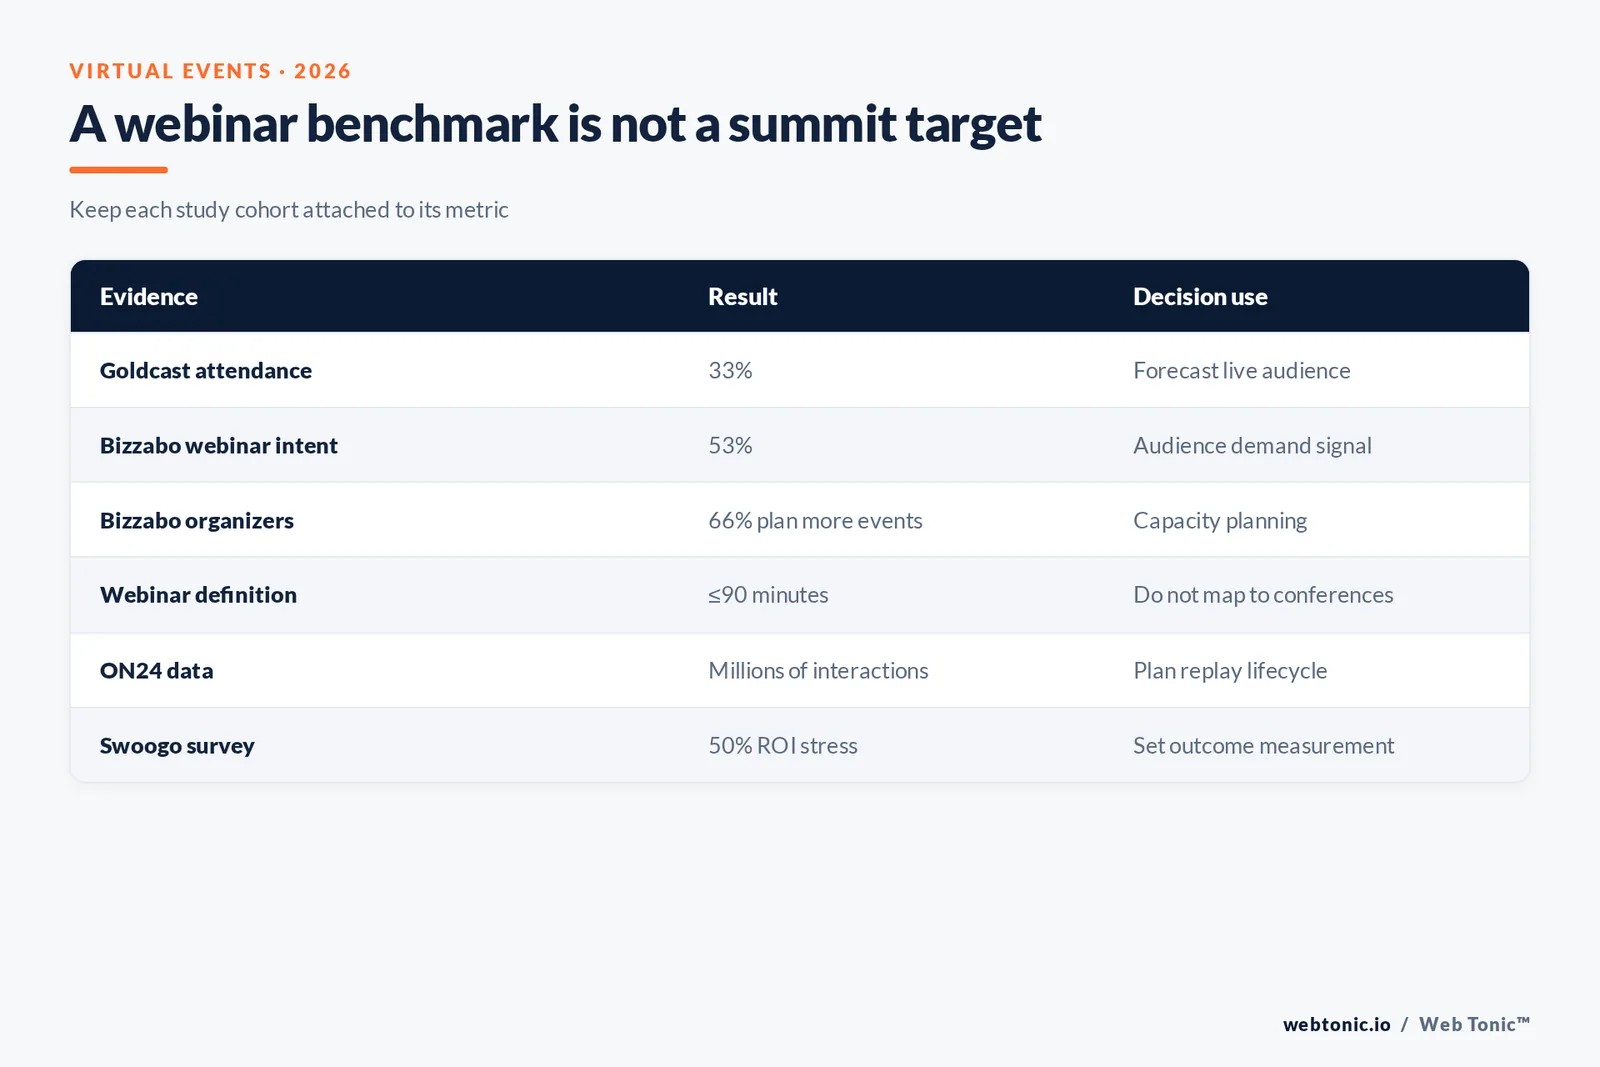
Benchmark table: webinar and broader event evidence
Keep the study populations visible beside the number. Webinar platform data describes operational performance; organizer and attendee surveys describe intentions and perceptions. A useful annual plan combines both rather than blending them into a single supposed industry average.
Webinar session length and programming
Goldcast explicitly analyzes sessions up to 90 minutes and says concise formats are the report’s webinar unit. The result should not be stretched to multi-day summits or full virtual conferences. Agenda design should match the promise: one core lesson, a short demonstration, useful Q&A, and a clear next action.
When the subject needs more depth, split the program into a series or create a structured replay path. Measure registration and attendance per episode as well as return attendance across the series, since one long session and multiple short sessions create different friction.
| Source / study | Coverage | Virtual-event finding | What the number means |
|---|---|---|---|
| Goldcast 2025 report | 19,531 B2B webinars; 418 brands; 2024 | 33% registrant-to-attendee rate | Short single-session webinars |
| Goldcast prior edition | About 6,000 webinars; 300 brands; 2023 | About 29% attendance | Earlier coverage, not identical scale |
| Bizzabo 2025 State of Events | 1,500+ organizers and attendees; Nov 2024 | 53% planned to attend more webinars in 2025 | Stated intent, not realized attendance |
| Bizzabo organizer survey | Same survey | 66% planned more events in 2025 | Plans across event formats |
| ON24 2025 benchmarks | Millions of digital interactions in 2024 | Webinars, virtual events and content experiences | Platform engagement signals |
Live audience is only one consumption window
ON24’s 2025 Digital Engagement Benchmarks report draws on millions of interactions from webinars, virtual events and content experiences delivered by leading brands around the globe in 2024. Its published framing highlights evolving audience expectations for on-demand content, personalization and conversion. The main operational implication is to treat the event as a content asset with a live moment and an after-event lifecycle.
Do not simply add live and replay views without deduplicating people or labeling the windows. Distinguish live attendance, replay starts, replay completion and subsequent content interactions; then connect only consented, attributable engagement to sales or customer outcomes.
TwentyThree’s 2025 State of Webinars combined survey responses from 102 webinar makers worldwide with anonymized data from thousands of webinars on its platform. It reports that 62% of companies considered webinars very or extremely important to digital strategy, 35% had dedicated webinar managers or teams, and 48.5% integrated webinar tools with their marketing technology stack. The survey sample is small and platform-linked; use it to understand operating maturity, not to claim a universal adoption rate. See the report and methodology.
| Decision metric | Calculation | Why it matters | Guardrail |
|---|---|---|---|
| Attendance rate | Unique live attendees / unique registrations | Forecast live room | Declare late-join rule |
| Replay consumption | Unique replay viewers / replay starts | Measures after-event utility | Separate from live |
| Meaningful interaction | Qualified actions / attendees | Indicates participation | Define actions in advance |
| Cost per qualified attendee | Fully loaded event cost / qualified attendees | Compares operating models | Include labor and promotion |
| Sourced pipeline | Opportunity first attributable to event | Direct acquisition role | Keep influenced pipeline separate |
Engagement: choose actions that matter
Chat messages, poll responses and questions are observable activity, but they do not all mean the same thing. A participant can watch attentively without chatting; another can post frequently without being a likely buyer. Define an engagement ladder before reporting: attended, stayed through a meaningful portion, interacted, requested follow-up, or completed a product action.
For educational programming, watch time and question quality may matter more than a click on a sales CTA. For a product demonstration, an opted-in request for a tailored conversation may be more meaningful. Align the event scorecard to its objective and avoid a single blended engagement percentage.
Virtual versus in-person: compare equivalent outcomes
Bizzabo’s survey findings show the format split clearly: attendees valued in-person conferences for networking, while 53% anticipated attending more webinars. These numbers do not make either mode universally better. A virtual event may win on access and specialist content; an in-person event may win when relationship-building is the central purpose.
Compare cost per qualified attendee and the number of meaningful conversations or next-step actions. Include production, promotion, speaker time and follow-up labor. A lower cost per registrant is not a valid efficiency claim if few registrants attend or progress.
Economics without invented ROI claims
There is no universal event ROI percentage in the datasets above. Build a model from your own verified costs and outcomes: direct production and platform costs, promotion, staff time, qualified attendee value and attributable pipeline using a declared window. Report influenced pipeline separately from sourced revenue so the event does not receive credit for every later deal it touched.
Use a pre-event control or historical cohort where feasible. If the event is a relationship or education investment, record the qualitative outcome and the time horizon rather than forcing an immediate revenue number onto it.
Swoogo’s 2025 Eventscape surveyed 500 event organizers in November 2024 and found that 50% identified demonstrating ROI as a top stressor. It also reported companies hosted 25% fewer hybrid events on its platform in 2024 than in 2023. This is Swoogo platform activity and a survey, not a census of all events; it shows why ROI discipline and format choice matter, not that hybrid demand universally fell. See Swoogo’s 2025 Eventscape.
| Format | Best-fit job | Strongest evidence to monitor | Weak inference to avoid |
|---|---|---|---|
| Focused webinar | One topic, teaching, demo or Q&A | Registrants, live attendance, question quality | Calling all virtual events webinars |
| Multi-session virtual summit | Several themes or communities | Session-level return and cross-session paths | Using 90-minute webinar benchmark |
| In-person conference | Networking, immersion, relationship building | Qualified conversations and follow-up | Comparing raw attendance counts |
| On-demand program | Time-shifted learning and evergreen reach | Replay completion and downstream actions | Adding replays to live counts without dedupe |
Design registration and attendance together
A 33% attendance benchmark is a planning input, not a goal to copy. Forecast live participants from the number of qualified registrations using prior comparable events, then account for geography, timing, event type and reminder cadence. Goldcast’s report indicates that its observed rate improved from the previous report, but changed sample coverage means that movement should not automatically be read as a pure year-over-year treatment effect.
Set reminders with useful logistics, calendar links and clear expectations. Make the replay plan visible at registration, but do not let on-demand access become an excuse for weak live programming if real-time interaction is the event’s purpose.
| Webinar program maturity | TwentyThree 2025 measure | What it signals | Study limit |
|---|---|---|---|
| Survey sample | 102 webinar makers | Global respondent survey | Small sample, self-selected |
| Strategic importance | 62% very / extremely important | Internal priority | Self-reported |
| Dedicated webinar roles | 35% of organizations | Program operating model | Not all company sizes |
| Martech integration | 48.5% | Tracking and distribution maturity | Tool vendors’ platform context |
| Data supplement | Thousands of platform webinars | Behavioral evidence alongside survey | Anonymized vendor platform data |
A decision scorecard for next year
Before committing, score audience need, expected attendance, speaker availability, production complexity, access requirements, interaction design and follow-up capacity. Decide in advance what success means and which metric can legitimately prove it. If an event lacks a clear audience job or a credible follow-up path, a shorter webinar, on-demand resource or in-person format may be better.
Build a baseline from two or more comparable events rather than borrowing an unrelated industry average. Track attendance and outcome distributions, annotate changes in format or promotion, and retain the cohort definition with every comparison.
For teams deciding between event formats and their follow-up system, connect the content journey to growth marketing, test invitation and event creative through performance creative, and use a strategy conversation to scope the measurement question. Treat those as next-step links, not endorsements of an event platform.
Accessibility also belongs in the format calculation: captions, keyboard navigation, readable slides, time-zone choices and a clear way to ask questions all affect participation. Record these as delivery conditions alongside the attendance rate rather than treating them as optional production polish.
Event teams can connect a measurable program to growth marketing, evaluate invitations through performance creative, and discuss the measurement design before the next event. These links are planning pathways, not evidence of event ROI.
Frequently Asked Questions
Are virtual events still worth hosting in 2026?
They can be, when a measurable audience need justifies the format. Goldcast’s 2025 benchmark analyzed 19,531 B2B webinars from 418 brands during 2024 and found a 33% average registration-to-attendance rate. That supports planning around attendance loss, but does not prove a virtual event will pay back for every organizer.
What is a good webinar attendance rate?
Goldcast reports 33% average attendance for its 2024 webinar dataset, up from about 29% in the prior report. This is a B2B webinar benchmark with a specific definition (single-session, 90 minutes or less), not a standard for multi-session virtual conferences.
How should I compare virtual and in-person events?
Compare cost per qualified participant, audience reach, engagement and downstream outcomes using the same event objective. Bizzabo’s 2025 report found 53% of surveyed attendees planned to attend more webinars in 2025, while its event research also records a strong preference for in-person networking. These are distinct event jobs.
Should a virtual event be live-only?
Not necessarily. ON24’s 2025 Digital Engagement Benchmarks use millions of interactions across digital experiences delivered in 2024 and emphasize on-demand engagement, personalization and conversion. Offer a replay when the content remains useful after the live session and measure replay activity separately.
What is the biggest virtual event metric mistake?
Treating registrations as attendance or attendance as business value. Track registrant-to-attendee conversion, meaningful participation, replay consumption and qualified follow-up independently, with clear denominators and windows.
Sources
Goldcast — 2025 B2B Webinar Benchmark Report
ON24 — 2025 Digital Engagement Benchmarks
Bizzabo — 2025 State of Events and Industry Benchmarks
Bizzabo — State of Events 2025
Eventbrite — social and event trends
Freeman — attendee experience research
Cvent — event research and planning data
ClickMeeting — State of Online Events 2025
TwentyThree — State of Webinars 2025
TwentyThree — 2025 webinar-maker survey and platform data


