



Table of contents

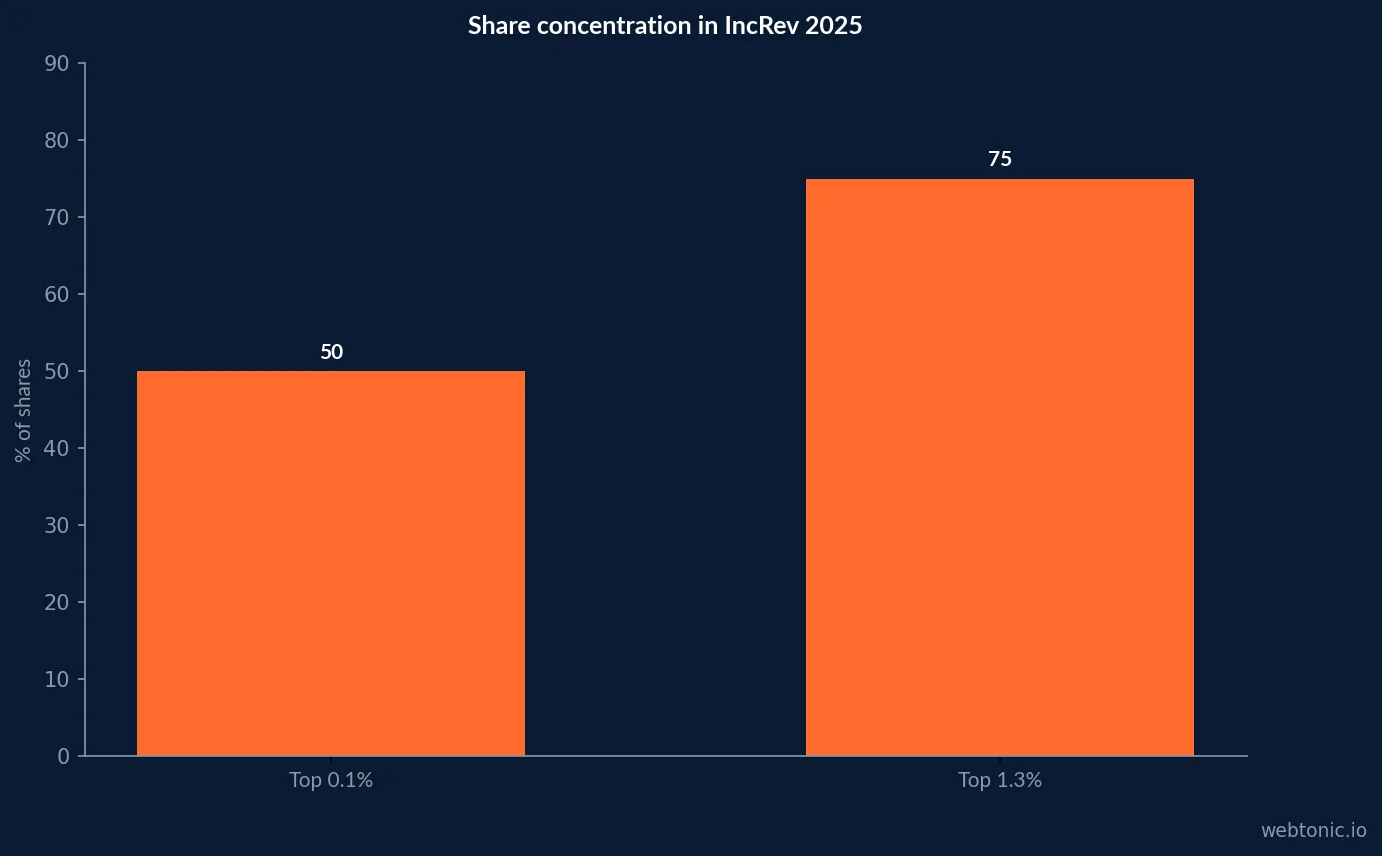
Viral performance is a distribution problem: a small fraction of content can account for a disproportionate share of circulation, while most posts travel only within their initial audience. In IncRev’s analysis of 912 million blog posts, 1.3% generated 75% of observed social shares. That is a dataset-specific concentration result, not a promise that a particular campaign can reproduce it.
Key Takeaways
- 1.3% of analyzed articles generated 75% of social shares in IncRev’s 912-million-post study.
- 0.1% accounted for half of shares in that same content dataset.
- 1,000–2,000 words correlated with 56.1% more shares than posts under 1,000 words in IncRev’s analysis.
- 14–17-word headlines correlated with 76.7% more shares than shorter headlines in that dataset.
- Question headlines had 23.3% more shares in the study’s comparison.
- Social shares and backlinks had a 0.078 Pearson correlation in that analysis.
- A PLOS ONE survey included 452 participants studying motivations behind branded-content engagement.
- Metricool analyzed over 1 million accounts and 21 million posts across eight social networks for its 2025 study.
What “viral” means in a dataset
Viral is not a fixed count. A post with 10,000 shares may be ordinary for a large media brand and extraordinary for a small specialist. Researchers commonly operationalize virality through diffusion: sharing volume, cascade depth, speed, or reach relative to the seed audience. The first decision is therefore the unit: post, campaign, person-to-person referral, or platform impression.
IncRev’s 2025 analysis of 912 million blog posts measures content-level shares, not customer referrals or sales. Metricool’s 2025 Social Media Study analyzes 21 million posts from more than 1 million accounts across eight networks, providing platform-post context but not a universal “viral” label. Keep those units separate when benchmarking.
The concentration curve is the headline
The distribution is heavily skewed. IncRev reports that 1.3% of posts generated 75% of shares and 0.1% generated 50%. Averages hide this long tail: the typical article and the exceptionally shared article are not interchangeable observations. A median share count, percentile bands and the share of total engagement by top posts are more useful than one mean.
That concentration also changes planning. A program should not assume a smooth return from every asset. Build a portfolio: publish enough useful material to learn, identify unusually strong diffusion early, and then test why it traveled. One standout should not erase the denominator of unsuccessful attempts.
| Platform context | Metricool 2025 coverage | Unit to benchmark | Caution |
|---|---|---|---|
| 2025 study included | Post and account performance | No blended cross-network target | |
| TikTok | 2025 study included | Video distribution and interactions | Algorithmic exposure varies |
| 2025 study included | Post reach and interactions | Audience age/profile differs | |
| YouTube | 2025 study included | Video views and interactions | Long and short video differ |
| 2025 study included | Professional content | B2B audience context differs |
What motivates an actual share
A 2025 PLOS ONE paper surveyed 452 participants about social and personal motivations behind consumer online brand-related activities. It found that motives such as interacting, following trends, building community and staying connected related to emotional engagement; self-presentation, self-expression and self-assurance were also relevant personal motives. This is survey evidence about relationships, not causal proof that adding a trend guarantees sharing.
The practical implication is to make the recipient look or feel something useful by forwarding the item: help them inform a colleague, express an identity, join a conversation, or entertain a group. Asking for a share is weaker than giving the sender a clear social reason to share.
A related 2024 study of 409 US respondents, published in Humanities and Social Sciences Communications, found that ease of browsing, hedonic and functional value, aesthetics, social interaction and self-identity were associated with consumers’ online brand-related activities. Its survey model offers a second lens on share motivation, but does not establish that any one design feature causes virality. Read the study’s framework.
Format and channel alter the denominator
Metricool’s 2025 study draws on over 1 million accounts, more than 21 million posts and eight social networks. It describes video as a strong reach and interaction format across networks, while also noting platform-specific differences. The correct comparison is within a platform, audience type and format, not a raw share count that mixes a short video with a newsletter article.
Log reach and unique exposure alongside shares. A share rate such as shares per 1,000 reached accounts gives a more interpretable signal, although platform definitions of reach can differ. Record whether the denominator is impressions, unique accounts, viewers or delivered recipients.
Benchmark table: what each study actually measures
These observations are not interchangeable benchmarks. Each has its own population, observation unit and publication year. Use them to frame hypotheses and design a comparable internal measurement window; do not transplant an industry average onto a different channel.
| Dataset / year | Unit and coverage | Share-related finding | Interpretation |
|---|---|---|---|
| IncRev analysis (2025) | 912 million blog posts | 1.3% produced 75% of shares | Highly concentrated distribution |
| Metricool Social Media Study (2025) | 21 million posts; 1M+ accounts; 8 networks | Video is a leading format for reach and interaction | Platform mix matters |
| PLOS ONE (2025) | 452 survey participants | Social and personal motives relate to branded engagement | Motivation evidence, not causal uplift |
| IncRev headline analysis (2025) | Blog headlines in the dataset | 14–17 words: 76.7% more shares | Association, not a universal rule |
| IncRev backlink comparison (2025) | Shares and backlinks across posts | Pearson correlation 0.078 | Separate links from social reach |
Shares are not links, leads or sales
In IncRev’s study, the correlation between social shares and backlinks was 0.078. That is close to zero in a linear relationship and warns against treating social circulation as a direct proxy for organic authority. A separate outcome chain—referral visits, engaged sessions, qualified leads, revenue—must be measured with tagged links and consistent attribution.
For campaigns, capture share count and referral traffic separately. A high-share post can create awareness with little site intent; a quieter resource may earn links or conversions. The business objective determines which result matters, not the vividness of the share total.
| Observed pattern | Reported comparison | How to use it | Important limit |
|---|---|---|---|
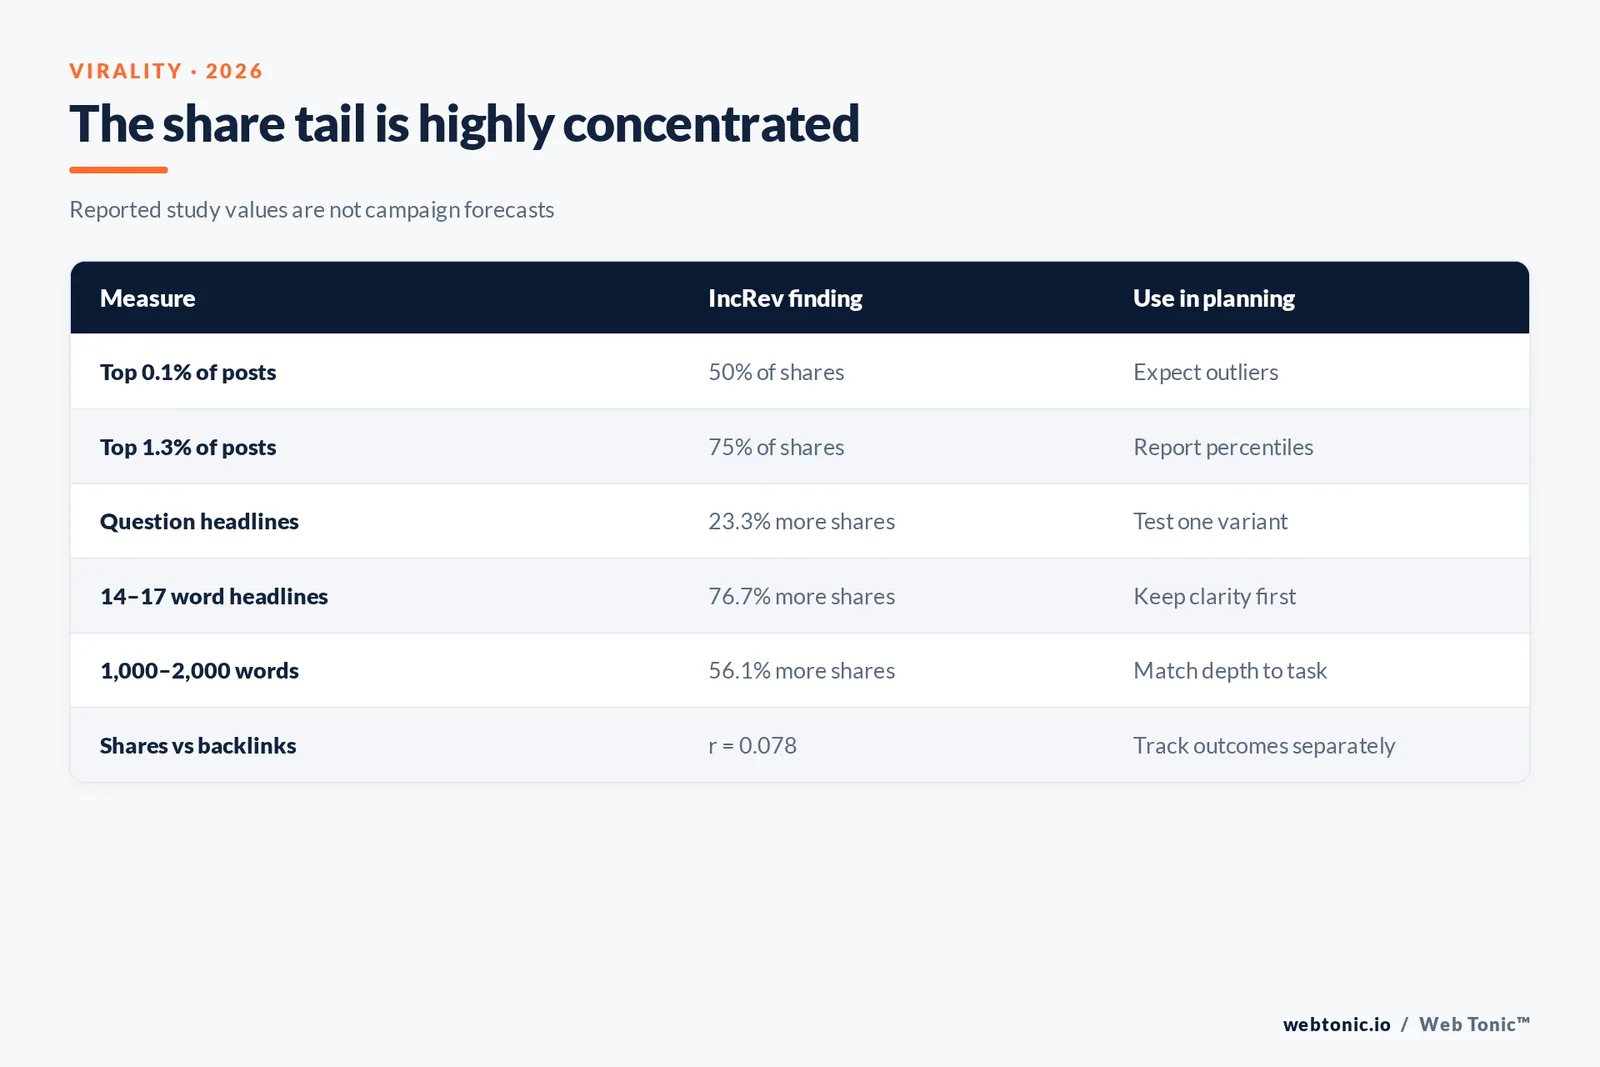
| Top 1.3% of posts | 75% of all shares | Use percentiles and tail share in reporting | IncRev corpus, not all content |
| Top 0.1% | 50% of all shares | Study concentration implies outlier risk | No forecast of future campaigns |
| 1,000–2,000 words | 56.1% more shares vs under 1,000 | Test useful depth against short versions | Topic and publisher vary |
| Question headlines | 23.3% more shares | Include as one headline test arm | Correlation, not causal |
| 14–17-word headlines | 76.7% more shares vs shorter titles | Try when clarity permits | Specific study dataset |
Headline and length observations: read as associations
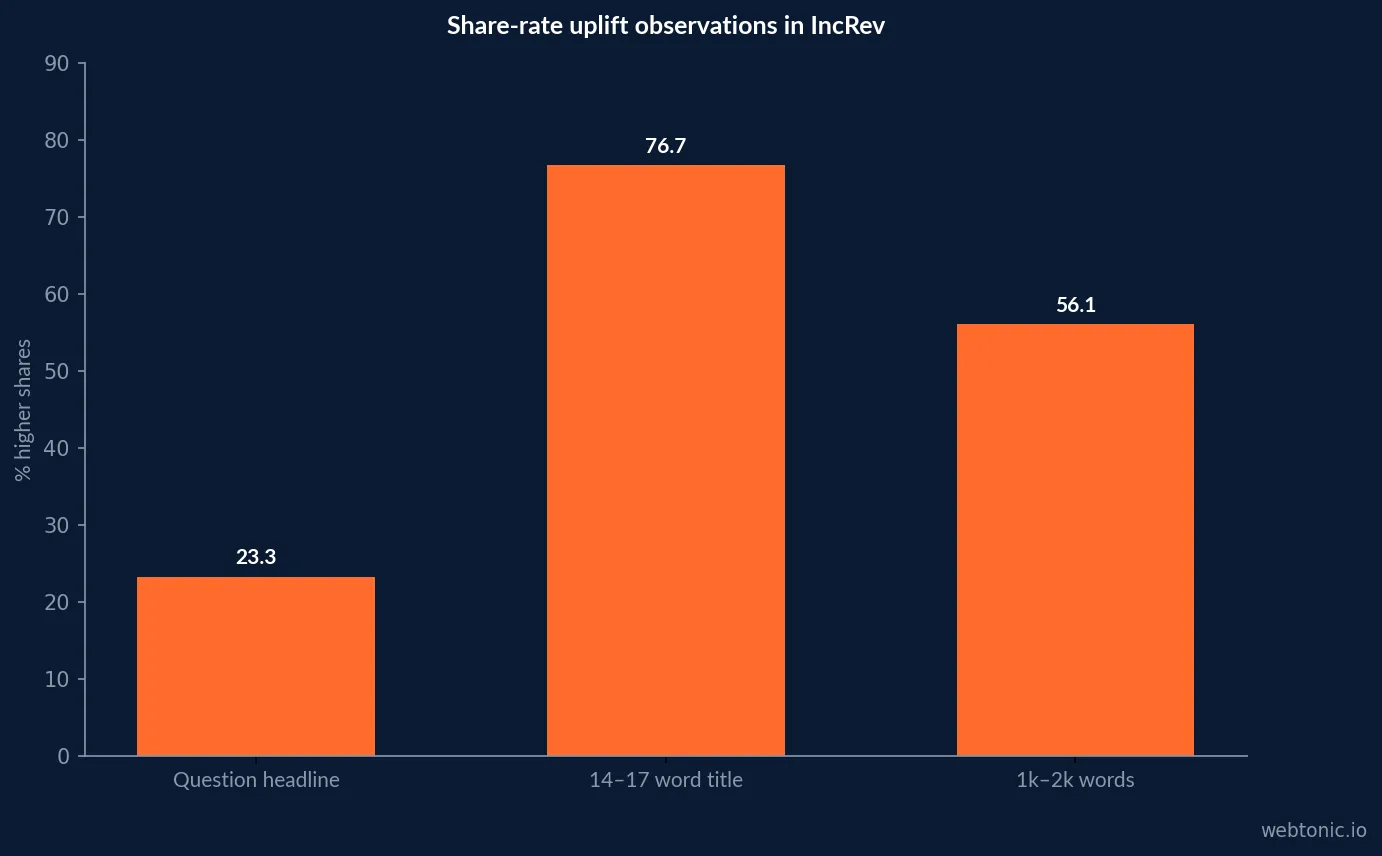
IncRev reported 76.7% more shares for 14–17-word headlines than shorter titles, and 23.3% more shares for questions than other headline formats. It also found 1,000–2,000-word content received 56.1% more shares on average than sub-1,000-word posts. These are comparisons within the analyzed corpus; they can reflect topic, publisher authority or format mix as well as headline choice.
Use them as test ideas, not editorial laws. Hold the subject and distribution as constant as possible, vary the headline treatment, and compare share rate rather than total shares when audience sizes differ.
Viral coefficient: the useful campaign calculation
For referral mechanics, estimate a simple coefficient as the average number of invitations or shares per active participant multiplied by the proportion of recipients who become active participants. A value above one implies modeled growth under the assumptions; it is not a guarantee of exponential spread. The calculation needs a defined time window, unique recipients and deduplicated conversions.
Organic social posts often lack full visibility into private shares, dark social and platform-to-platform movement. Label a coefficient as an observed estimate and expose its inputs. If the share source is unknown, keep it unknown rather than assigning it to “direct” with false confidence.
A measurement design that survives review
Before launch, define the exposure unit, share event, unique-user rule, attribution window and business outcome. Keep campaign identifiers stable in URLs, use platform analytics for native share counts, and reconcile site sessions with analytics or CRM records. Document known blind spots such as private messages, reposts, screenshot sharing and delayed sharing.
For an experiment, randomize or stagger distribution where practical, and separate creative effect from paid amplification. Compare matched cohorts and report uncertainty. A viral case study with only its winning post and no baseline is a story, not a benchmark.
For campaign operations, connect the content plan to creative testing and performance measurement, and use growth marketing planning to decide which outcomes matter. For an existing funnel, data intelligence can help reconcile tagged referrals with CRM events. These are internal links to relevant services, not claims about study results.
| Metric | Definition for your report | Denominator | Decision supported |
|---|---|---|---|
| Share rate | Native shares / unique exposure | Reached accounts or delivered recipients | Creative resonance |
| Referral visit rate | Tagged referral sessions / shares | Shares where trackable | Traffic generation |
| Cascade depth | Number of identifiable reshare generations | Observed referral chain | Diffusion structure |
| Qualified conversion rate | Qualified outcomes / referral sessions | Consented analytics or CRM | Commercial value |
| Top-share concentration | Shares on top percentile / all shares | All eligible posts in cohort | Portfolio dependence |
Why distribution beats a “viral trick”
Sharing is partly social behavior and partly exposure opportunity. Content cannot diffuse beyond people who encounter it, and platform recommendation systems change who sees a post. Metricool’s analysis of millions of posts is a reminder that networks have distinct mechanics; a result observed on one network should not automatically be generalized to another.
Seed distribution should come from relevant communities and owned audiences, not artificial engagement schemes. Ask whether the first audience has a credible reason to pass it onward, then watch the cascade and stop investing if the response is weak. This creates a repeatable process without claiming virality is controllable.
| Evidence type | What is measured | Best use | Limit |
|---|---|---|---|
| Large content crawl | Shares across 912M blog posts | Distribution concentration | Not social platform posts only |
| Platform dataset | 21M posts across 8 networks | Channel-format comparison | Metricool account sample |
| Survey model | 409 US respondents (2024) | Campaign value/motivation hypotheses | Self-report and US sample |
| Survey model | 452 participants (2025) | Social and personal motives | Not causal campaign results |
| Case experiment | 222 participants + 1.27M posts | Positive affect and sharing context | Higher education setting |
A practical shareability review
Evaluate each candidate asset on five questions: is the point clear in a preview; does it offer a fact, utility or emotion worth forwarding; can the sender explain why it matters to a particular recipient; is the format native to the channel; and does the destination deliver on the promise? This checklist is a working method, not a published universal score.
Pair the review with post-publication observations. Track first-hour reach, share rate, referral visits and meaningful actions over an agreed window. Reassess after the distribution period rather than declaring a winner from an early spike.
One editorial test worth running is a matched pair with the same subject and seed audience, changing only the emotional or practical frame. Tag each version and compare share rate per unique exposure over the same observation window. Even a large difference remains a local result until it replicates with another audience.
To take the measurement beyond share counts, connect a test plan to performance creative, growth marketing, and data intelligence. The service links are practical next steps, not findings in the cited studies.
Frequently Asked Questions
What percentage of content goes viral?
There is no universal viral threshold. IncRev’s analysis of 912 million blog posts found 1.3% generated 75% of social shares, but that describes concentration in its dataset, not the odds any individual post will go viral. Define virality against your audience size, channel and business outcome.
What makes people share branded content?
A 2025 PLOS ONE survey of 452 participants found social motives such as interaction, trend-following and community, alongside personal motives including self-expression and self-presentation, were related to engagement and sharing. The study is evidence about reported motivations, not proof of a single universal formula.
Do social shares create backlinks?
Not necessarily. IncRev reported a Pearson correlation of 0.078 between social shares and backlinks in its blog-post dataset, indicating little linear relationship there. Shares and links should be tracked as different outcomes.
How should a marketer measure virality?
Track shares or forwards relative to unique exposed people, plus secondary reach and downstream outcomes. Keep platform, content format and observation window fixed; do not compare raw share counts across different audience sizes.
What content length attracts more shares?
IncRev’s analysis reported that 1,000–2,000-word posts received 56.1% more shares on average than posts under 1,000 words in its dataset. This is an observed association, not a reason to add length when a topic is better answered briefly.
Sources
IncRev — analysis of 912 million blog posts (2025)
Metricool — 2025 Social Media Study
Sprout Social — social media data and research
Pew Research Center — U.S. social platforms research (2024)
Humanities and Social Sciences Communications — COBRAs and virality (2024)
Buffer — social engagement measurement guide
PLOS ONE — social and personal motivations in viral marketing (2025)
Socialinsider — social media benchmarks


