



Table of contents

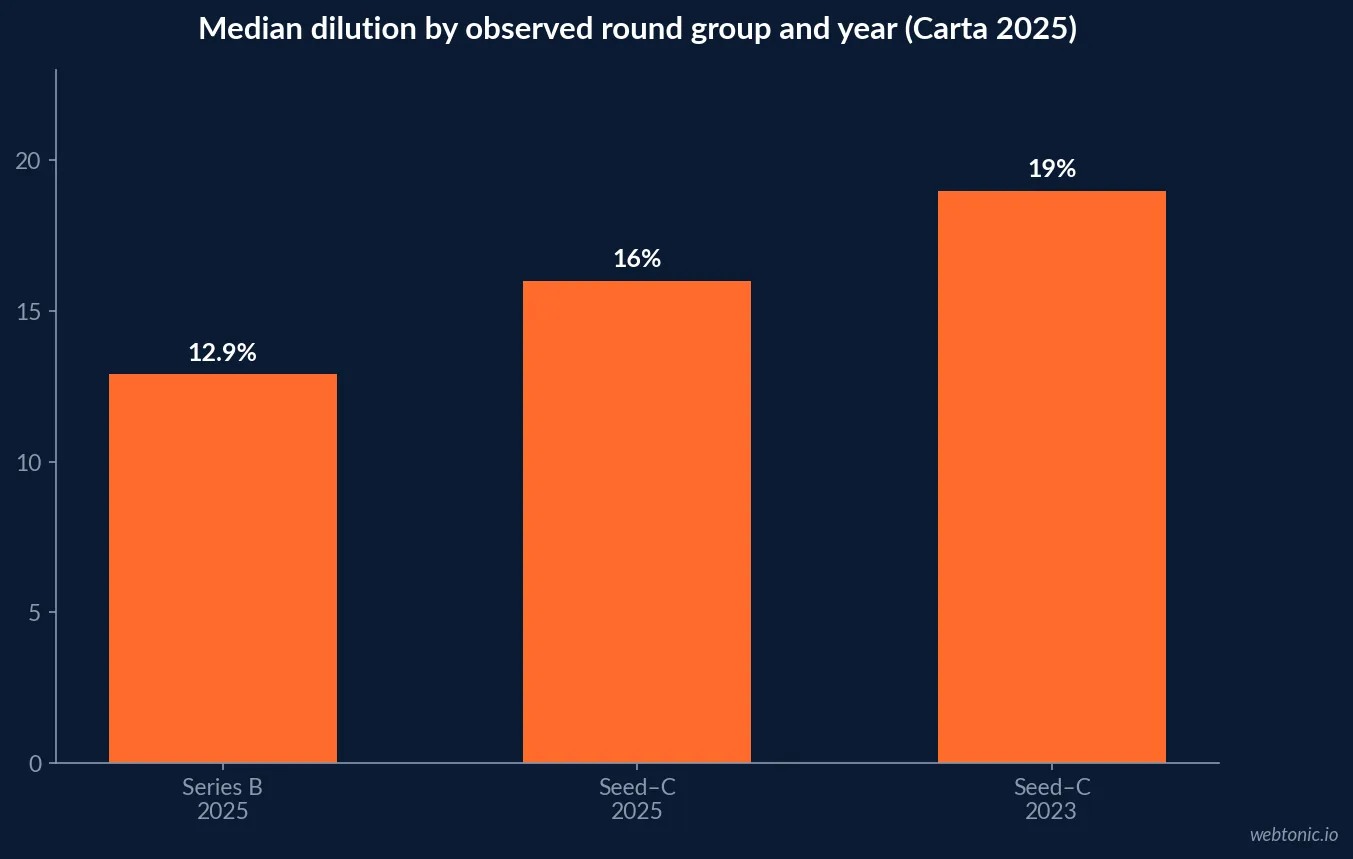
Venture capital metrics belong in a founder’s operating budget because they shape financing timing, runway, and dilution—not because a market average predicts the next round. Carta’s 2025 State of Startups analyzed more than 60,000 startups and 3,000 venture funds, while its 2025 year-end data showed median dilution on rounds from seed through Series C moving from about 18% to 16%. These figures provide context, not a guaranteed valuation or fundraising outcome.
Key Takeaways
- Carta’s 2025 State of Startups analyzed 60,000+ startups and 3,000 funds.
- Carta reported median seed-to-Series C dilution falling from about 18% to 16% over 2025.
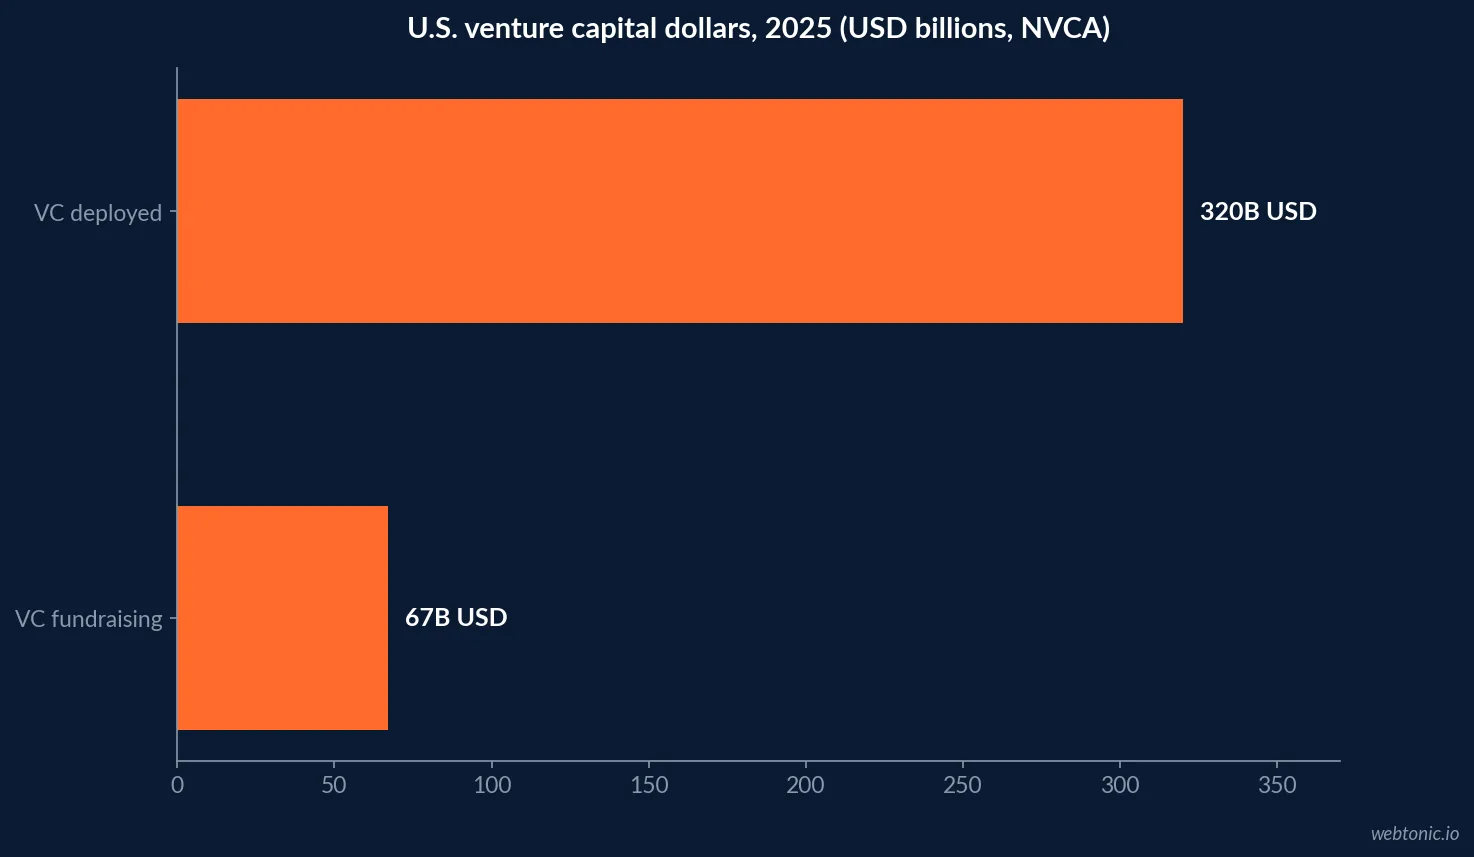
- NVCA reported $320 billion deployed across U.S. VC in 2025; AI captured 65.4% of deal value.
- The market’s total funding volume says little about a specific startup’s probability of closing.
- Budget metrics work as a recurring finance process, not a deck-only exercise.
- Runway scenarios should connect burn, hiring, cash receipts, and fundraising lead time.
- Track dilution by financing instrument and round stage; distinguish ownership sold from option-pool changes.
- A benchmark must match geography, stage, sector, and instrument to be decision-useful.
- Fundraising metrics include time to close, investor pipeline, conversion, and diligence readiness.
- The board dashboard should reconcile operating performance with cash and cap table assumptions.
- Pre-seed SAFE activity and priced seed rounds are not interchangeable comparisons.
- Use a downside case that remains credible if a raise takes longer or closes smaller.
- Separate market research from internal actuals in every investor-facing chart.
- Founders should model dilution before agreeing to terms, not after the financing closes.
- Build data-room upkeep into finance and leadership capacity rather than treating it as free.
Evidence references: Carta — State of Startups 2025 · Carta — State of Private Markets: 2025 in Review · Carta — State of Pre-Seed 2025.
Related: data intelligence · growth planning · budget modeling.
Benchmarks at a glance
These market figures describe different layers of venture activity. Carta’s platform sample, NVCA’s U.S. market totals, and the U.S.-focused pre-seed data are not one continuous dataset. Use the geography and denominator as part of the metric label. A founder should not compare a company’s own pipeline to market deployment totals as if both were funnel conversion rates.
| Metric | 2025 reported value | Scope | Founder use |
|---|---|---|---|
| Capital deployed | US$320B | U.S. venture market, NVCA 2025 yearbook | Market context, not company forecast |
| AI share of deal value | 65.4% | U.S. 2025 deal value, NVCA | Shows concentration by sector |
| VC fundraising | US$67B | U.S. venture funds, 2025; lowest in 9 years per NVCA | Fund-formation context |
| Median dilution | ~16% | Carta seed–Series C, 2025 | Observed median; model terms separately |
| Pre-seed instruments | US$10.4B / 50,316 | U.S. startups on Carta, 2025 | SAFEs and notes; not priced rounds |
Reading the evidence boundary: Keep population, period, unit, and decision owner visible when comparing internal results with published evidence.
| Metric family | Example measure | Operating owner |
|---|---|---|
| Liquidity | Cash balance and runway scenarios | Finance |
| Operating traction | Revenue, margin, and model-specific leading indicator | Functional lead |
| Financing terms | Fully diluted ownership and instrument conversion | Finance and counsel |
| Fundraising funnel | Investor stage, next step, and elapsed time | CEO / fundraising lead |
Operating workflow: Separate the recurring work from the decision it supports.
| Workstream | Recurring finance task | Evidence produced |
|---|---|---|
| Liquidity | Refresh rolling cash scenarios | Runway and trigger dates |
| Operating metrics | Reconcile definitions to source data | Investor-ready monthly metrics |
| Ownership | Update cap table and convertibles | Fully diluted scenario |
| Raise process | Maintain CRM and diligence room | Stage and elapsed-time view |
A budget for metrics is a budget for decisions
“Venture capital metrics” can mean market activity, startup operating health, fundraising execution, or investment terms. Founders often mix these in a single investor presentation. A useful measurement budget distinguishes public market context from company-specific evidence. Market data can orient a discussion about timing or dilution; company records must show whether the business has the traction, cash discipline, and governance to pursue the raise. The practical allocation is not a line item for buying a statistic. It covers maintaining a dependable monthly close, a cash and runway forecast, cohort or unit economics where relevant, a clean cap table, a fundraising funnel, and the time to keep diligence materials current. The goal is to make the same numbers flow from finance to the board to the data room. Budgeting these routines early is less disruptive than reconstructing them during active investor conversations.
Dilution is a metric to model before the term sheet
Carta’s 2025 year-end State of Private Markets reports median dilution across rounds from seed through Series C fell from about 18% to 16% over the past year, continuing a multi-year decline; the two-year-prior figure was 19%. Series B dilution fell from about 15% to 12.9% in 2025. These medians describe observed priced rounds on Carta and are not a promise that a company can raise while selling exactly that share of ownership. A founder’s budget should include scenario modeling for the round size, pre-money valuation, option pool treatment, existing convertibles, and follow-on reserve. Show fully diluted ownership before and after the transaction, including SAFEs and notes where applicable. A lower market median can coexist with a higher company-specific dilution if the round includes a pool top-up or a difficult negotiating position. Ask counsel and finance leads to validate assumptions before treating the scenario as a forecast.
Capital is concentrated; headline totals can mislead
NVCA’s 2026 Yearbook, reporting on 2025, shows $320 billion in capital deployed and 65.4% of deal value in AI; the same yearbook reports $67 billion in VC fundraising, the lowest in nine years. The two figures are distinct: deployed capital is not new fund commitments, and a market with substantial investment can still have fewer fund managers able to raise. NVCA describes a two-market environment, with capital heavily concentrated in AI. For founders, the budgeting implication is to make the company’s category and capital plan explicit. A rising headline market does not imply all sectors, stages, or geographies have equal access. Do not build a cash plan that assumes the aggregate dollars will flow to your company. Track the actual investor universe, meeting progression, and check-size fit, and maintain an operating plan that can tolerate delays. Public market statistics add context; the cash forecast remains the instrument that protects the company.
Runway scenarios are the operating core
Runway is not simply cash divided by the current monthly burn when burn is changing, annual bills are lumpy, or revenue collection is uncertain. Budget a base case, a slower-growth case, and a financing-delay case. Each should reflect hiring dates, customer payment timing, committed obligations, and the minimum operating team needed to preserve product progress. The forecast should show the date at which the company must begin a raise, not only the date it expects to run out of cash. SVB’s 2025 Venture-Backed CFO Report describes cash runway as a pressure point even as profitability improved in 2024. The source’s survey is useful directional context, but individual runway assumptions must come from company books. Set monthly owners for actuals and forecast updates, and define a trigger to slow discretionary spend. A useful board view shows runway in months and the specific actions the team takes if fundraising slips by one or two quarters.
Measure fundraising as a funnel
A raise has observable stages: target investor identified, warm introduction or qualified outreach, first meeting, partner meeting, diligence, term sheet, and close. Track count and conversion between stages, elapsed time, check size, fit, and the reason a process stalls. Keep a source field and next step for each investor. This is operational data, not a substitute for an attractive business; it helps the team spend leadership time deliberately and identify whether the outreach thesis is working. Before setting a fundraising budget, estimate the founder and executive hours needed to run the process, legal and accounting readiness, and the cost of maintaining operations while meetings happen. Tie the pipeline to the cash forecast. If the company has not seen progression after a planned number of qualified conversations, revisit targeting, story, or timing rather than simply increasing outreach volume. A well-maintained funnel can improve learning even if the company decides to delay the raise.
Fund a measurable decision: Specify what will be learned, who will review it, and what changes the allocation. This prevents a market reference becoming an unsupported target.
| Scenario variable | Base case | Downside case |
|---|---|---|
| Raise timing | Plan date | One- or two-quarter delay |
| Round size | Milestone funding need | Smaller close or staged financing |
| Ownership | Current modeled terms | Alternative valuation and pool assumptions |
| Operating response | Approved hiring plan | Named spend or hiring triggers |
Keep the source qualifier attached: The same number can mean very different things across populations and instruments.
| Funding signal | 2025 source reading | How not to over-read it |
|---|---|---|
| US$320B deployed | NVCA U.S. venture market | Does not equal a startup’s available capital |
| 65.4% AI deal share | NVCA reported deal value share | Not the share for every sector |
| US$10.4B pre-seed | Carta platform SAFE/note data | Not comparable to priced-round valuation |
Keep instruments and stages separate
Carta’s State of Pre-Seed 2025 reports U.S.-based startups on its platform raised $10.4 billion across 50,316 SAFEs and convertible notes. It also reports a 1% decline in cash invested year over year and a 13% decline in instrument count. Those are pre-seed instruments, not a priced-round valuation benchmark. A SAFE’s cap, discount, and conversion mechanics do not map cleanly onto a priced financing’s post-money valuation or dilution. Track instrument type, date, principal, cap, discount, and conversion assumptions in a current cap table. Before a new raise, model how existing instruments convert under several plausible financing terms. Avoid representing the number of securities as a count of independent investors or using total dollars raised as proof of typical check size. The source population and the company’s legal documents define what the figures mean.
Budget for the data room before the raise
Investors commonly need a stable view of financial statements, forecast, customer and revenue metrics, product roadmap, ownership, legal records, and material contracts. The appropriate data room varies, but the underlying records should agree. Allocate recurring staff time to close books, maintain a metric dictionary, reconcile customer lists to revenue, document cohort definitions, and update cap-table records. An investor-ready chart that cannot be reproduced from source systems creates avoidable diligence risk. The goal is not to overproduce a polished deck at the expense of accuracy. Start with a clear owner for each metric, its source of truth, refresh timing, and a note describing changes in definitions. Then use the investor narrative to explain the few measures most relevant to the business model. If a key metric is unavailable, disclose that limitation rather than manufacturing precision. Preparation is an operating capability with ongoing cost, not a last-minute design task.
Choose the right operating metrics for the business
The metric set should follow the company’s economic engine. A usage-based SaaS business may track expansion, gross and net retention, consumption, and gross margin. A marketplace may need liquidity, repeat behavior, take rate, and contribution margin by cohort. A deep-tech company may need milestone, deployment, and capital-intensity evidence. Public VC reports cannot supply these internal definitions. Maintain a hierarchy: leading indicators that management can change, lagging financial results, and capital-efficiency measures that explain how much runway is consumed to reach the next milestone. Select a small number of metrics for the board and retain a fuller operating dashboard for managers. Establish the calculation method before a fundraising cycle starts. When a definition changes, annotate historical periods and explain why, rather than silently rewriting the chart.
A quarterly measurement-budget review
Every quarter, compare the cost and effort of measurement with decisions it supports. Does the company need a better billing-to-analytics reconciliation, a cohort analysis, a cap-table review, or a fundraising CRM? Sequence the work by the next financing milestone and the risk of not knowing. Avoid purchasing a complicated analytics stack if a controlled spreadsheet and clear ownership would answer the decision. Conversely, do not underbudget finance labor when a large customer base or multiple instruments make manual data error-prone. The review should confirm that current market facts are still current and that the team has not adopted a stale public median as a target. For instance, Carta’s 2025 dilution data gives a reference point, while a new financing round depends on terms, stage, investor demand, and company performance. Revisit the assumptions whenever the financing environment or company plan materially changes. This keeps budget linked to decisions rather than vanity dashboards.
Frequently Asked Questions
What VC metrics should a founder budget to track?
At minimum: cash, burn, runway scenarios, revenue and margin, a stage-appropriate operating metric, cap table and instrument records, and a fundraising pipeline with stage progression.
Does 16% dilution mean founders should sell 16% in a round?
No. Carta’s 2025 median across seed through Series C is market context. Actual dilution depends on round terms, valuation, option-pool changes, convertibles, and company circumstances.
How much venture capital was deployed in 2025?
NVCA’s 2026 Yearbook reports US$320 billion deployed in the U.S. venture market in 2025. This aggregate should not be treated as accessible capital for every startup.
Are SAFE statistics comparable to priced rounds?
No. Carta’s pre-seed 2025 figures count SAFEs and convertible notes. Their mechanics differ from a priced equity round; model conversion terms and dilution separately.
Sources
Carta — State of Startups 2025
Carta — State of Private Markets: 2025 in Review
Carta — State of Pre-Seed 2025
NVCA — 2026 Yearbook
SVB — Venture-Backed CFO Report 2025
NVCA — PitchBook-NVCA Venture Monitor
Web Tonic — budgeting and forecasting
Web Tonic — data intelligence
Web Tonic — contact
Federal Reserve — Economic Well-Being of U.S. Households
Federal Reserve — Economic Well-Being of U.S. Households
CB Insights — State of Venture 2025
Google Analytics — measurement guidance
Y Combinator — SAFE documents
NVCA / PitchBook — Q4 2025 Venture Monitor


