



Table of contents

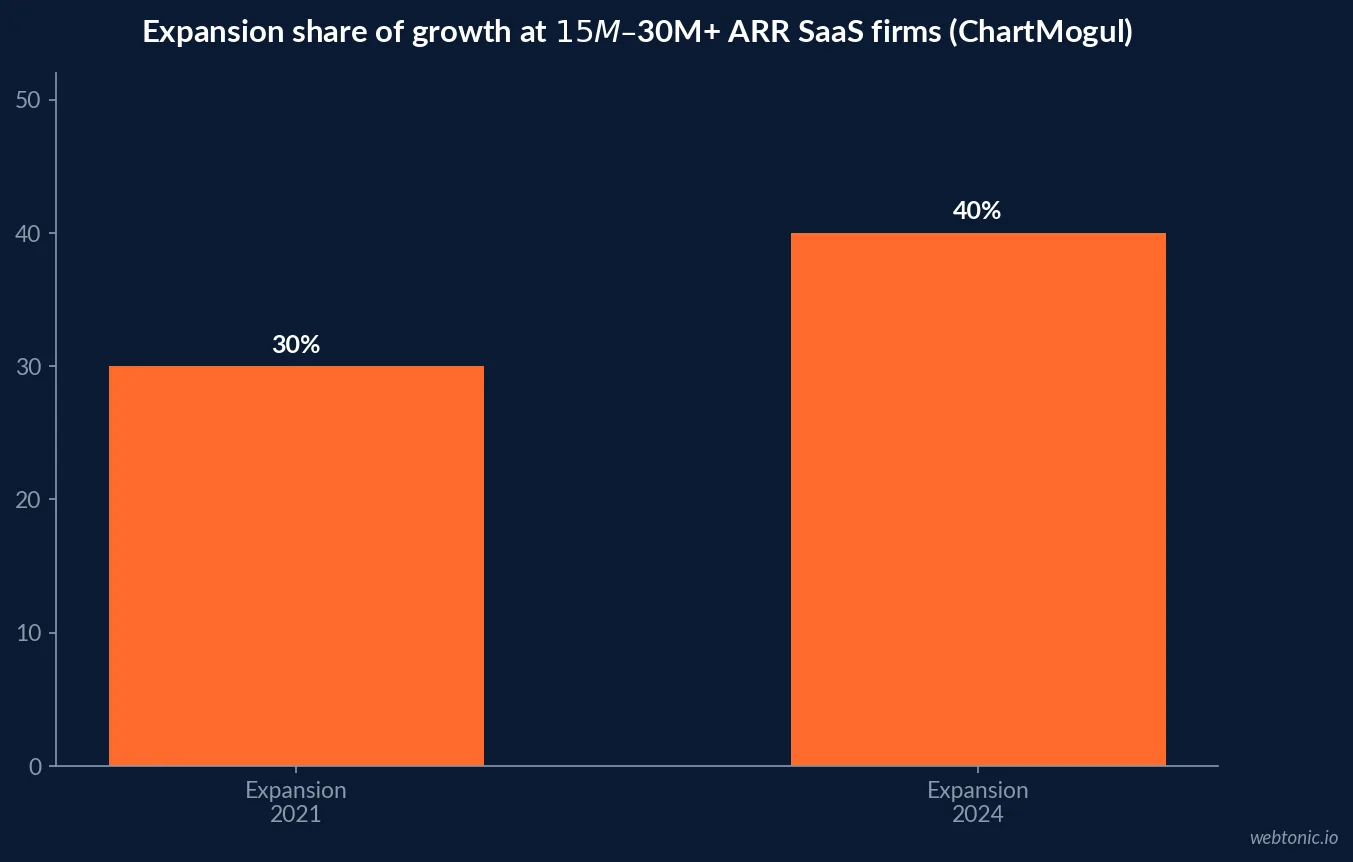
Upselling is a merchandising and monetization decision, not a universal growth multiplier. In ChartMogul’s 2024 SaaS retention research, expansion drove 40% of growth at businesses with $15M–$30M+ ARR, compared with 30% in early 2021; that is a company-scale revenue mix, not an expected lift from a single offer.
Key Takeaways
- 40% of growth at SaaS companies with $15M–$30M+ ARR came from expansion in ChartMogul’s 2024 report.
- Expansion is broader than upselling: it includes account growth and other expansion movements.
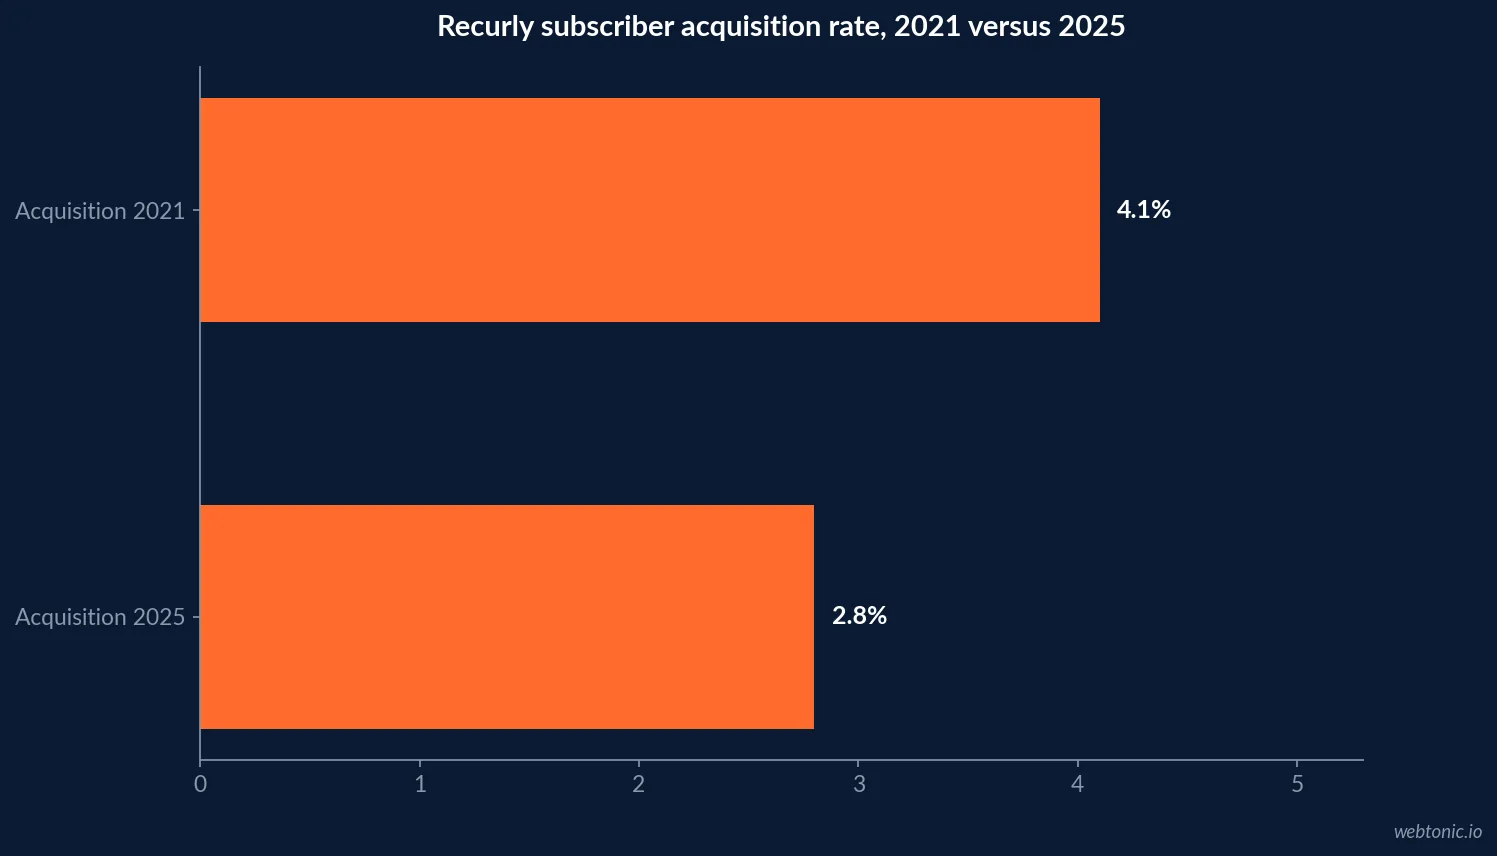
- Recurly’s 2025 report covered 67 million subscribers and says acquisition rates fell to 2.8%, making retention strategy more salient.
- Track incremental contribution margin, not only offer acceptance or average order value.
- Separate upgrade, cross-sell, add-on, and renewal motions before setting targets.
- A post-purchase recommendation and an in-checkout add-on have different risk and intent.
- Start with a holdout or randomized test; report the net effect against a comparable control.
- An offer that raises basket size but increases returns or cancels can reduce contribution.
- For subscriptions, analyze renewal cohorts and downgrade/churn alongside expansion.
- Use category-specific baselines; do not transfer SaaS expansion shares to retail orders.
- Document eligible traffic, offer exposure, acceptance, margin, refunds, and time window.
- Budget test design and measurement before adding recommendation technology.
- Recurly reports subscriber acquisition rate of 2.8% in 2025, down from 4.1% in 2021.
- ChartMogul studied more than 2,500 SaaS businesses for its retention report.
- Use a staged rollout only after incremental value, not attributed revenue alone, is established.
Evidence references: ChartMogul — SaaS Retention Report: The New Normal (2024) · Recurly — 2025 Industry Report · Shopify — Upselling: Meaning and Techniques (2025).
Related: data intelligence · growth marketing · measurement and experiment planning.
Benchmarks at a glance
Use the source column as a scope label: unlike an ad benchmark, each row describes a different market and instrument. Treat reported outcomes as signals for test design, not forecast inputs. Where data describes a particular company or cohort, keep that qualifier with the number rather than converting it into an across-market norm.
| Evidence / metric | Published figure | Population and year | Interpretation |
|---|---|---|---|
| Expansion share of growth | 40% | SaaS firms $15M–$30M+ ARR, 2024 | Company growth composition; not offer lift |
| Prior expansion share | 30% | Same ARR band, early 2021 | Historical comparison in same report |
| Subscriber acquisition rate | 2.8% | Recurly report, 2025 | Down from 4.1% in 2021 |
| Retention dataset | 67 million | Subscribers covered, Recurly 2025 | Vendor report scope |
| Retention report sample | 2,500+ | SaaS businesses, ChartMogul 2024 | Source describes company sample |
Reading the evidence boundary: Keep population, period, unit, and decision owner visible when comparing internal results with published evidence.
| Measure | Calculation boundary | Risk to watch |
|---|---|---|
| Offer acceptance | Accepted offers / eligible exposures | Do not use all site visits as denominator |
| Incremental margin | Treatment contribution less control contribution | Revenue may rise while margin falls |
| Renewal health | Renewal, downgrade, and cancellation by cohort | Short windows miss delayed churn |
| Customer friction | Returns, complaints, and support contacts | A high take rate can still harm trust |
Operating workflow: Separate the recurring work from the decision it supports.
| Lifecycle stage | Typical upsell objective | Outcome to protect |
|---|---|---|
| Checkout | Relevant add-on | Core purchase conversion |
| Onboarding | First successful upgrade | Activation and early return |
| Renewal | Plan or term change | Renewal and cancellation |
| Expansion | More usage or seats | Gross margin and service load |
What the published numbers do—and do not—measure
The phrase “upsell statistics” often bundles unlike outcomes: a subscription tier upgrade, an accessory attached to a cart, a second item recommended after purchase, or account expansion recorded in monthly recurring revenue. Each has a different denominator and time horizon. A take rate among exposed visitors is not a take rate across all customers; a percentage of new annual recurring revenue is not a percentage of sales caused by a specific prompt. Before turning any figure into a plan, identify the population, period, and comparison group. ChartMogul’s 2024 analysis reports that companies in the $15M–$30M+ ARR group sourced 40% of growth from expansion, up from 30% in early 2021. Its subject is company-level SaaS revenue composition. This is useful evidence that installed-base revenue can matter at scale; it is not proof that placing an upsell banner produces a 40% lift. Mark the distinction in dashboards and executive decks.
Expansion revenue is a portfolio outcome
Expansion can arise from more seats, higher usage, a tier move, add-on modules, or additional purchases by an existing buyer. In SaaS reporting it is commonly evaluated alongside new business, contraction, churn, and reactivation. ChartMogul’s published research says firms with $15M–$30M+ ARR had 40% of growth driven by expansion in 2024, compared with 30% in early 2021. The comparison signals a change in growth composition over time, not a universal causal payoff for upselling. A founder budgeting against this data should first inspect account-level revenue movement. The business may already have strong expansion through usage or seat growth, leaving little opportunity for another prompt. Conversely, a high gross retention rate and natural product adjacency can justify a carefully scoped offer test. The right budget depends on addressable accounts, expected margin, build effort, and the cost of interfering with the core customer journey.
The subscription context changed
Recurly’s 2025 Industry Report describes evidence based on 67 million subscribers and states that subscriber acquisition rates were 2.8%, down from 4.1% in 2021. That makes keeping and developing existing subscriber relationships a rational strategic question, but the result should not be read as a prescribed upsell rate. Subscription brands can test plan changes, add-ons, pauses, annual prepayment, and bundles; each choice affects retention and cash timing differently. Separate a voluntary increase in product value from a discount-driven renewal rescue. Measure the full path: eligible base, exposure, accepted offer, realized revenue, gross margin, subsequent renewal, downgrade, refund, and cancellation. A short campaign may show more upgrades while quietly bringing forward churn or eroding a later full-price renewal. Use cohort windows long enough to see whether the offer changed customer behavior, not merely when revenue was booked.
A test budget should buy a decision
Budgeting for an upsell program means allocating resources to research, implementation, inventory or product readiness, measurement, and iteration—not simply buying an app or adding an extra line to paid media. Define one hypothesis, such as “customers who reach a usage threshold may value the next tier,” then price the minimum instrumentation and experience needed to test it. For retail, a low-risk cart add-on might need clear relevance and inventory data; an account expansion motion may require customer success capacity and a renewal calendar. Before committing to a permanent build, compare likely incremental gross profit with engineering, creative, support, and operational costs. Use a conservative scenario based on eligible traffic and a deliberately small acceptance assumption. Do not use industry-wide revenue shares as the assumed conversion rate. If a properly powered test would be too costly, use qualitative customer interviews and a smaller pilot to de-risk the next investment.
The metric stack for an offer test
A useful scorecard includes exposure rate, eligible population, offer acceptance, incremental order or account value, contribution margin, refunds, returns, cancellations, and repeat purchase or renewal. These should be reported by customer segment and offer placement. A checkout upgrade can have a high accept rate but mostly capture customers who would have bought the higher tier anyway; an experiment with a control group helps distinguish that selection effect from genuine incrementality. For subscriptions, reconcile the event-level offer with recurring revenue movement and keep expansion, reactivation, and new-logo acquisition separate. For ecommerce, compare net merchandise margin after discounts, fulfillment, and returns. Show absolute volume next to percentages, so a small segment does not look like a company-wide win. Agree on the observation window in advance and avoid repeatedly checking an underpowered test until a favorable result appears.
Fund a measurable decision: Specify what will be learned, who will review it, and what changes the allocation. This prevents a market reference becoming an unsupported target.
| Decision stage | Fund this work | Decision to make |
|---|---|---|
| Discovery | Eligibility and offer research | Does the offer solve a real customer need? |
| Pilot | Instrumentation and limited creative | Is there incremental value versus control? |
| Scale | Capacity, inventory, and refresh plan | Does marginal value persist at more volume? |
Keep the source qualifier attached: The same number can mean very different things across populations and instruments.
| Evidence boundary | Safe use | Unsafe shortcut |
|---|---|---|
| 2024 expansion share | Compare SaaS revenue composition | Call it individual offer uplift |
| 2025 acquisition-rate context | Explain retention pressure | Set an upsell target |
| Merchant case study | Generate test hypothesis | Forecast another store’s result |
Which motion fits which customer moment?
The best moment depends on the evidence of need. An upgrade at a usage ceiling may solve a real constraint; an accessory suggestion beside a compatible product may complete a job; a post-purchase offer can work when it does not interrupt confirmation or support. Renewal-stage cross-sells need a clear connection to the original value proposition. Build a journey map that lists the triggering behavior, proposed value, exposure channel, and a stop condition for every motion. Segment by observed product use or declared needs, not sensitive inferences. Keep the original purchase path easy to complete. If the recommendation is irrelevant, repetitive, or presented too aggressively, short-term order value can come at the cost of trust. An experiment should track complaints and support contacts as guardrails, not only clicks. Make it possible for customers to dismiss an offer without losing access to what they already selected.
Common statistical traps
The most circulated upsell claims frequently lack a clear denominator or causal method. A case study may demonstrate what happened at one merchant after a bundle or checkout redesign; it does not establish the expected result for a different catalog, price point, or traffic mix. Vendor research may be valuable, but read the sample and sponsor context. Even strong expansion benchmarks do not separate the influence of product adoption, pricing changes, and customer mix unless the source explicitly does so. Avoid multiplying the size of the eligible audience by a best-case take rate from another company. That calculation creates an attractive spreadsheet, not a forecast. Instead, use your own historical cohort, identify a control, and present a range that includes a downside case. If a published figure has no accessible methods, label it as directional or omit it. The honest report may be that no transferable public baseline exists for this exact offer.
A practical prioritization model
Rank ideas by customer value, measurable eligibility, expected gross margin, implementation complexity, and risk to the primary journey. A clear tier boundary or product pairing is often easier to test than an algorithm that requires new data infrastructure. Estimate the smallest useful audience, the number of exposures needed to distinguish plausible outcomes, and the operational changes if the test wins. Prioritize tests that answer a real product or pricing question, not only those that produce a higher click-through rate. For each candidate, write down a stop rule: a decline in core conversion, rising refunds, a support burden, or a low margin can outweigh incremental revenue. Use a pre-registered decision threshold and state whether the test is exploratory or confirmatory. Once the pilot is complete, translate findings into a revised operating budget and a named owner. Do not roll out merely because an offer is easy to configure.
A quarterly review that keeps evidence honest
Review the offer portfolio at least quarterly, grouping results by motion and customer lifecycle stage. Show the baseline and treatment, not only the winning cell. Reconcile reported uplift with finance’s net revenue and margin records. Revisit eligibility when products, plan limits, fulfillment costs, or customer mix change. If two offers overlap, evaluate whether they compete for the same moment or create a coherent sequence. For teams with limited data volume, longer observation and directional qualitative evidence may be more appropriate than declaring a winner from a few conversions. Maintain a short evidence register with source date, sample, metric definition, and the assumptions used to make a budget decision. This prevents a 2024 benchmark from silently becoming a 2026 target. Use the numbers to frame the decision, then let a transparent experiment decide whether the specific upsell deserves ongoing investment.
Frequently Asked Questions
Is 40% a normal upsell conversion rate?
No. ChartMogul’s 40% figure describes the share of growth from expansion at SaaS companies with $15M–$30M+ ARR in 2024. It is not an offer acceptance or conversion benchmark.
What is the best metric for an upsell?
Use incremental contribution margin against a control, with conversion, refunds, cancellations, and renewal as guardrails. AOV alone cannot show whether the offer caused new value.
How much should a company budget for upselling?
There is no defensible universal budget. Estimate the cost of the smallest measurable pilot from eligible audience size, required engineering, creative, customer support, and analysis.
Should upsells be measured at checkout or after purchase?
Both can be tested, but report them separately. They reach customers at different intent moments and can affect checkout completion, returns, and satisfaction differently.
Sources
ChartMogul — SaaS Retention Report: The New Normal (2024)
Recurly — 2025 Industry Report
Shopify — Upselling: Meaning and Techniques (2025)
ChartMogul — SaaS Benchmarks Report
Recurly — Ecommerce Subscription Management
Shopify — Post-purchase upsells
Web Tonic — measurement strategy
Web Tonic — data intelligence
Web Tonic — growth marketing
Optimizely — A/B testing methodology
Optimizely — A/B testing methodology
Google Analytics — experiment measurement guidance
Federal Reserve — household financial well-being
BigCommerce — Ecommerce upsell and cross-sell guidance
Shopify — Checkout conversion research


