



Table of contents

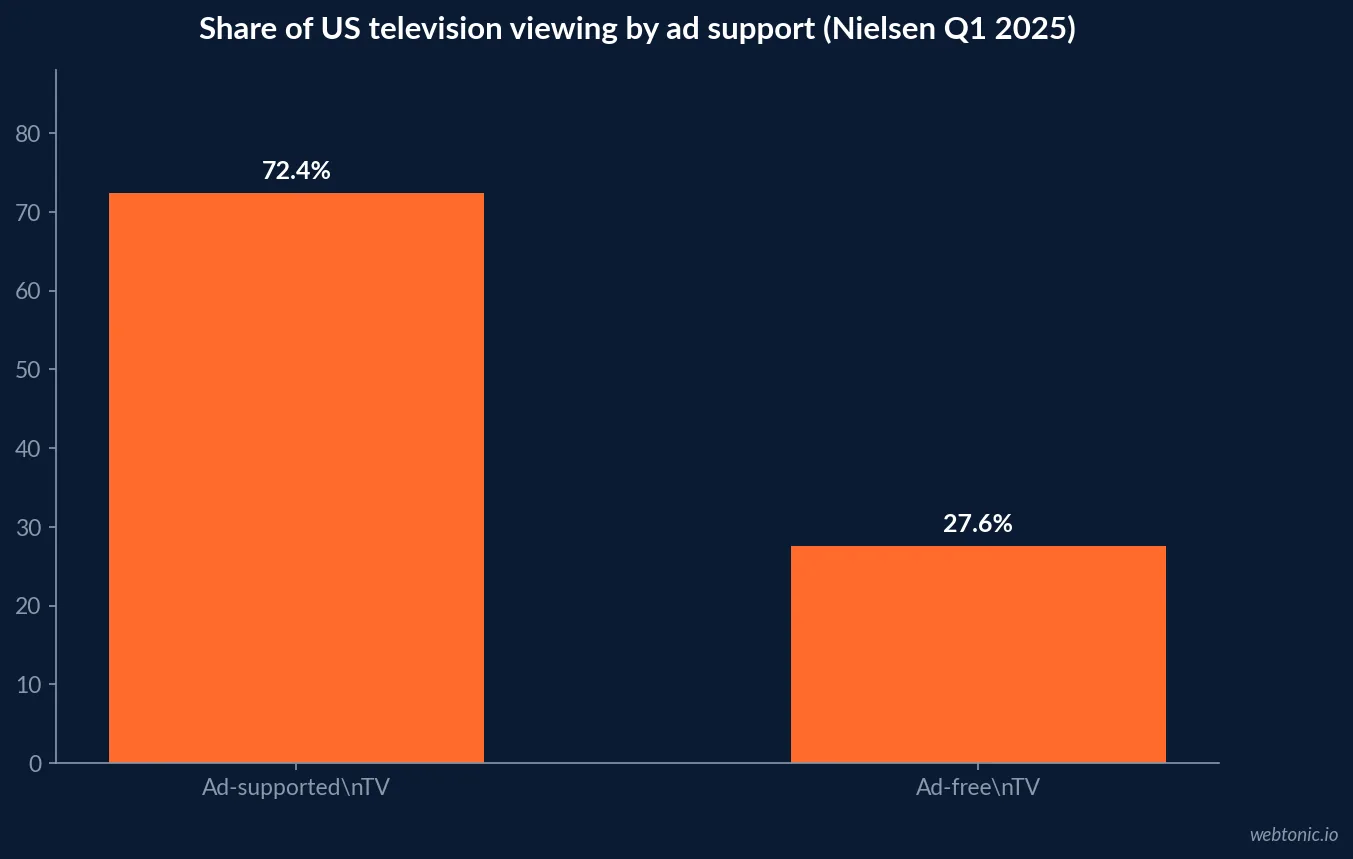
Television remains a mass-reach channel, but today’s “TV” is not one audience or one inventory pool. Nielsen measured 72.4% of U.S. TV viewing on ad-supported services in Q1 2025; a marketer should read that beside platform reach, campaign delivery and the target group—not as a guarantee of reach for any single spot.
Key Takeaways
- 72.4% of U.S. television viewing was ad-supported in Q1 2025, according to Nielsen.
- 27.6% was ad-free in the same measure—an important distinction from total viewing.
- Broadcast and cable were 57.6% of ad-supported TV time in Nielsen’s May 2025 analysis.
- 88% of U.S. viewers engaged with TV monthly in Nielsen’s October 2024 snapshot.
- TV still represented about half of Americans’ media time in Nielsen’s Q1 2024 data.
- 82% said linear TV ads influenced their online search selections in the TVB 2025 Purchase Funnel Study.
- 43% named TV the most important awareness influence across surveyed media in the TVB 2025 study.
- UK linear TV and broadcaster VOD reached 87.8% of adults weekly in 2025, Thinkbox reports.
- Digital video was projected to take 58% of U.S. TV/video ad spend in 2025 in IAB’s April forecast.
- Reach, impressions, viewing share and response are four different measures.
Start with the denominator, not the headline
Television statistics often appear to disagree because their denominators differ. A viewing-share estimate asks what proportion of TV-set time went to a category. A reach estimate asks what share of a defined population watched at least a minimum duration during a period. A campaign report may instead count delivered impressions or deduplicated people. Those can all be correct at once.
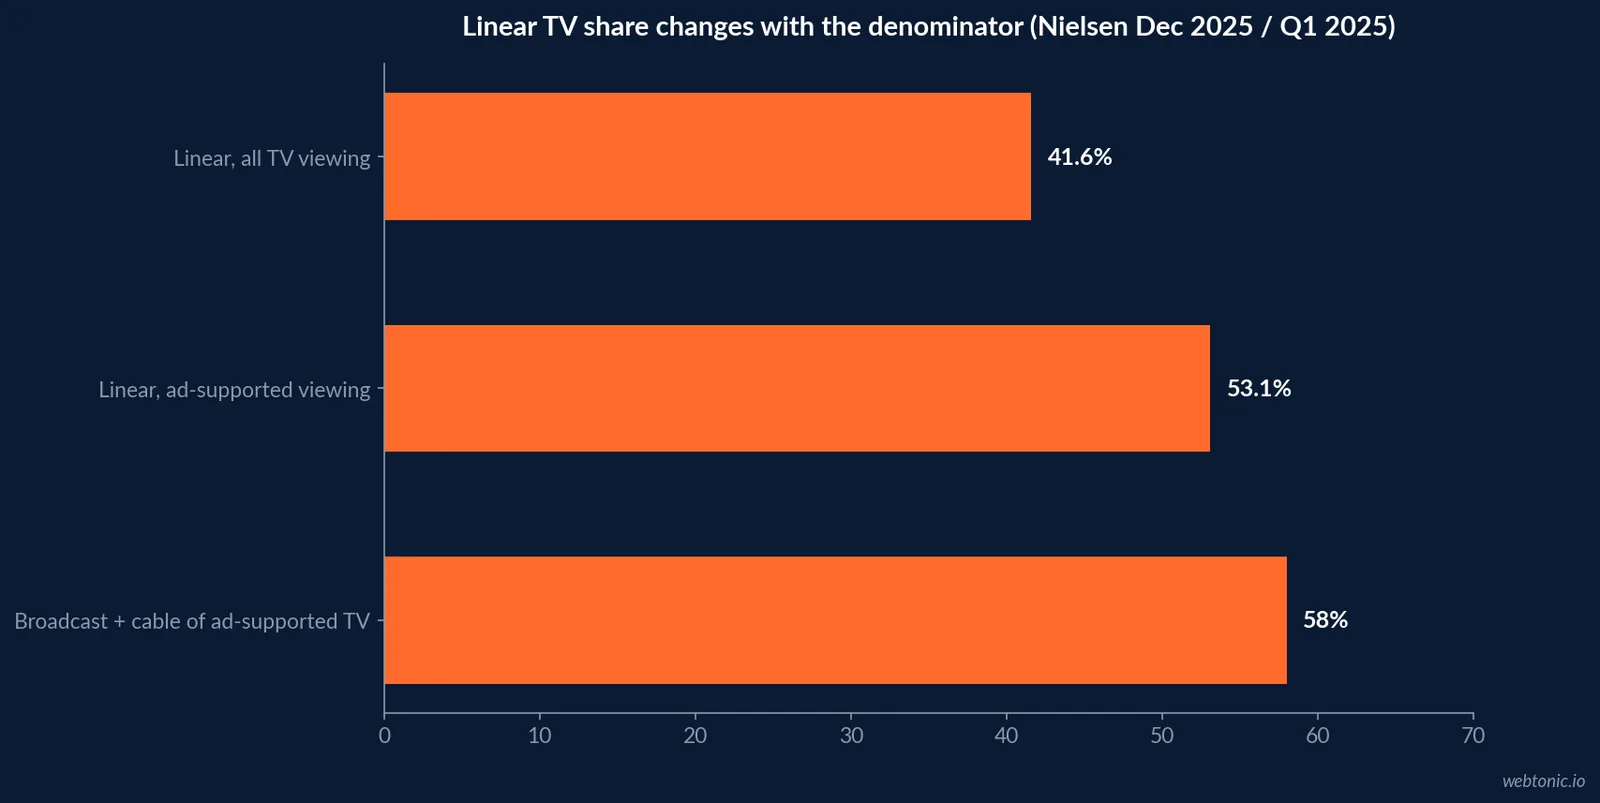
Nielsen’s first Ad-Supported Gauge reported that 72.4% of U.S. TV viewing was ad-supported in Q1 2025. That describes where viewing happened, not how many people an advertiser reached. Nielsen’s separate classic Gauge for May 2025 showed broadcast and cable at 44.5% of all TV-set time; its ad-supported view showed broadcast and cable at 57.6% of that narrower ad-supported pool. The same viewing can produce different percentages when ad-free streams are excluded.
For planning, write the universe beside every number: U.S. persons 2+, adults 18+, households, TV-set viewing, or a named platform’s monthly active audience. Add the period and the minimum viewing threshold. Without those details, the statistic is not a usable benchmark.
Television is an ecosystem, not a channel label
In current media plans, “TV” can mean broadcast networks, local stations, cable, broadcaster video-on-demand (BVOD), subscription streaming with ads, free ad-supported streaming television (FAST), or connected-TV (CTV) inventory. Some video is watched on a TV set but bought and measured as digital video; some broadcaster content is watched on a phone. Device, content owner and buying method are separate dimensions.
Nielsen’s Ad-Supported Gauge exists precisely because the broad total-viewing Gauge includes ad-free viewing. In its Q1 2025 release, traditional broadcast and cable each contributed about 29% of viewing, together making up 58% of ad-supported TV. Nielsen’s later analysis of May data placed linear at 57.6% of ad-supported viewing. The figures are point-in-time snapshots, not annual campaign delivery guarantees.
Every brief should name the inventory: local broadcast, national linear, BVOD, CTV, or a combined video plan. That small discipline stops a large planning error—comparing a platform’s share of all viewing with another platform’s share of ad-supported inventory.
| Measure | Published figure | Universe / date | What it means |
|---|---|---|---|
| Ad-supported TV time | 72.4% | U.S. TV viewing, Q1 2025 | Inventory environment |
| Ad-free TV time | 27.6% | U.S. TV viewing, Q1 2025 | Viewing outside ad-supported pool |
| Broadcast + cable | 57.6% | Ad-supported TV, May 2025 | Linear share within eligible viewing |
| Broadcast + cable | 44.5% | All TV-set time, May 2025 | Same channels, wider denominator |
| Monthly TV engagement | 88% | U.S. viewers, Oct. 2024 | Nielsen monthly audience estimate |
Reach still matters—but define the reach
TV’s mass-audience case rests on a combination of broad availability, shared viewing and scheduled moments. Nielsen’s January 2025 planning guide said 88% of U.S. viewers across ages engaged with TV monthly, citing October 2024 data; it also said television represented about half of Americans’ total media time in the first quarter of 2024. These are ecosystem-level signals. They do not tell a buyer whether a specific show, DMA or spot schedule reaches the right customer.
The 2025 TVB Media Comparisons Study commissioned GfK/NIQ to survey more than 4,000 U.S. adults across more than 20 platforms. TVB reports that broadcast TV had the highest reach and time spent among platforms measured, across age groups and categories. The study’s online sample was collected in November and December 2024. Its result is useful directional context, but it is an industry-sponsored survey; independent audience measurement and campaign-level delivery should determine the buy.
For an operator, reach has practical value when it is paired with frequency. If a campaign reaches few people too often, frequency can inflate without much net-new audience. If the schedule spreads too thinly, the campaign may never accumulate enough exposures to be remembered. Plan reach and frequency against the same target audience and period before comparing vendors.
Mass reach is not the same as unique incremental reach
A linear buy can deliver broad reach quickly, but the incremental question is what it adds after other channels. The duplicated audience between broadcast, CTV, online video and social video is material: a household may see the same person use multiple screens, and platform-reported reach can count that person more than once. Deduplicated cross-media measurement is therefore not a cosmetic reporting preference; it changes the answer to “how many new people did TV add?”
TVB’s 2025 cross-media materials report a finding that 65% of people reached by the average of 337 randomly selected four-media campaigns were reached only by linear TV. The claim is based on the campaign sample analyzed for the study and should not be generalized to every advertiser or media mix. Treat it as evidence that linear can contribute distinct audiences in some plans—not as a universal 65% reach lift.
Model the overlap using your actual target group and planned channels. If consistent deduplicated measurement is unavailable, label the estimate clearly, use comparable panel or reach-planning data, and avoid adding platform-reported reach totals as if they were unique people.
TV can create search activity downstream
Television is often evaluated as a last-click channel even when it introduces or legitimizes a brand earlier in the journey. In TVB’s 2025 Purchase Funnel Study, 82% of respondents said linear TV ads influence their online search selections. The same study reports that 43% selected linear TV as the most important influence on awareness, while paid streaming with ads was selected by 6% for that stage.
These are self-reported survey responses, not causal attribution. Still, they give planners a reason to coordinate creative, brand search, landing pages and local offers around the TV flight. Search volume, branded query share, direct traffic and store-level demand can be useful complementary signals when a holdout or geo test is not practical.
A useful measurement stack distinguishes exposure, attention, consideration and response. Reach and frequency describe delivery; brand lift or search behavior can indicate intermediate response; qualified leads, sales or incremental revenue provide outcomes. Do not collapse the layers into a single “TV ROI” figure without a transparent attribution method.
Audience composition changes the answer
Average reach can hide meaningful age and market differences. TVB’s 2025 Purchase Funnel report spans automotive, banking and finance, home furnishings, legal, quick-service restaurants and retail; its study summary says linear TV remained the most important influence through the purchase stages and that, among people who said TV mattered most for awareness, seven in ten chose broadcast over cable. A national average can mask category-level variation, however.
For younger viewers, “TV” may include substantial on-demand and streaming behavior. Thinkbox’s 2025 UK TV Viewing Report says video-on-demand represented 69% of Total TV viewing among 16–34-year-olds. That is a viewing mix statistic, not an ad reach statistic. It points to a practical segmentation move: define whether the audience is reachable through linear, BVOD, CTV or a blend before deciding that television is either “old media” or a single solution.
Geography matters too. Local broadcast can offer regional news environments and market-specific reach; national streaming may scale across regions but use different audience definitions. For multi-market advertisers, compare market-level availability, daypart, language, and audience composition rather than borrowing a national average.
Daily consumption is changing, not disappearing. Attest’s 2025 U.S. Media Consumption Report surveyed 2,000 U.S. consumers aged 18–67 in March and April. It found 56% watched at least three hours of TV of any type per day, down from 61% in 2024 and 63% in 2023. The figure includes all types of television and is self-reported; it differs from Nielsen’s metered viewing share.
Attest also found 28% said they generally watched no live TV on an average day, compared with 24% in 2024. Among under-30s, 41% reported no live-TV viewing on an average day. That is a practical cue to plan by age and viewing mode: live linear may remain useful for some audiences and moments, while streaming and on-demand formats matter more for others.
| Daily viewing signal | 2025 | 2024 comparison | Survey universe |
|---|---|---|---|
| Watch 3+ hours of TV of any type | 56% | 61% | Attest, U.S. ages 18–67 |
| Generally do not watch live TV on an average day | 28% | 24% | Attest, U.S. consumers |
| Under-30s with no live TV on average day | 41% | Attest study | U.S. consumers under 30 |
| Streaming TV 1–2 hours daily | About one third | — | Attest, U.S. consumers |
| Planning dimension | Question to resolve | Evidence to request | Common error |
|---|---|---|---|
| Audience | Who counts as target? | Age, geography, household/person basis | Calling households “people” |
| Period | What is the flight window? | Weekly / monthly / campaign dates | Comparing different windows |
| Platform | Which TV inventory? | Broadcast, cable, BVOD, CTV, FAST | Treating all video as TV |
| Reach | How are unique viewers deduped? | Panel / census / cross-media method | Adding platform totals |
| Response | What outcome is expected? | Search, leads, sales, lift test | Attributing all sales to exposure |
How audience definitions shift by market
Cross-country figures can illustrate different viewing environments, but they should not be combined into one total. Thinkbox’s 2025 UK report says linear TV and broadcaster video-on-demand reached 87.8% of UK adults weekly; Attest surveyed U.S. consumers and found more than half reported several hours of daily TV. Those sources use different populations and methods. Use them to shape local questions, then ask the market’s measurement provider for a comparable campaign forecast.
| Market evidence | Figure | Issuer / study date | Use with care |
|---|---|---|---|
| UK linear TV + BVOD weekly reach | 87.8% | Thinkbox / UK, 2025 | Not U.S. reach |
| U.S. TV monthly engagement | 88% | Nielsen, Oct. 2024 snapshot | Not campaign reach |
| U.S. watch 3+ hours TV daily | 56% | Attest, 2025 survey | Self-reported duration |
| U.S. no live TV on average day | 28% | Attest, 2025 survey | Does not mean no streaming TV |
| U.S. ad-supported TV time | 72.4% | Nielsen, Q1 2025 | Viewing share, not unique viewers |
Where the ad dollars are moving
Audience behavior and media allocation are related but not identical. IAB’s July 2025 Digital Video Ad Spend & Strategy Report, developed with Advertiser Perceptions and Guideline, said digital video was projected to capture 58% of total U.S. TV/video ad spend in 2025. It also estimated digital video spending at USD 64 billion in 2024, with a forecast of USD 72 billion for 2025. These figures combine CTV, social video and online video; they should not be described as CTV-only budget or broadcast TV spend.
That allocation shift does not mean linear has ceased to matter. Nielsen’s May 2025 reading put broadcast and cable at 57.6% of ad-supported viewing. The apparent tension is instructive: where people spend ad-supported time and where advertisers place budgets are distinct measurements. Buying decisions also depend on audience targeting, pricing, creative suitability, measurement and buying access.
Build plans from the objective outward. A marketer seeking broad awareness may use linear plus digital extension; a direct-response team may prioritize addressable inventory and measurable conversion paths; a local operator may start with market reach and schedule fit. Compare incremental audience and outcome evidence rather than debating labels.
| Statistic | Figure | Year / scope | Planning interpretation |
|---|---|---|---|
| Digital video share of TV/video ad spend | 58% forecast | U.S., 2025 | Budget shifts toward digital video |
| Digital video ad spend | USD 64B | U.S., 2024 estimate | Includes CTV, social and online video |
| Digital video spend forecast | USD 72B | U.S., 2025 forecast | Forecast, not audited final spend |
| TV/video share comparison | 58% vs 42% | Nielsen ad-supported TV May 2025 | Viewing share, not spend share |
| Linear TV + BVOD weekly reach | 87.8% | UK adults, 2025 | Different country and definition |
What television advertising can and cannot prove
Television research can describe audience availability, reported influence, share of viewing, ad-supported supply and modeled campaign reach. It may not by itself establish causal lift for a particular advertiser. A study commissioned by a trade body or platform can be informative, but a marketer should inspect the sample, question wording, measured population and sponsor before extending a result beyond its scope.
When the objective is incremental sales, design the measurement before the campaign. Options include matched-market tests, randomized audience exposure where available, brand-lift surveys, controlled search analysis or a well-specified marketing-mix model. The method should match the time horizon: some brand effects are not visible in a short direct-response window.
Keep operational reporting honest. Report delivered impressions and reach with the vendor’s definitions; show the estimated deduplication method; separate observed conversions from modeled outcomes; and state when data is unavailable. This creates a benchmark that is useful for the next flight instead of a success story that cannot be repeated.
How to evaluate a television plan
- Set a target universe. Name age, geography, household/person basis and any buyer segment.
- Choose the inventory definition. Separate broadcast, cable, BVOD, CTV, FAST and online video.
- Ask for reach and frequency together. Request period-specific figures and the minimum exposure threshold.
- Estimate overlap. Understand how the plan deduplicates exposure across linear and digital video.
- Connect to the journey. Align creative with branded search, landing pages, store activity and sales measurement.
- Record provenance. Save source, date, sample and methodology beside each benchmark.
For measurement support, explore Web Tonic’s data intelligence service and growth marketing practice. A media plan is stronger when the KPI and tracking choices are settled before the first spot runs.
Key questions for media sellers
Before approving a proposal, ask what makes a viewer “reached,” whether viewing is live or time-shifted, how co-viewing is handled, and whether the metric includes ad-free time. Ask for the eligible inventory universe and whether reported viewers are measured, modeled or platform-declared. In a combined TV/CTV proposal, request the role and reported reach contribution of each component.
Ask how the seller handles makegoods, audience guarantees and underdelivery; whether reach is guaranteed at the target demographic or only a broader universe; and what reporting is available after the campaign. The answers need not be identical across vendors, but the differences should be explicit before price comparisons.
Finally, keep creative and audience context in view. A broad reach schedule cannot rescue a weak offer, an unclear brand cue or a spot that fails to prompt the intended next action. Television is a delivery environment; campaign results still depend on the message and the system around it.
Common measurement terms in a TV report. Media reports can combine several terms that are related but not interchangeable. “Impressions” count ad deliveries, including repeated deliveries to the same person. “Reach” estimates unique people or households exposed at least once during a defined window. “Frequency” is the average number of exposures among those reached. “Share of viewing” describes how viewing time is distributed across a platform or content category. Use the metric that answers the plan’s actual question.
| Term | Question answered | Minimum definition to request | Why it matters |
|---|---|---|---|
| Reach | How many unique people were exposed? | Audience universe, period, threshold | Size of the audience touched |
| Frequency | How often were reached people exposed? | Average and distribution | Distinguishes broad from repetitive delivery |
| Impressions | How many ad deliveries occurred? | Served / viewable / modeled basis | Not a count of unique people |
| Viewing share | Where did TV time occur? | Total or ad-supported denominator | Describes supply, not campaign delivery |
| Incremental reach | What did this channel add? | Deduplication method and comparison set | Avoids double-counting overlap |
Questions to ask before signing a TV plan. Ask the seller to specify whether reported reach is measured or modeled, whether viewing includes time-shifted playback, how co-viewing is treated, and whether the audience is households or people. Request the target demographic, minimum exposure definition, flight dates, dayparts and planned frequency. In a cross-platform package, ask how the same person is de-duplicated between linear, CTV and online video.
Put performance and billing terms in writing: makegoods for underdelivery, timing of post-campaign reports, data access, brand-safety controls and any audience guarantee. If the buy is local, request market-specific projections instead of a national reach claim. Link these requirements to a measurement plan and a defined conversion action. The Web Tonic team can help align paid media reporting with your broader marketing measurement approach. For paid media strategy, see our campaign planning guide.
Frequently Asked Questions
How much US television viewing is ad-supported?
Nielsen reported that 72.4% of U.S. television viewing in Q1 2025 occurred on ad-supported platforms and 27.6% on ad-free platforms. That is a share of viewing time, not a share of households or an individual campaign’s reach.
Does linear TV still reach a mass audience?
Yes, but “linear” needs a defined audience and time window. The 2025 TVB Media Comparisons Study reported broadcast TV had the highest reach among measured platforms, while Nielsen found broadcast and cable together represented 57.6% of ad-supported TV viewing in its May 2025 comparison.
Is television advertising only broadcast and cable?
No. Buyers now distinguish broadcast, cable, broadcaster video-on-demand, connected-TV streaming inventory and digital video. The inventory, targeting, measurement and buying methods vary; total TV and total video are not interchangeable.
How should TV advertising be measured?
Start with the campaign’s target universe and a consistent reach-and-frequency definition, then evaluate incremental reach against other media and connect exposed audiences to downstream outcomes where measurement is available. Do not treat total viewing share as a campaign result.
What does TV ad reach mean for a media plan?
Reach is the count or percentage of a defined audience exposed at least once during a stated period. It differs from impressions, time spent, share of viewing and people who recall an ad. Always state the universe, period, and platform scope.
Sources
Nielsen — Ad-Supported Gauge launch, Q1 2025
Nielsen — 2025 media planning guide
Attest — U.S. Media Consumption Report 2025
YouGov — State of U.S. Media Consumption 2025
Nielsen — Five TV trends for 2025 Upfronts
TVB / GfK-NIQ — Media Comparisons 2025 synopsis
TVB / GfK-NIQ — 2025 Purchase Funnel Study
TVB analysis of Nielsen December 2025 Ad-Supported Gauge
Thinkbox — TV Viewing Report 2025
BARB — What People Watched in 2025
IAB — 2025 Digital Video Ad Spend & Strategy Report
U.S. Census Bureau — Quarterly retail e-commerce report


