Table of contents
There is no single telemarketing conversion rate. Outbound cold calls, inbound service calls and digitally generated phone leads start with different populations and denominators. For 2026 planning, separate dials, live connections, conversations, qualified meetings, answered inbound calls and completed sales before setting targets or calculating cost.
Key Takeaways
- Cognism’s 2025 research puts industry cold-call success around 2.3%, based on meetings booked from calls.
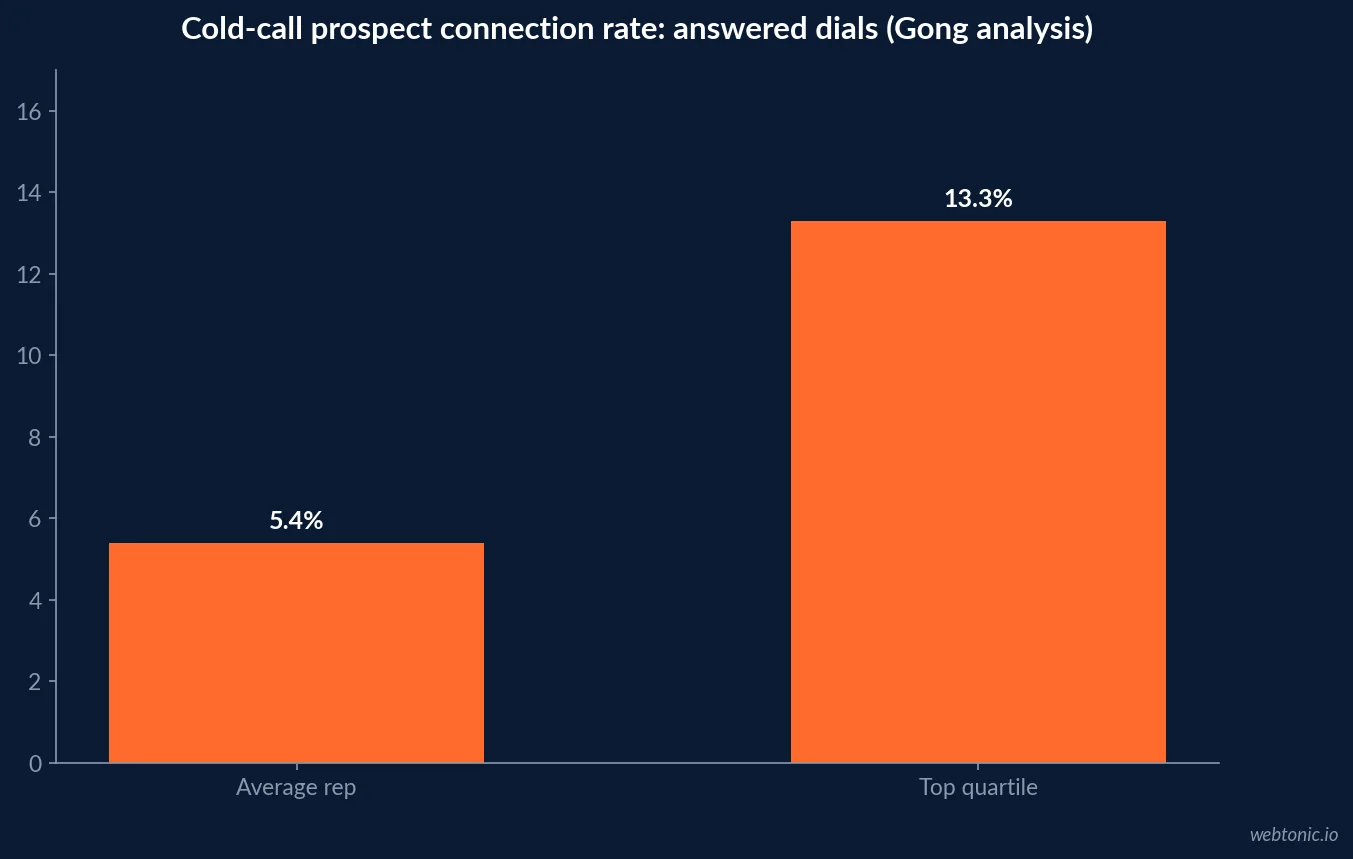
- Gong’s analysis of 300 million cold calls reported average rep connects of 5.4% and top-quartile connects of 13.3%.
- Invoca analyzed more than 60 million inbound phone calls in its 2025 benchmark report.
- 61% of Invoca callers spoke directly with a person; answer rates varied from 54% to 69% by industry.
- 37% of phone leads converted during the call in Invoca’s 2025 cross-industry analysis.
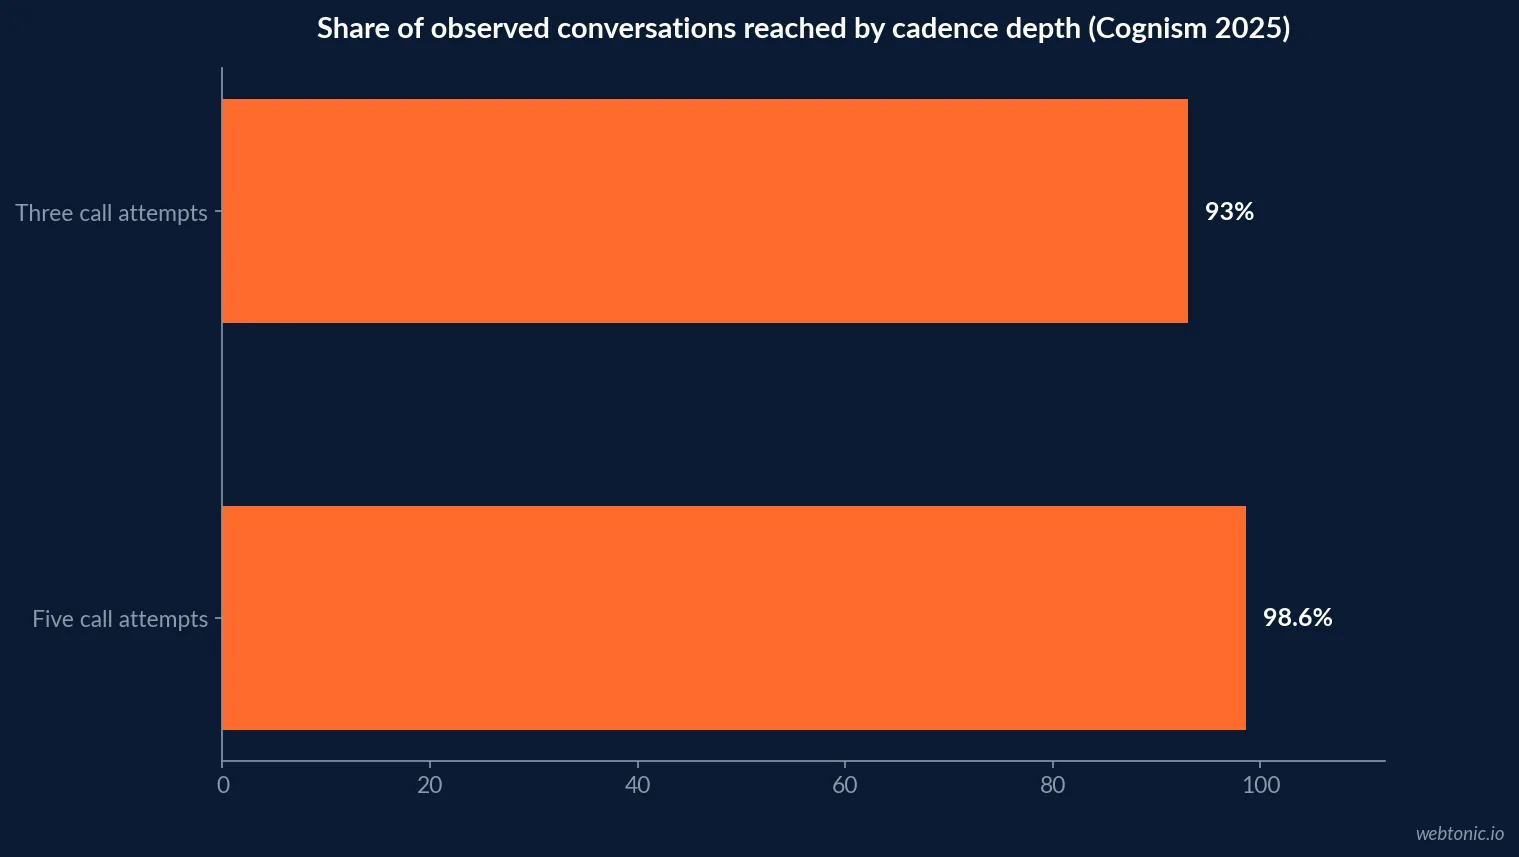
- Cognism found three attempts captured 93% of conversations in its 2025 dataset; five captured 98.6%.
- The Bridge Group’s 2025 SDR survey included 351 B2B companies and reported 44 median daily phone activities.
- HubSpot surveyed 379 sales professionals about cold calling in 2025.
- FTC rules include a safe harbor limiting abandoned outbound calls to 3% of answered calls under specified conditions; it is not a performance target.
- Costs need a local denominator: cost per dial, conversation, qualified meeting and sale are distinct.
Choose the right phone benchmark before comparing
Telemarketing benchmarks span at least three motions: prospecting to a list, responding to an inbound lead, and servicing an existing customer. A cold outbound rep begins with a dial and hopes to earn a conversation. An inbound team receives a call from someone already taking action. Their connection, qualification and conversion rates should not be compared as though they described the same funnel.
For outbound, define a connect as a person answering, a conversation as meaningful interaction, and success as a qualified meeting booked or held. For inbound, distinguish an answered call, a qualified call, a conversion during the call and a completed sale. Keep abandoned calls and automated resolution visible as operational outcomes.
When reviewing a report, verify the denominator, time period, geography, type of phone number, lead source, industry and whether the result comes from a vendor’s own activity, a survey or a broad call sample. Those details explain much of the apparent range between studies.
Outbound connection and meeting rates
Gong’s analysis of more than 300 million cold calls reports an average rep connect rate of 5.4%, calculated as prospect calls answered divided by total dials. Its top-quartile reps connected with 13.3% of prospects. Gong says the top performers booked meetings from 16.7% of conversations compared with 4.6% for the average rep. These are vendor-reported activity benchmarks from Gong’s customer data, not a randomized industry census.
Cognism’s 2025 State of Cold Calling report uses another measure: a success rate based on conversations that result in a booked meeting. It reports a 2.3% industry-average success rate, down from its 4.82% result for 2024; the report cites its WHAM (We Have A Meeting) dataset and notes an expansion of UK-to-mainland-Europe calling. Cognism’s own team reported a higher rate, 6.7%, which should not be substituted for its industry benchmark.
The numbers describe different populations and definitions. Use them to calibrate what a funnel might look like, then establish a baseline from the company’s own list quality, calling hours, territory, phone-number mix and qualification rules.
| Outbound metric | Benchmark | Source / year | Definition and caveat |
|---|---|---|---|
| Average rep connect rate | 5.4% | Gong, 2024 analysis | Answered prospects / dials |
| Top-quartile connect rate | 13.3% | Gong, 2024 analysis | Answered prospects / dials |
| Average conversation-to-meeting set rate | 4.6% | Gong, 2024 analysis | Meetings set / conversations |
| Top-rep conversation-to-meeting set rate | 16.7% | Gong, 2024 analysis | Vendor customer data |
| Industry cold-call success | 2.3% | Cognism, 2025 report | Booked meeting success measure; WHAM dataset |
| Cognism internal success | 6.7% | Cognism, 2025 report | Company-specific result, not industry average |
Inbound calls have a different conversion denominator
Invoca’s 2025 Call Conversion Industry Benchmarks analyzes more than 60 million phone conversations across nine industries. It reports 61% of business callers spoke directly with a person; answer rates ranged from 54% to 69% across industries. The remaining calls include cases where automated systems resolved needs, so an unanswered-by-person rate should not automatically be read as a missed sale.
Invoca reports 35% of calls from digital marketing were qualified leads, with some industries reaching 54%, and 37% of phone leads converted during the call, with industry rates as high as 46%. The report covers automotive, business services, consumer services, financial services, healthcare, home services, senior care, telecommunications, and travel and hospitality. These are cross-industry business-call benchmarks, not outbound cold-call outcomes.
To compare an internal team to Invoca, align the definition of phone lead, qualification, conversion event and industry. Report calls answered by a person separately from automated resolution and sales conversion. A high in-call conversion rate can coexist with a low answer rate.
| Inbound measure | Cross-industry 2025 result | Meaning | Planning use |
|---|---|---|---|
| Calls with a person reached | 61% | Share of callers speaking with a person | Staffing and routing |
| Answer rate range | 54%–69% | Varies by industry | Benchmark by vertical |
| Digital-marketing calls qualified | 35% | Could reach 54% in some industries | Lead quality and campaign scoring |
| Phone leads converting during call | 37% | Could reach 46% in some industries | Agent coaching and experience |
| Call quality rated poor | 28% | Report finding across sampled calls | Audit recordings and friction |
Cadence returns diminish after early attempts
Cognism’s 2025 WHAM analysis says calling a prospect three times produced 93% of all conversations captured in its dataset; five attempts reached 98.6%. The report describes a steep fall in conversations per attempt after the first call, including a 73% drop between attempts one and two and a further 60% drop from two to three.
These results help teams ask whether a longer cadence earns enough additional conversations to justify the cost and contact burden. They do not mean every prospect should be called exactly three times. List quality, role, region and stated preferences change the practical limit. Respect opt-outs and suppression lists, and avoid interpreting “more attempts” as a default performance lever.
Measure incremental conversations and meetings by attempt number. If later attempts generate few qualified outcomes, redirect time into improving data freshness, account selection or the opening message. Keep the cadence test isolated enough to distinguish call timing from list quality.
Rep activity is not the same as caller productivity
The Bridge Group’s 2025 SDR Models, Motions & Metrics study surveyed 351 B2B companies. It reports a median of 112 total daily activities for SDRs, including 44 phone activities, 41 emails, 19 LinkedIn activities and eight text or other activities. Phone-centric teams averaged 56 dials and 4.6 quality conversations per day, while email-centric teams averaged 28 dials and 3.4 quality conversations.
Those benchmarks describe an SDR role with multiple outreach channels, not a standalone call center. A higher dial count does not guarantee better output: list quality and conversation quality determine whether the phone activity creates a meeting or pipeline. Pair call volume with quality conversations, meetings held, accepted opportunities and revenue progression.
HubSpot’s 2025 survey of 379 sales professionals also provides self-reported views of appointment conversion and call outcomes. Its response bands should not be averaged as a measured dial-to-meeting ratio. Use it as a perspective on sales-team practice, then calculate your own cohort-level rates from CRM records.
| Sales activity benchmark | 2025 value | Study population | Use carefully |
|---|---|---|---|
| Median daily total activities | 112 | Bridge Group, 351 B2B companies | All listed outreach channels combined |
| Median daily phone activities | 44 | Bridge Group 2025 SDR survey | Phone task count, not conversations |
| Phone-centric team dials/day | 56 | Bridge Group 2025 | Segment average, not universal quota |
| Phone-centric quality conversations/day | 4.6 | Bridge Group 2025 | Quality conversation definition belongs to study |
| Email-centric quality conversations/day | 3.4 | Bridge Group 2025 | Different team motion |
| Sales professionals surveyed | 379 | HubSpot State of Cold Calling 2025 | Self-reported survey evidence |
Costs: calculate the unit that management buys
There is no single credible, universal cost per telemarketing lead in the primary studies reviewed here. The budget depends on labor, calling technology, data sourcing, qualification, follow-up and the outcome counted. A cost per dial can hide wasted contacts; cost per meeting may hide no-shows; cost per sale may ignore contribution margin.
Sopro’s 2025-updated B2B cost-per-lead benchmark page lists cold calling at USD 300 per lead, but the page does not provide a clear comparable primary sample or a current field period for that specific row. Treat it as a secondary directional estimate only—not a procurement price or a 2026 market rate. Ask providers for a quote with the exact qualification and billing definition before comparing costs.
Build a transparent internal calculation: total fully loaded cost divided by the number of qualified meetings held, opportunities created or customers acquired. Show each stage conversion and refresh the calculation when the source list or motion changes. Do not present an unsupported average as a promise.
| Cost view | Calculation | What it reveals | Potential distortion |
|---|---|---|---|
| Cost per dial | Calling cost / dials | Operating throughput | Rewards low-quality volume |
| Cost per connect | Cost / live answered calls | List and timing efficiency | A short answer is not a conversation |
| Cost per qualified meeting | Cost / meetings meeting criteria | Useful for pipeline planning | Booked vs held can differ |
| Cost per opportunity | Cost / accepted opportunities | Sales relevance | Long lag and attribution complexity |
| Cost per customer | Cost / customers won | Acquisition economics | Must account for margin and retention |
Call duration adds operating context: Cognism reports an average of 93 seconds for cold calls in its WHAM dataset in 2025, up from about 83 seconds in 2024. Duration is not a proxy for quality. Staffing must allow for preparation, dialing, conversation, notes, follow-up and breaks; if time rises while meetings fall, inspect targeting and talk tracks before adding capacity.
Compliance sets hard operating boundaries
In the United States, the Federal Trade Commission’s Telemarketing Sales Rule includes a safe harbor for predictive dialers, subject to conditions, that limits abandoned calls to no more than 3% of calls answered by a person, measured per day per calling campaign. This is a compliance threshold with specific requirements, not a performance goal or a universal rule for all jurisdictions and call types.
The FTC also describes calling-time restrictions, caller identification and do-not-call requirements. The Federal Communications Commission notes residential telemarketing calls are prohibited before 8 a.m. and after 9 p.m. local time, and callers must respect do-not-call requests. Requirements vary by country, consent, technology, relationship and purpose; obtain legal review for the actual campaign.
Compliance cost belongs in the budget: consent and suppression controls, caller ID management, records, training and review. A campaign that improves connection rates by disregarding user preferences is not a successful campaign.
Segment benchmarks by use case and industry
Invoca’s inbound phone data spans nine industries, while outbound cold-call reports cover sales prospecting and SDR operations. Do not blend their rates into one average. A home-services inbound lead who actively calls after an ad is different from a cold B2B contact selected from a prospect list. Their intent, qualification and expected call handling differ.
For a usable benchmark sheet, record data source, industry, geographic market, inbound or outbound, calling period, answer definition, conversation definition, qualified-lead rule, outcome and whether the call was human-answered or automated. Then compare only like with like.
Where public studies do not report a cost or conversion slice for your niche, label it unavailable rather than filling a gap with a guessed benchmark. Run a representative pilot and report the observed range.
Build a 2026 caller scorecard
A scorecard should show a funnel rather than a single “conversion rate.” For outbound, list eligible records, dials, live connections, conversations, qualified meetings booked, meetings held and opportunities accepted. For inbound, show calls generated, answered by a person, qualified, converted during call, and completed sale or appointment.
Break each stage out by source, industry, region, list vintage, time of day and call attempt where sample size permits. Mark vendor-reported figures separately from observed internal data. Use a clear baseline and run a small test before changing staffing, data or cadence.
Web Tonic’s growth marketing team can help connect lead-generation channels to business outcomes; our data intelligence work supports attribution and reporting. For a broader lead-generation comparison, see our guide to planning a measurable paid-search strategy.
| Stage | Outbound prospecting metric | Inbound phone-lead metric | Management question |
|---|---|---|---|
| Opportunity | Eligible records | Calls generated | Are we reaching the intended population? |
| Connection | Live connects / dials | Person answered / calls | Is access improving? |
| Conversation / qualification | Meaningful conversations / connects | Qualified calls / answered calls | Does the interaction meet need? |
| Conversion | Meetings booked / conversations | Leads converted during call | Which denominator is being used? |
| Downstream quality | Meetings held and accepted pipeline | Sales / appointments completed | Does the outcome create value? |
| Economics | Cost per qualified meeting or opportunity | Cost per converted lead or customer | Is incremental margin viable? |
2026 planning: use benchmarks as guardrails
The latest available figures reviewed here were published primarily in 2025 and analyze earlier or contemporaneous activity; they are not a full-year 2026 census. Treat “2026” in this guide as the planning horizon, not the field year of every statistic. Refresh performance targets with current team data and disclose the study date beside each external comparator.
For outbound, use connection and conversation rates to diagnose access, then meeting and opportunity rates to assess value. For inbound, measure answer, qualification, in-call conversion and downstream sales separately. A cost benchmark is meaningful only when the unit and qualification standard match your operation.
Make changes one at a time, retain a control when feasible and protect customer preferences. Strong caller performance is a combination of relevant targeting, respectful timing, accurate data, trained agents and a measurable outcome—not just more dials.
Frequently Asked Questions
Frequently Asked Questions
What is a good telemarketing connect rate in 2026?
It depends on what a team calls a connection. Gong’s analysis of 300 million cold calls reported an average rep connect rate of 5.4% and top-quartile 13.3%, using answered prospect calls divided by dials. Cognism’s 2025 WHAM dataset reports a different sales-call success measure: conversations resulting in booked meetings. Keep connection and conversion separate and benchmark against your own list, region, time and calling motion.
What is the average cold-call conversion rate?
Cognism’s 2025 report says the industry average cold-call success rate was about 2.3%, nearly half the 4.82% it reported for 2024, based on meetings booked from calls in the WHAM dataset. HubSpot’s survey of 379 sales professionals asked respondents about self-reported appointment conversion bands, and its results are not the same operational dataset. State the sample and denominator whenever you use a rate.
Why do inbound phone lead conversion rates look much higher?
They start with a different population. Invoca’s 2025 Call Conversion Industry Benchmarks analyzed more than 60 million business phone calls and reported 37% of phone leads converted during the call. These are inbound business calls across nine industries, many from digital marketing. Cold outbound dials begin before a prospect has chosen to call; putting the two rates side by side as one benchmark would be misleading.
How should a team calculate cost per meeting?
Use total calling labor, data and telephony costs for a defined period divided by qualified meetings held or booked, then state which meeting definition you use. Track dials, answered connections, conversations, qualified meetings and show rate as separate steps. Sopro’s 2025-updated benchmark page lists a cold-calling cost-per-lead figure of USD 300 but does not provide a comparable primary study basis on that row, so treat it as a secondary directional estimate, not a universal price.
How many call attempts should a rep make?
Cognism’s 2025 report says three attempts captured 93% of conversations in its dataset, with five attempts reaching 98.6%; its analysis shows diminishing returns after the early attempts. That is evidence from a particular sales operation, not a legal rule or guaranteed sequence for every list. Check contact preferences, local laws, data quality and opt-outs, then test a cadence with a clear suppression policy.
Sources
Cognism — State of Cold Calling Report 2025
Gong — Insights from 300M+ cold calls
Invoca — 2025 benchmark report findings
The Bridge Group — 2025 SDR Models, Motions & Metrics
HubSpot — State of Cold Calling 2025
Federal Trade Commission — Complying with the Telemarketing Sales Rule
Federal Trade Commission — Opinion 08-1 on call abandonment safe harbor
Federal Communications Commission — Telemarketing and TCPA rules, FCC-12-21A1