Table of contents
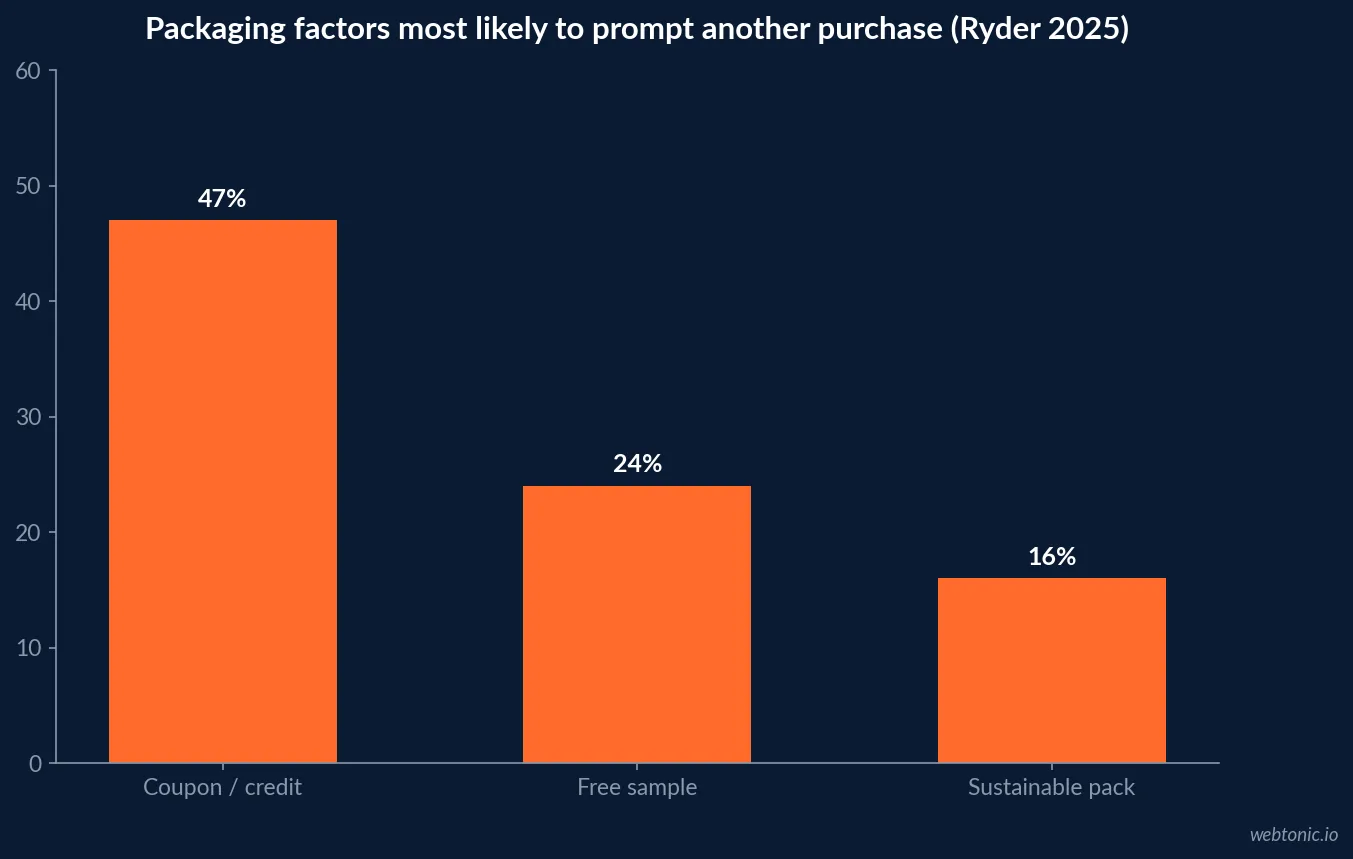
Unboxing is not a decorative moment; it is the handoff between fulfillment and the customer’s first use. In Ryder’s 2025 U.S. ecommerce study, 47% of respondents said a future-purchase coupon, discount or credit was most likely to bring them back after unboxing—more than free samples (24%) or sustainable packaging (16%).
Key Takeaways
- 47% cited a coupon, discount or future credit as the strongest repeat-shop trigger in Ryder’s 2025 study.
- 24% cited a free sample and 16% sustainable packaging in the same question.
- 36% of box-preferring shoppers cited better transit protection as a reason for choosing boxes over mailers.
- 29% cited box reuse and 14% perceived environmental benefits as reasons to prefer boxes.
- 61% named eco-friendly packaging as the environmental factor most likely to make them shop with a brand in Ryder’s 2025 survey.
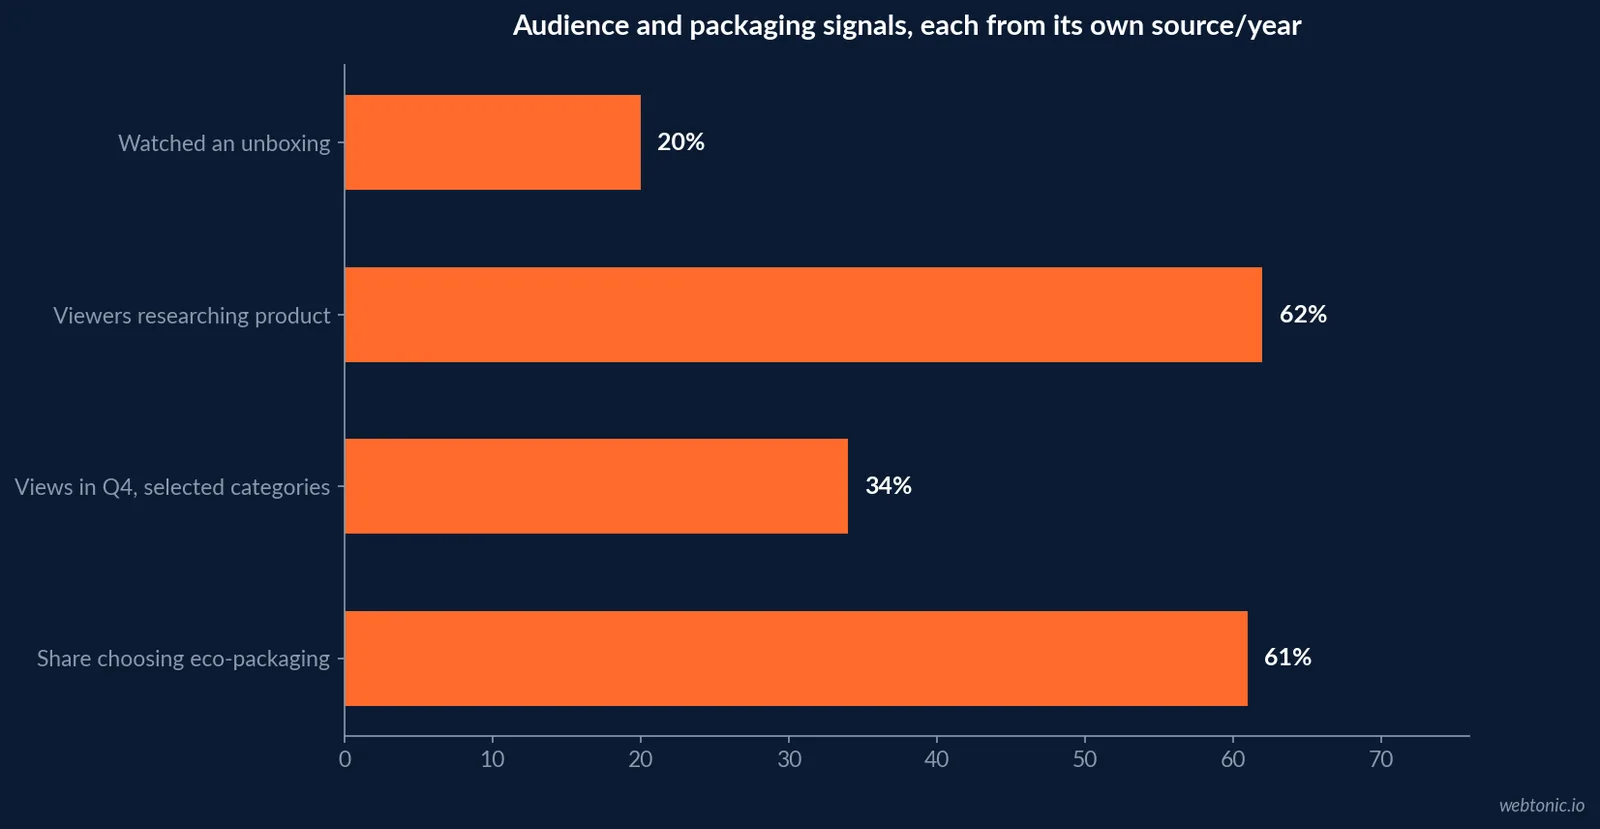
- One in five consumers had watched an unboxing video in a Google survey from October 2014.
- 62% of unboxing viewers watched while researching a product in the same historical Google survey.
- 34% of unboxing views in selected categories occurred in Q4, 1.5 times the average quarter, in Google’s 2013–14 YouTube data.
- 1,376 online shoppers were surveyed by Ryder in March 2025 for the core study.
- Packaging impact should be measured against damage, cost, repeat orders and shareability, not aesthetics alone.
What the unboxing moment includes
Unboxing begins when a parcel reaches the customer and ends when the product is safely removed, understood and ready to use. The experience includes delivery condition, package protection, opening sequence, product presentation, inserts, samples and instructions. Each element carries an operational cost, and each can help or hinder the customer.
That broader definition changes the measurement. A beautifully branded box that arrives late or crushed is not a good unboxing. A simple recyclable mailer that protects the item and makes setup easy may be better for the business and the customer. Ryder’s annual ecommerce research measures packaging alongside shipping, returns, omnichannel behavior and sustainability, which makes it useful for treating unboxing as part of fulfillment rather than an isolated design idea.
Ryder’s 2025 E-commerce Consumer Study draws on three surveys conducted in early 2025, including a core survey of 1,376 U.S. online shoppers in March. Its packaging questions ask about consumer sentiment and preferences; they do not directly measure retailer-level repeat-purchase lift. Use those survey findings as choice context, then validate business outcomes with shipment and cohort data.
Repeat purchase: value outranks the flourish
In the 2025 Ryder study, respondents were asked what factor in the unboxing experience was most likely to make them shop with the same brand again. 47% chose a coupon, discount or credit toward a future purchase; 24% chose free samples; and 16% chose sustainable packaging. The ranking is a reminder that packaging can introduce a next step, but the incentive itself may do more of the repeat-purchase work.
The survey answers do not establish that sending coupons causes 47% of customers to reorder. People may say a discount is appealing without redeeming it, and a coupon can erode margin or simply subsidize a purchase that would have happened anyway. Test the offer against a no-incentive group; compare redemption, incremental repeat orders, contribution margin and the effect on the next full-price purchase.
Samples have a different role: they can introduce an adjacent product and support discovery when they are relevant. Track whether recipients try, review or subsequently purchase the sampled item. A random sample that adds weight and packing complexity may not generate enough learning or demand to justify itself.
| Repeat-purchase trigger named | Share | Ryder survey year | Operator question |
|---|---|---|---|
| Coupon, discount or future credit | 47% | 2025 | Does incremental margin cover redemption? |
| Free sample | 24% | 2025 | Does the sample create measurable trial? |
| Sustainable packaging | 16% | 2025 | Can material choice meet protection goals? |
| Premium unboxing experience | Qualitative finding | 2025 | Does the design change sentiment or behavior? |
| Personalized packaging components | Survey item | 2025 | Does personalization justify fulfillment complexity? |
Boxes, mailers and the job of protection
In Ryder’s 2025 study, consumers who preferred boxes over mailer bags most often pointed to protection in transit: 36% cited the belief that boxes provide better protection. 29% said boxes can be reused and 14% considered them more eco-friendly. Those responses are reasons reported by respondents, not a laboratory test comparing damage rates by packaging type.
The operational choice should start with what the item needs to survive. Product fragility, shape, fit, void fill, moisture exposure, tamper evidence, carrier handling and dimensional weight affect the correct format. Test packaging under representative conditions and use actual damage, replacement, refund and return data to decide whether a sturdier package is worth its added material and postage.
A mismatch creates costs in both directions: over-packaging uses more material and may increase shipping cost; under-protection can trigger replacement and support work. The right benchmark is total landed fulfillment cost and customer outcome, not box-versus-bag preference alone.
Sustainability: stated preference versus purchasing behavior
Ryder reports that 61% of respondents selected eco-friendly packaging as the environmental factor that would most likely make them shop with a brand in 2025, up from 60% in 2024 and 54% in 2023. The report also found consumers prioritized cost savings in many ecommerce decisions. These signals are not contradictory: shoppers can care about packaging impact and still respond strongly to free shipping, discounts and price.
Keep claims precise. “Recyclable,” “recycled content,” “reusable” and “lower impact” describe different properties, and actual recycling access varies by location. Avoid a sustainability claim that is broader than the material evidence supports. Consider package mass, protective performance, material type and end-of-life guidance together.
Design changes should be evaluated on a scorecard that includes packaging spend, dimensional weight, damage rate, customer sentiment and disposal guidance. A greener material that breaks products more often can create more waste and customer friction than the packaging it replaces.
| Packaging decision | Relevant evidence | Measure in operations | Guardrail |
|---|---|---|---|
| Box vs mailer | 36% cite protection; 29% reuse | Damage, return and postage cost | Preference is not a damage test |
| Sustainable material | 61% selected eco-packaging | Material mix and disposal claims | Do not overstate environmental benefit |
| Premium presentation | Ryder reports positive sentiment | Repeat rate, sentiment, cost | Test against a simpler control |
| In-box sample | 24% say free sample may prompt return | Sample cost, trial and follow-on order | Match sample to buyer need |
| Discount insert | 47% name coupon/credit | Redemption and incremental margin | Do not confuse redemption with lift |
Unboxing videos are an older but revealing signal
The most frequently repeated public unboxing-video figures are historical, not current audience estimates. Google’s Think with Google article, drawing on Google Consumer Surveys of 1,500 people in October 2014 and YouTube viewing data from 2013–2014, found one in five consumers had watched an unboxing video. Among those viewers, 62% watched while researching a particular product.
Google also found that 34% of views for unboxing videos in food, electronics, toys, and beauty/fashion occurred from October through December—1.5 times the average volume in other quarters. That pattern suggests seasonal relevance in those categories in that period, but it should not be presented as a 2026 forecast or generalized to every product category.
The durable insight is the format’s dual purpose: entertainment and pre-purchase information. A useful unboxing clip can answer what arrives, how it is packed, what is included and how the first use works. For today’s channel planning, measure current views and shopping behavior directly rather than recycling the decade-old base as a present-day benchmark.
A current look at packaging expectations
Two 2025 surveys add current context to the Ryder benchmark. Macfarlane Packaging’s tenth annual unboxing survey reports 80% of respondents were satisfied or very satisfied with their unboxing experience, while 52% said recycling labels were unclear and 53% said they would not pay more for sustainable packaging. The study’s respondents discussed packaging across retail categories; those values are survey answers, not causal tests.
Mondi’s 2025 eCommerce trend report, produced with RetailX and based on around 6,000 consumers across six European markets, found 95% prioritized protective packaging and 59% said packaging influences repeat purchases. The six markets were Czechia, France, Germany, Poland, Sweden and Türkiye; do not treat the finding as a U.S. estimate. These results reinforce a useful hierarchy: protection and clarity come before decorative novelty, and stated repeat intent needs validation in purchase cohorts.
Real-world delivery operations set the unboxing baseline
Customer-facing impressions are only part of the delivery experience. Stord’s 2025 mystery-shopping study covered leading U.S. brands in nutrition and supplements, apparel, beauty and personal care, and food and beverage. It found 12% of tested products arrived damaged, while 6% of packages were damaged. The report says investigation traced product issues to before or during shipment, including manufacturing, fulfillment handling and inadequate protection inside packages. It is a controlled test of selected brands, not a national parcel damage rate.
A joint parcelLab and ShipStation assessment placed real orders with 57 large U.S. retailers in February and March 2025. It found that package size matched the product in more than 90% of orders, yet 55.6% of packages contained plastic components such as filler, inner wrapping or protective film. The retailer sample provides an operational snapshot of large merchants, not a consumer opinion poll. Together the sources show why good unboxing has to include right-sizing, material decisions and actual damage outcomes.
Use these operational benchmarks to identify questions for your own warehouse and carrier data. Compare damage rates by SKU and package design, check pack-station handling, and assess whether the product is protected without excess void fill. For direct customer impact, combine the operational evidence with support contacts, returns and replacement orders.
| Observed operations benchmark | Figure | Source and sample | Useful next check |
|---|---|---|---|
| Product arrived damaged | 12% | Stord 2025 mystery shop | Inspect product / packaging failure point |
| Package arrived damaged | 6% | Stord 2025 mystery shop | Carrier and pack-out cohort |
| Package size matched item | More than 90% | parcelLab / ShipStation; 57 retailers | Audit dimensional fit by SKU |
| Packages with plastic components | 55.6% | parcelLab / ShipStation; 57 retailers | Review filler and film alternatives |
| Package reusable or resealable | 50% reusable; 44.6% some reuse | parcelLab / ShipStation 2025 | Consider return convenience and waste |
| 2025 packaging study | Finding | Sample / geography | Use with care |
|---|---|---|---|
| Macfarlane Unboxing Survey | 80% satisfied / very satisfied | Consumer survey, 2025 | Satisfaction does not prove loyalty |
| Macfarlane Unboxing Survey | 52% say recycling labels unclear | Consumer survey, 2025 | Clarify disposal instructions |
| Macfarlane Unboxing Survey | 53% will not pay more for sustainable packaging | Consumer survey, 2025 | Preference is not willingness to pay in all contexts |
| Mondi / RetailX trend report | 95% prioritize protective packaging | ~6,000 consumers, six European markets | Not U.S. population |
| Mondi / RetailX trend report | 59% say packaging influences repeat purchase | Six European markets, 2025 report | Stated influence, not causal uplift |
Shareability is not guaranteed by a custom box
Brands often invest in packaging with the expectation that customers will post a photo or video. Ryder’s 2025 study asked what might encourage people to share a package online, including visually appealing or gift-like packaging, free samples and personalized elements. Such responses can guide design hypotheses, but a stated likelihood to post is not an actual post rate, referral or earned-media value.
To evaluate shareability, measure permissioned user-generated content, tagged posts, referral visits and attributed orders. Record the denominator: number of delivered packages, number of customers who saw the insert, or number of eligible social accounts. A post count without exposure or reach data can make a small result look large.
Make participation easy without requiring a positive review. Ask customers to share their genuine experience, do not condition a reward on sentiment, and disclose incentives where relevant. Use the resulting content only with appropriate permission and rights. Authentic customer content is a customer relationship—not a free creative supply chain.
Measure the package as part of fulfillment economics
Build a package-level scorecard that joins order and shipment records. At minimum, track packaging material and labor cost per order, shipping cost, damage or defect rate, replacement/refund cost, customer contacts about missing or damaged contents, return rate, delivery satisfaction and subsequent purchase. Segment by product type, carrier, packaging design and destination.
When testing a redesign, keep offer, product mix and service level stable where possible. A before-and-after comparison during a holiday peak can confound packaging with seasonality. A randomized order-level test is preferable when risk is low; for fragile products, use controlled packaging tests first and roll out in a measured cohort.
Define a primary outcome before the change—such as damage cost per 1,000 shipments or 60-day repeat contribution—and use secondary metrics to catch trade-offs. A package might reduce transit damage but increase weight; a decorative insert could increase sample trial while adding cost. The decision should reflect net effects.
Keep the next interaction useful
The first opening can flow into a second order, but it can also create a service interaction. Provide clear setup instructions, access to delivery support and a straightforward return process. parcelLab and ShipStation’s 2025 audit of 57 large U.S. retailers found about 72% notified customers by email when a package was delivered; roughly three in ten did not. A delivered notification can confirm the handoff and offer help, but should not bury the customer in cross-sells.
Track customer service contacts after delivery and categorize them by missing items, damage, setup, returns and delivery status. If confusion clusters around one insert or packing design, adjust the customer experience before investing in decoration. Order updates should reflect real shipment events; inaccurate tracking erodes trust at the precise moment the brand has a chance to reassure.
Packaging choices vary across product categories
The parcelLab and ShipStation review shows that material choices differ across the 57 retailers and their sectors. Half of orders used traditional cardboard boxes, 42.9% used plastic packaging (typically poly mailers), and 7.1% used paper-based alternatives. More than half of packages included some plastic component. The numbers describe the observed retailer sample; they are not a recommendation that one material always performs best.
The fit should follow product properties and fulfillment realities. Apparel may tolerate a flexible mailer; cosmetics may require leak protection; electronics may need internal cushioning; food products may need insulation or tamper evidence. A shopper’s preference for a box does not tell an operator what pack format will protect a particular SKU. Test actual breakage, deformation, leakage, delivery cost and returns for the order profile.
When switching materials, involve procurement, packaging engineering, warehouse operations and customer support. Track whether packaging instructions are clear, whether recyclable or reuse labels are understood, and whether new materials can be reliably sourced in peak season. Communicate actual disposal guidance rather than generic green claims.
| Retailer-side packaging finding | Share | Sample / date | Decision use |
|---|---|---|---|
| Cardboard boxes used | 50.0% | 57 large U.S. retailers, 2025 | Starting point, not universal best choice |
| Plastic packaging used | 42.9% | Same retailer audit | Segment by product and damage needs |
| Paper alternatives used | 7.1% | Same retailer audit | Investigate availability and strength |
| Sustainability message on package | 21.4% | Same retailer audit | Opportunity for accurate instructions |
| Retailers sending delivered notification | 71.9% | Same retailer audit | Post-delivery follow-up opportunity |
Build an opening sequence that helps the customer
- Protect the product. Use packaging tested for the item and the actual shipping route.
- Make the first step obvious. Put setup, care or safety instructions where the customer sees them.
- Use inserts sparingly. Include a relevant sample or offer only when its purpose and measurement are clear.
- Support accessibility. Make instructions readable, clear and available digitally where useful.
- Reduce disposal uncertainty. Identify materials accurately and explain local disposal limitations.
- Invite honest feedback. Ask for a genuine review without steering sentiment.
For packaging, creative and commerce teams, the customer’s first five minutes with an order can inform future design—but it cannot replace the evidence from actual damage, cost and repeat-purchase cohorts.
Planning implications for ecommerce teams. For 2026, use the new Ryder figures as a current consumer-preference reference and label them as U.S. survey responses. Use Google’s 2014/2013–2014 unboxing figures only as historic format context. Keep those data vintages distinct; combining them into a single “2026 unboxing benchmark” would mislead readers.
Prioritize protection and fulfillment reliability first, then test low-cost ways to make opening, setup and replenishment easier. If the objective is repeat business, test incentives against margin and natural repurchase behavior. If the goal is social sharing, measure delivered-package exposure, posts and qualified traffic. If sustainability is the objective, choose substantiated materials and evaluate total package performance.
Focus on customer experience that can be tied to a defensible outcome. See Web Tonic’s growth marketing practice, read the digital advertising cost guide, or contact the team about measurement.
Frequently Asked Questions
What share of consumers have watched an unboxing video?
Google Consumer Surveys found one in five consumers had watched an unboxing video in October 2014. It is a useful historical baseline, not a current 2026 audience estimate; Google’s associated YouTube data also showed strong holiday seasonality.
What packaging factor most encourages repeat purchase?
In Ryder’s 2025 E-commerce Consumer Study, 47% named a coupon, discount or credit toward a future purchase as the factor most likely to make them shop with the same brand again after unboxing. Free samples were cited by 24% and sustainable packaging by 16%.
Do premium unboxing experiences increase loyalty?
Ryder’s 2025 study describes a premium unboxing experience as a positive sentiment driver, but operators should not treat that as a guaranteed repeat-purchase lift. The report’s specific repeat-purchase question puts value incentives ahead of packaging extras.
Do customers prefer shipping boxes or mailers?
Ryder’s 2025 survey found respondents who preferred boxes cited better transit protection (36%), reuse (29%) and perceived environmental benefit (14%). Package choice should also consider product protection, dimensional weight, damage and return costs.
How should a brand measure unboxing performance?
Measure damage and return rates, packaging cost per shipment, customer service contacts, repeat purchase by cohort, and customer-generated posts or referrals. Use a controlled test when attributing changes to packaging rather than discount, seasonality or product mix.
Sources
Ryder — 2025 E-commerce Consumer Study (PDF)
Ryder — 2025 E-commerce Consumer Study page
parcelLab / ShipStation — U.S. Ecommerce Shipping Experience Study 2025
Mondi / RetailX — eCommerce trend report 2025
Macfarlane Packaging — Unboxing Survey 2025
Stord — 2025 Mystery Shopping Report
parcelLab / ShipStation — U.S. Ecommerce Shipping Experience Study 2025
Ryder Newsroom — 2025 study announcement
Google / YouTube — Behind Unboxing research
U.S. Census Bureau — Quarterly retail ecommerce estimates