Table of contents
TikTok Shop is a discovery-led checkout channel; traditional ecommerce is the wider system of brand sites, marketplaces and direct demand. Charm.io estimates U.S. TikTok Shop sales at USD 14.4 billion in 2025, but that platform estimate cannot be equated with total U.S. online retail or with a brand’s incremental profit.
Key Takeaways
- Charm.io estimates USD 14.4B in U.S. TikTok Shop sales during 2025.
- That estimate includes 702 million items sold at a reported average unit price of USD 20.43.
- TikTok said U.S. Shop sales increased 120% year over year for the 2025 period cited in its newsroom.
- Small U.S. business sales grew 70% year over year, TikTok said in the same update.
- More than USD 500 million in sales occurred during TikTok’s four-day 2025 BFCM period.
- Nearly 50% more U.S. shoppers bought during BFCM than in 2024, TikTok reported.
- 37% of U.S. adults used TikTok in 2025, Pew Research Center found; this is platform reach, not Shop adoption.
- 62% of U.S. TikTok users used it for product reviews or recommendations, Pew reported in 2024.
- 23% of shoppers planned to use social marketplaces in 2025, according to Ryder’s 2025 study.
- Traditional ecommerce remains the operating backbone for owned customer experience, analytics and repeat purchase.
Different units of analysis explain the numbers
The most important comparison is also the easiest to get wrong: U.S. TikTok Shop sales are not all U.S. ecommerce. Charm.io’s 2026 recap estimated the Shop generated USD 14.4 billion in U.S. sales in 2025, selling 702 million items at an average reported unit price of USD 20.43. This is a third-party platform estimate, not a U.S. Census measure or audited financial statement.
For context, the U.S. Census Bureau’s quarterly ecommerce series covers retail ecommerce across the entire country and multiple buying channels. It is a much broader universe than one marketplace. The two sources can help frame the relative scale of a platform and the national channel, but they are not a direct share calculation unless periods, product coverage and definitions align.
There is another distinction: GMV or gross sales is not net sales, contribution margin or incremental revenue. Promotions, returns, affiliate commissions, discounts, fulfillment and advertising all affect what remains. The operator should keep the measurement stack separated: orders and merchandise value first, then net revenue and contribution, then the incrementality question.
| Indicator | Value | Source / period | Scope note |
|---|---|---|---|
| TikTok Shop U.S. sales | USD 14.4B | Charm.io estimate, 2025 | Third-party marketplace estimate |
| Items sold | 702M | Charm.io estimate, 2025 | Item count, not unique orders |
| Average unit price | USD 20.43 | Charm.io estimate, 2025 | Product price estimate |
| Sales in four-day BFCM period | More than USD 500M | TikTok, Nov. 12-Dec. 1, 2025 | Platform-reported event sales |
| U.S. retail ecommerce | Census quarterly series | U.S. retail, 2025 | Broader channel / official statistical series |
TikTok Shop folds discovery into transaction
A traditional store usually earns a visit from an external source—search, an ad, email, affiliate, bookmark or marketplace navigation—and then manages product information and checkout on a site or marketplace. TikTok Shop can compress inspiration, creator demonstration, social proof and in-app checkout into one flow. This shifts some product discovery closer to the transaction, while adding platform rules and dependency.
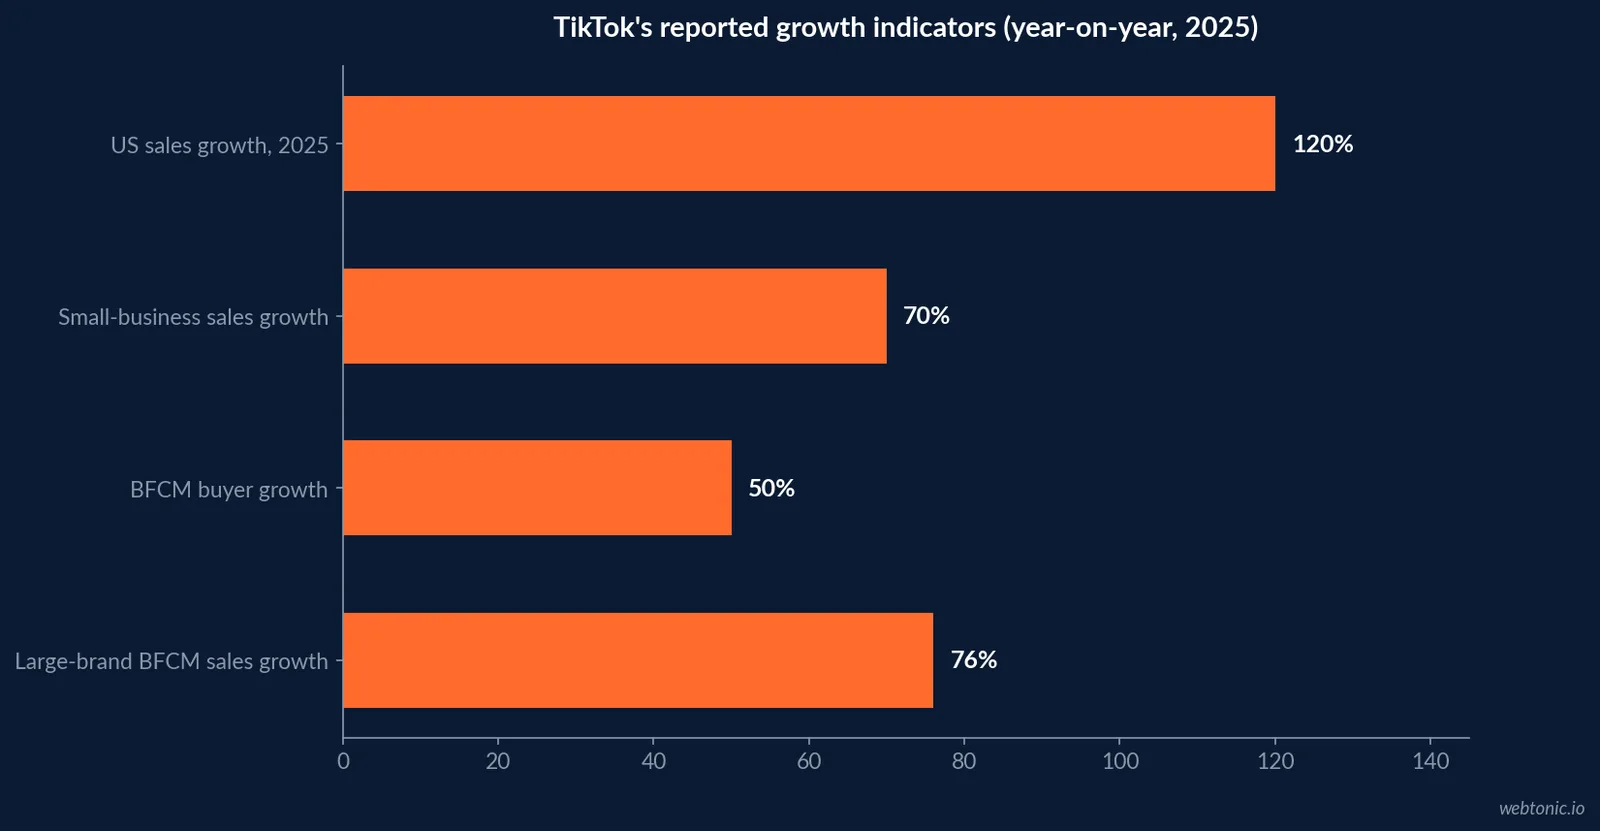
TikTok said U.S. Shop sales were up 120% year over year in the portion of 2025 it described. It also said sales to small U.S. businesses grew 70% year over year, and that more than 171,000 local and small businesses were active on the platform. Those are TikTok’s own platform statements; they are useful for understanding momentum but should be labeled as first-party reporting.
The channel can work particularly well when a product is demonstrable, visually distinctive, easy to explain in a short clip, and reasonably priced for a discovery purchase. Products requiring extensive configuration, a long consultative sales process or high-trust review may need a stronger handoff to owned pages and customer service. That is an operating hypothesis to validate with the category’s own data, not a guaranteed category rule.
Audience scale is not the same as shopping intent
Pew Research Center’s 2025 survey found 37% of U.S. adults used TikTok, up from 21% in 2021. It also found about 24% of U.S. adults were daily TikTok users. These platform-use numbers establish addressable audience context; neither says that a user shops on TikTok Shop or buys a particular product.
In a separate 2024 Pew survey of U.S. adult TikTok users, 62% said product reviews or recommendations were a reason they used the platform. That share varied by age: 74% among users 18–29, 62% among users 30–49, and 46% among users 50 and older. For marketers, this supports a hypothesis around creator explanation and peer content as discovery inputs. It does not imply 62% convert or that content is exclusive to TikTok Shop.
Traditional ecommerce can reach the same people through search, paid media, email, social referrals or retail marketplaces. The key question is whether a channel brings in new qualified demand or merely captures a purchase that would have happened elsewhere. Assigning all platform-attributed sales to incrementality is a common source of overstatement.
Audience usage turns into real Shop participation
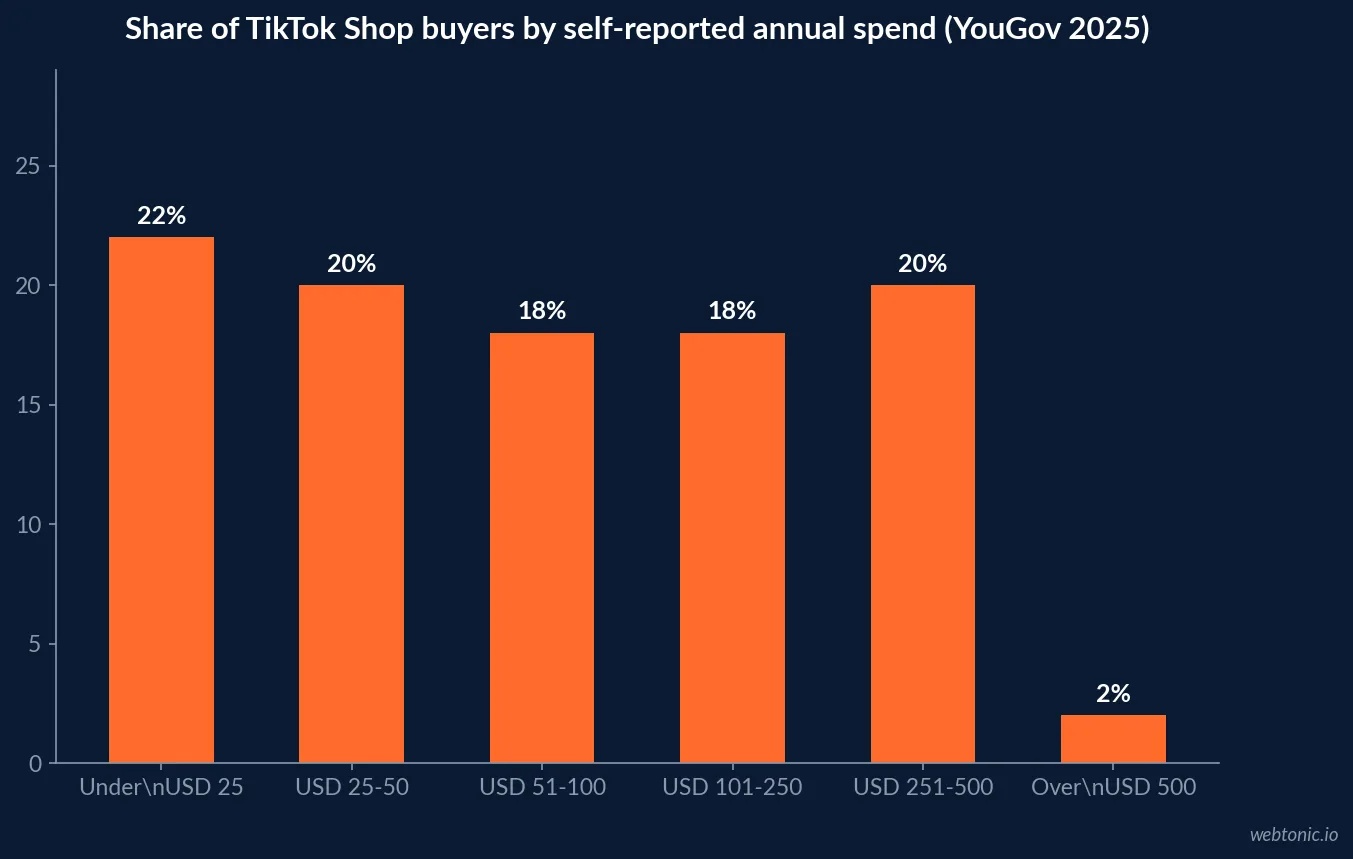
Pew Research Center’s 2025 survey found 37% of U.S. adults used TikTok, up from 21% in 2021. That platform-use figure frames possible audience availability, not Shop penetration. A separate nationally representative YouGov survey of 1,070 U.S. adults in May 2025, including 415 TikTok users, found 30% of U.S. TikTok users said they had purchased something on TikTok Shop in the previous 12 months.
YouGov reported that among Shop buyers discounts and promotions influenced 52%, TikTok advertising influenced 45%, convenience and ease of purchase 35%, and product reviews and ratings 34%. Influencer or celebrity recommendations were cited by 12%. The buyer subgroup contained 111 respondents; it offers a consumer survey signal, not a precise census estimate. Still, it complicates the simplistic notion that creator virality alone drives every order: price, advertising, convenience and trust cues have their own roles.
| Consumer signal | Figure | Population / period | Operator interpretation |
|---|---|---|---|
| U.S. adults using TikTok | 37% | Pew, 2025 | Platform reach, not commerce penetration |
| TikTok users purchasing on Shop | 30% | YouGov, prior 12 months to May 2025 | Self-reported purchase incidence |
| Promotions influence Shop buyers | 52% | YouGov, 111 Shop buyers | Test margin after offer |
| TikTok ads influence Shop buyers | 45% | YouGov, 111 Shop buyers | Separate paid from organic |
| Influencer/celebrity recommendations | 12% | YouGov, 111 Shop buyers | Not the only discovery mechanism |
| Audience signal | Statistic | Population / date | Do not infer |
|---|---|---|---|
| TikTok use | 37% | U.S. adults, 2025 Pew survey | Not 37% Shop buyers |
| Daily TikTok use | 24% | U.S. adults, 2025 Pew survey | Not purchase frequency |
| Product reviews / recommendations as a use reason | 62% | U.S. TikTok users, 2024 Pew survey | Not conversion rate |
| Same reason, ages 18-29 | 74% | U.S. TikTok users, 2024 | Not all young adults |
| Social marketplace shopping plans | 23% | U.S. shoppers, 2025 Ryder survey | Not actual completed orders |
Creator and content performance meets commerce operations
TikTok Shop can connect creator-led videos and livestreams to product listings, but the resulting order still depends on inventory, shipping, returns and support. TikTok reported that U.S. brands with USD 10 million or more in annual revenue grew Shop sales by 76% year over year during its 2025 BFCM comparison, while the overall event brought nearly 50% more U.S. shoppers who bought than the prior year’s campaign period. TikTok said sales exceeded USD 500 million across the four-day shopping period.
These are seasonal campaign data, not annual growth rates. The event covered Nov. 12 through Dec. 1, 2025 according to TikTok’s own note, and should be compared only with the company’s stated 2024 period. The spike is a planning signal for seasonal activation, creator capacity, inventory and customer support; it should not be annualized.
Creators are not just another traffic source. Their content may serve as product explanation and social proof; however, affiliate costs, discount codes, returns, sample inventory and rights management need to be recorded against resulting orders. Report performance by creator and asset, then measure net contribution after all channel costs.
Traditional ecommerce still owns important jobs
A brand’s own store provides room for richer specifications, product comparisons, customer account tools, bundles, subscriptions, service information and first-party retention programs. Marketplaces offer different advantages, including built-in browsing and standardized trust cues. Neither is simply a checkout substitute for social commerce: each has its own acquisition cost, data access, merchandising constraints and repeat-purchase path.
The U.S. Census Bureau’s ecommerce estimates are appropriate for broad national online-retail context; they are not a measure of any one brand’s direct-to-consumer site. For a company-level comparison, use its own orders, analytics, CRM and finance records, and retain a clear source label for platform-attributed orders.
Channel roles can be complementary. TikTok may create awareness and drive first purchase; a brand site can carry the expanded catalog or repeat-purchase experience; email and customer service can support retention. Whether customers move between channels depends on permissions and platform access—never assume that every social-commerce buyer becomes an owned audience contact.
| Operating area | TikTok Shop | Traditional ecommerce | Benchmark to track |
|---|---|---|---|
| Discovery | Feed, creators, LIVE | Search, direct, ads, marketplaces | New-to-brand visits / buyers |
| Transaction | Platform checkout | Brand / marketplace checkout | Net order value and conversion |
| Customer data | Platform-governed access | Merchant analytics and CRM | Permissioned records, match rate |
| Fulfillment | Seller / platform choices | Merchant / marketplace network | On-time delivery, damage, returns |
| Repeat purchase | Platform content and Shop path | Owned lifecycle / marketplace path | Cohort repurchase and margin |
Conversion comparison needs a clean test
Compare channel cohorts only after defining what counts as a buyer, how refunds are handled, and whether the same customer can be counted in multiple systems. Track gross merchandise value, net revenue, discounts, affiliate fees, paid media, shipping, returns and customer support. A social shop with higher sales but lower contribution can still play a useful acquisition role, but the role must be demonstrated.
For incrementality, use geo tests, randomized holdouts or matched periods where possible. If experiments are not available, reconcile Shop orders with web analytics and CRM, de-duplicate known customers, and label platform attribution separately from observed total business results. Keep the test window long enough to see returns and early repeat orders.
Compare product or SKU cohorts with similar price, availability and promotional treatment. A Shop campaign built around a limited-time discount should not be compared with full-price direct site traffic as though channel were the only difference. Record the creative, audience, offer and seasonality alongside the sales number.
Fulfillment and customer experience are not background details
Social shopping can raise order volume quickly, especially during a sale. That creates operational pressure: inventory accuracy, carrier capacity, order tracking, returns, damaged packages and customer support all influence the experience after the creator’s video ends. Ryder’s 2025 U.S. ecommerce study found free shipping influenced purchase decisions for 76% of consumers; its broader findings emphasize savings, flexible fulfillment and returns. These are ecommerce-wide findings, not TikTok-only measures.
Operational readiness should be checked before a creator burst or livestream schedule. Confirm inventory for featured variants, fulfillment cut-off, customer-service staffing, return policy, and the process for handling delayed orders. Make sure the product page, description and content agree on what is included and how it works.
For traditional ecommerce, the same operational constraints exist but the merchant often controls more of the customer journey. That control is an advantage only if the brand maintains accurate product information and reliable fulfillment; social platforms can add discovery but do not remove post-purchase responsibility.
Use the channel mix to match the job
Use TikTok Shop when the product benefits from visual demonstration, creator narration, short-form discovery and a simple checkout. Use a traditional store or marketplace to provide full product depth, comparison, service, replenishment or account management. Let paid search capture explicit intent; use social video to introduce a use case; use CRM to support consented retention.
Do not force a single-channel decision where the customer journey spans several. Instead, define the job each channel owns and the outcome metric. TikTok Shop can be measured on contribution per creator, new-to-brand buyers, product sell-through and incremental lift; the owned store can be measured on conversion, repeat cohorts, direct margin and customer-data quality.
Start with the unit of analysis and the business outcome, not the platform’s largest headline statistic.
A 2026 operator scorecard
Review the comparison monthly and after major promotional events. Keep an executive view of sales and contribution, plus a diagnostic view of traffic source, creator, SKU, discount, delivery, return reason and repeat order. Include a source/method note for any external benchmark. TikTok’s 120% growth statement, for example, should be recorded as platform-reported and tied to its stated reporting period; the USD 14.4 billion figure should be logged as a Charm.io 2025 estimate.
Three decisions follow from the scorecard: whether to expand assortment, whether creator economics support more volume, and whether customers acquired in Shop show healthy repeat behavior. If the measurement cannot answer those questions, improve order reconciliation before increasing the budget. Teams can connect the channel plan to Web Tonic’s growth marketing practice and data intelligence service, or contact the team about measurement needs.
Frequently Asked Questions
How large was TikTok Shop in the U.S. in 2025?
Charm.io estimated U.S. TikTok Shop sales at USD 14.4 billion for 2025, with 702 million items sold. This is a third-party estimate, not an audited platform filing. TikTok separately said U.S. sales increased 120% year over year for the period it described in its 2025 newsroom post.
Is TikTok Shop replacing traditional ecommerce?
No. It adds an in-app discovery and checkout path; it does not remove the need for a brand site, customer service, fulfillment, retention, or marketplace strategy. Operators should judge the channel on incremental contribution and customer value, not sales credited to the platform alone.
What is the main difference between TikTok Shop and a web store?
TikTok Shop combines entertainment, creator content and product discovery with native commerce. A traditional ecommerce site is a merchant-controlled destination reached through search, direct traffic, ads, email, affiliates or marketplaces. The ownership, measurement and customer relationship differ.
How should brands measure TikTok Shop sales?
Track gross merchandise value, net revenue after returns and discounts, contribution margin after platform, creator and fulfillment costs, new-to-file customers, repeat purchase and incrementality. Reconcile platform reporting with orders and finance records.
Can TikTok Shop be compared directly with U.S. ecommerce sales?
Only with careful definitions. Census retail ecommerce covers broad U.S. retail sales across many channels, while a TikTok Shop estimate covers a platform and may use a different methodology. State geography, period, product scope and whether the figure is GMV, gross sales or net revenue.
Sources
TikTok Newsroom — Shop discovery and sales growth, 2025
TikTok Newsroom — BFCM 2025 U.S. event results
Charm.io — 2025 U.S. TikTok Shop recap
Pew Research Center — Americans’ social media use, 2025
TikTok / Ipsos — Commerce Redefined, 2024 U.S. shopper research
YouGov — Are U.S. TikTok users turning to TikTok Shop?, May 2025
Pew Research Center — TikTok reviews and recommendations
U.S. Census Bureau — Quarterly retail e-commerce report
Ryder — 2025 E-commerce Consumer Study
Ryder — E-commerce Consumer Study summary
IAB — Digital Video Ad Spend & Strategy Report 2025