



Table of contents
No published study benchmarks podcast advertising for tax and accounting firms, so this report uses the one tax-specific dataset that matters for audio timing: the IRS 2026 filing-season curve. Everything else here, from CPMs to response rates, is cross-industry and labelled that way.
Key Takeaways
- 22.4 million returns were received by February 6, 2026, per the IRS.
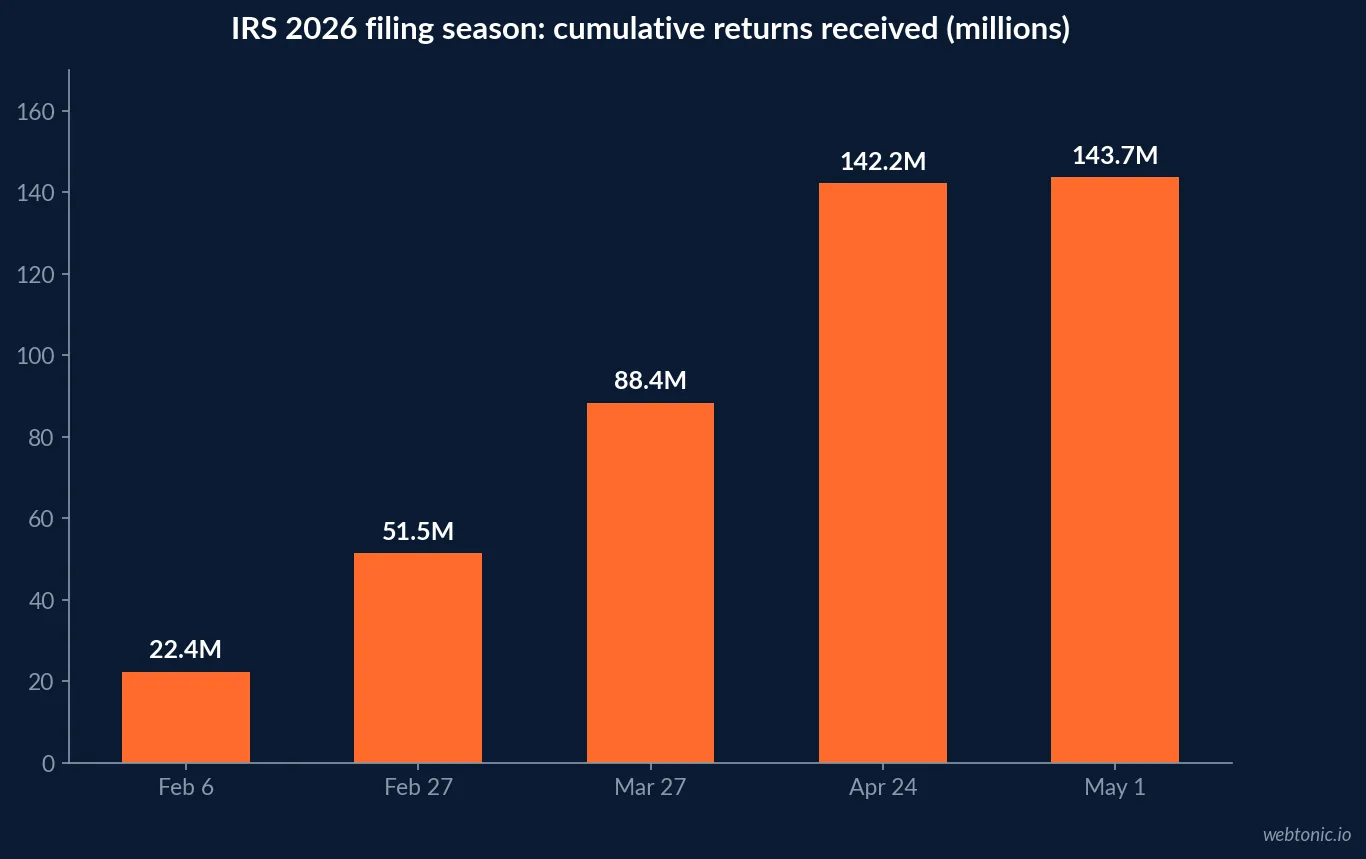
- 88.4 million had arrived by March 27 and 142.2 million by April 24.
- 73.9 million of 139.2 million e-filed returns came from tax professionals by April 24.
- IRS.gov logged 534.2 million visits, up 59.8% year on year.
- 58% of Americans 12+ (167 million) consumed a podcast in the last month (Edison, 2026).
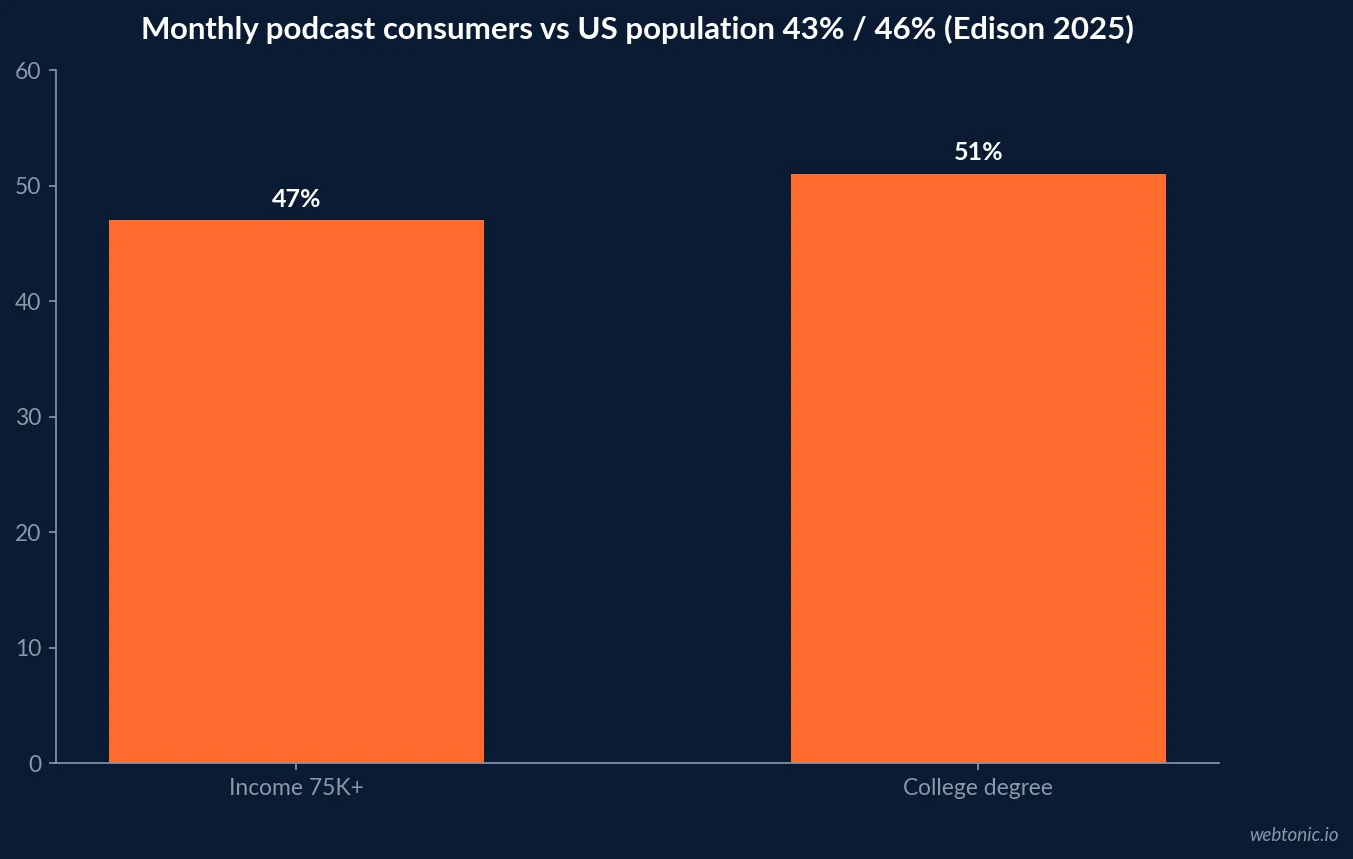
- 47% of monthly podcast consumers earn USD 75K+ against 43% of the population (Edison, 2025).
- 18% of weekly podcast consumers own a business, a CPA's advisory audience.
- US podcast ad revenue reached USD 2.9 billion in 2025, up 17.6% (IAB/PwC).
- Libsyn's 60-second average CPM was USD 21.25 in August 2024 (vendor rate data).
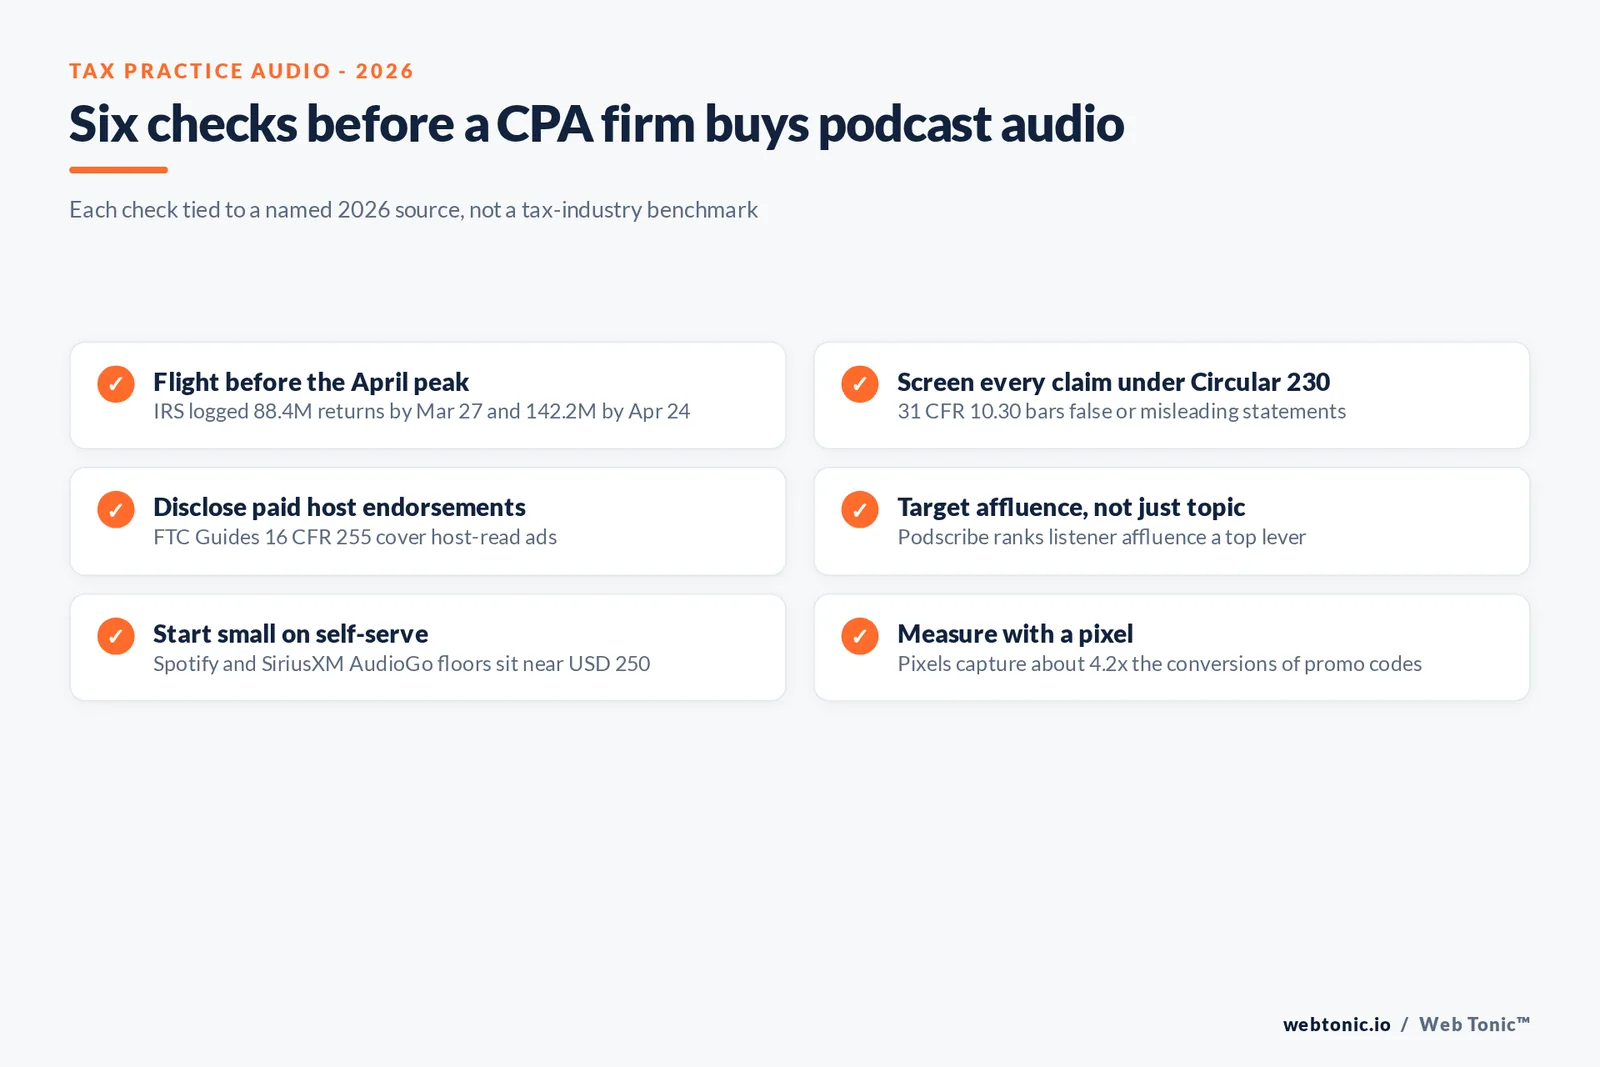
- Spotify and SiriusXM self-serve floors sit near USD 250.
- No tax-specific podcast CPM, CTR or CPL has been published.
The filing-season curve is the tax industry's audio plan
Tax demand is unusually well documented. The IRS publishes cumulative returns every week of the season, and the 2026 numbers show how front-loaded the decision window is. By February 6 the agency had received 22,351,000 returns. By February 27 that was 51,491,000, by March 27 88,424,000, and by April 24 142,225,000.
For a firm buying audio, the implication is plain. Roughly 91 million returns arrived after February 27, so an audio flight that ends in late February misses most filers, while a flight that starts in April talks to people who already filed.
| Week ending (2026) | Cumulative returns received | Same week 2025 | Audio planning read |
|---|---|---|---|
| February 6 | 22,351,000 | 23,589,000 | Early filers; awareness flight should already be live |
| February 27 | 51,491,000 | 52,402,000 | Refund-driven filers largely done |
| March 27 | 88,424,000 | 89,550,000 | Complex and business returns still open |
| April 24 | 142,225,000 | 142,566,000 | Season closed; shift to extension and advisory messages |
How much of the market already uses a professional
The April 24 statistics split e-filing by who prepared the return: 73,898,000 of 139,221,000 e-filed returns came from tax professionals, against 65,323,000 self-prepared. Self-prepared e-filing grew 1.9% and professional e-filing 0.6%. IRS.gov visits hit 534,164,000, up 59.8%.
That split is the audience brief. A podcast ad for a preparer is mostly trying to move a self-filer to a professional, or pull a client from another firm, not create demand for filing itself.
Who is listening, and why it suits advisory work
Edison Research's Infinite Dial 2026 (n=2,050, fielded January 2026) puts monthly podcast consumption at 58% of Americans 12+, or about 167 million people, and weekly at 45%. Among 35 to 54 year olds, the age band that files the most complex household returns, 68% consumed a podcast in the last month.
Edison's Podcast Consumer 2025 adds the income profile: 47% of monthly podcast consumers earn USD 75K or more against 43% of the US population, 51% hold a college degree against 46%, and 18% of weekly consumers own a business. Those are the households most likely to itemize, run a Schedule C or need quarterly estimates.
| Audience measure | Podcast consumers | Comparison | Source and year |
|---|---|---|---|
| Monthly reach, 12+ | 58% (167M) | Weekly 45% (130M) | Edison Infinite Dial 2026 |
| Monthly reach, 35-54 | 68% | Highest of any age band reported | Edison Infinite Dial 2026 |
| Household income USD 75K+ | 47% | 43% of US population | Edison Podcast Consumer 2025 |
| College degree | 51% | 46% of US population | Edison Podcast Consumer 2025 |
| Business owners (weekly listeners) | 18% | Advisory and bookkeeping prospects | Edison Podcast Consumer 2025 |
What audio costs: cross-industry rate cards
There is no CPA or tax-preparer CPM in any report we opened. The closest public rate data comes from podcast marketplaces and self-serve platforms. Libsyn Ads reported an average CPM of USD 21.25 for a 60-second spot in August 2024, against USD 21.93 in July 2024 and USD 22.10 a year earlier; its highest categories were Government and Technology at USD 29. These are vendor figures from one marketplace, not an industry average.
Self-serve floors are set by the platforms themselves. Spotify's Ad Studio help centre says the minimum lifetime budget is roughly the equivalent of USD 250, and SiriusXM Media says AudioGo placements start as low as USD 250, with voice actors from USD 10.
| Buying route | Published entry point or rate | Who publishes it | Fit for a tax firm |
|---|---|---|---|
| Spotify Ad Studio (self-serve) | About USD 250 minimum lifetime budget | Spotify help centre | Local test in a filing window |
| SiriusXM AudioGo (self-serve) | From USD 250 | SiriusXM Media | Produced spot, geo and genre targeting |
| Host-read marketplace, 60s | USD 21.25 average CPM (Aug 2024) | Libsyn Ads, vendor | Business and finance shows |
| Top marketplace categories | USD 29 CPM (Government, Technology) | Libsyn Ads, vendor | Upper bound for niche B2B shows |
The Circular 230 line every script must clear
Tax advertising has its own federal rule. Circular 230, section 10.30 of 31 CFR Part 10, says a practitioner may not, on any IRS matter, use any form of public communication or private solicitation containing a false, fraudulent or coercive statement or claim, or a misleading or deceptive one. A host ad read is a public communication.
That puts common podcast copy under scrutiny: guaranteed refund sizes, implied IRS affiliation and "we make audits disappear" style promises. If a host personally endorses the firm, the FTC Endorsement Guides (16 CFR Part 255) add a second layer: the endorsement must reflect the host's honest opinion and a paid relationship has to be disclosed.
| Script element | Rule that applies | Risk level | Compliant alternative |
|---|---|---|---|
| Guaranteed refund amount | 31 CFR 10.30 | High | Describe the service, not an outcome |
| Implied IRS endorsement | 31 CFR 10.30 | High | Name credentials (CPA, EA) only |
| Host says they use the firm | 16 CFR 255 | Medium | Only if true, with a clear paid disclosure |
| Fee claims | 31 CFR 10.30 | Medium | State what the fee includes and when it applies |
Buy episodes, not just impressions
Podscribe's Q3 2026 Performance Benchmark Report (vendor data, 105,000+ campaigns) compares episodic buys with impression-based buys. Episodic buys averaged a frequency of 1.2 against 2.1 and a purchase rate of 0.017% against 0.011%, at the same USD 158 CPA. Only 0.6% of episodic impressions hit a frequency of 15 or more, against 9.6% for impression buys.
For a seasonal service with a hard deadline, episodic placement on a few finance or small-business shows reduces the risk of hammering the same listener in March. Podscribe also names DMA, listener affluence and prior brand interaction as the top targeting levers, which is useful for a local practice.
Measuring a filing-season flight
Promo codes are the default in podcasting and the weakest signal for a professional service. Podscribe reports that promo codes and vanity URLs capture about 24% of conversions and that pixel attribution captures about 4.2 times more. Its all-industry medians are a visitor rate of 0.20%, a cost per visitor of USD 10.00 and a CPA of USD 168, all cross-industry.
A CPA firm usually converts by phone or booked call, so pair the pixel with call tracking and a booking-form source field. Our performance creative team writes audio scripts built around that kind of measurable call to action.
| Metric (Podscribe Q3 2026, all industries) | Median | What a tax firm should compare it to |
|---|---|---|
| Visitor rate | 0.20% | Share of reached listeners who hit your booking page |
| Cost per visitor | USD 10.00 | Your paid search cost per click in filing season |
| Cost per acquisition | USD 168 | First-year fee of a new individual client |
| Promo-code capture | About 24% | Why code-only reports undercount |
Host-read or produced spot for a trust-based service
Tax clients hand over their financial lives, so the voice delivering the ad matters. Magellan AI's Q2 2026 Measurement Benchmark Report (vendor data, campaigns measured January to June 2026) found host-read ads posted a 3.22% median response rate against 2.09% for produced spots, about 54% higher. Its all-category medians were a 2.23% response rate over a 30-day window, 4.65% lead conversion and 3.98% purchase conversion among site visitors.
Magellan also warns that campaigns judged at seven days show less than half of what they eventually deliver. For a firm that books consultations over several weeks of the season, a 30-day read is the minimum before cutting a show. None of these figures is specific to tax or accounting advertisers.
Where podcast money sits in the ad market
The IAB/PwC Internet Advertising Revenue Report for 2025 puts US podcast advertising at USD 2.9 billion, up 17.6%, inside a digital audio market of USD 8.4 billion. Podcasting remains a small slice of total internet advertising, which means a single firm's spend is not competing against huge category budgets in most local markets.
For wider context on channel spend, see our advertising statistics roundup.
Firm economics that set the budget ceiling
The AICPA PCPS/CPA.com National MAP Survey reports a median 6.7% increase in net client fees in fiscal 2024, down from 9.1% in the prior survey, and net remaining per partner of USD 252,663, up 11.9% from USD 225,725 in fiscal 2022. 81% of responses came from firms with revenue of USD 5 million and below.
Firms that size a test from those economics tend to start with one self-serve flight and one host-read package rather than a network buy.
A filing-season audio calendar
- January: book host reads on small-business and personal-finance shows; launch the self-serve test.
- February: peak frequency, while cumulative returns climb from 22.4 million to 51.5 million.
- March: shift copy to complex returns, business owners and extensions.
- April to December: advisory, bookkeeping and quarterly estimate messages to the 18% of weekly listeners who own a business.
Audio rarely works alone during filing season. Compare it with our tax and accounting SMS marketing data for deadline reminders and our tax and accounting influencer and UGC statistics for creator-led content.
Frequently Asked Questions
Is there a podcast advertising benchmark for tax and accounting firms?
No. Neither the IAB/PwC podcast revenue study nor the vendor benchmark reports we reviewed publish a CPM, response rate or cost per lead for tax preparers or CPA firms. Every rate on this page is cross-industry and labelled as such. The tax-specific evidence is the demand calendar, which the IRS publishes weekly.
When should a tax firm run podcast and audio ads?
Before the bulk of returns arrive. IRS 2026 filing-season statistics show 22.4 million returns received by February 6, 51.5 million by February 27, 88.4 million by March 27 and 142.2 million by April 24. More than half of the season's returns arrive after late February, so a January-to-March flight reaches filers who have not yet chosen a preparer.
What does a small podcast test cost?
Self-serve floors are low. Spotify's Ad Studio help centre sets a minimum lifetime budget of roughly the equivalent of USD 250, and SiriusXM Media says AudioGo placements begin as low as USD 250. Host-read marketplace pricing is a separate market: Libsyn Ads reported a USD 21.25 average CPM for a 60-second spot in August 2024.
What rules apply to podcast ads for tax preparers?
Circular 230 (31 CFR Part 10, section 10.30) bars practitioners from any public communication containing a false, fraudulent, coercive, misleading or deceptive statement or claim on IRS matters. If a host endorses your firm, the FTC Endorsement Guides in 16 CFR Part 255 also apply, including disclosure of the paid relationship.
How should a CPA firm measure podcast results?
With a pixel plus a promo code, judged over weeks. Podscribe's Q3 2026 vendor report says pixel attribution captures about 4.2 times the conversions of promo codes and vanity URLs, and that promo codes capture roughly 24% of conversions. Codes alone will understate results.
Sources
IRS - Filing season statistics, week ending April 24, 2026
IRS - Filing season statistics, week ending Feb. 6, 2026
IRS - Filing season statistics, week ending March 27, 2026
eCFR - 31 CFR Part 10 (Circular 230)
eCFR - 16 CFR Part 255, FTC Endorsement Guides
Edison Research - The Infinite Dial 2026
Edison Research - The Podcast Consumer 2025
IAB/PwC - Internet Advertising Revenue Report FY2025
Podscribe - Performance Benchmark Report Q3 2026
Magellan AI - Podcast Measurement Benchmark Report Q2 2026
Libsyn - August 2024 podcast ad rates
Spotify Advertising - Ad Studio help centre
SiriusXM Media - Podcast advertising costs
AICPA - National MAP Survey results


