



Table of contents

No published benchmark measures CTV ads for tax preparers or accounting firms, but the IRS publishes the one dataset that matters most for timing: 142.2 million individual returns received by April 24, 2026. This page pairs that calendar with cross-industry connected TV data.
Key Takeaways
- The IRS received 140,222,000 individual returns in the 2026 filing season (National Taxpayer Advocate).
- By February 27, 2026, 51.5 million returns had already arrived, about 36% of the April 24 cumulative count.
- Tax professionals filed 73.9 million of 139.2 million e-filed returns by April 24, 2026.
- IRS.gov visits hit 534.2 million by April 24, up 59.8% on 2025.
- Streaming held 49.0% of US TV time in July 2026 (Nielsen).
- US digital video ad spend is estimated at USD 81.9 billion for 2026, with CTV up 11% (IAB).
- 18% of US open programmatic CTV traffic was invalid in Q3 2025 (Pixalate).
- Roku's self-serve campaigns need a lifetime budget of at least USD 500.
The tax and accounting CTV picture at a glance
Two kinds of number sit in this table: IRS demand data that is specific to tax, and connected TV data that is cross-industry. Nothing in the second group was measured on tax or accounting campaigns.
| Metric | Figure | Source | Scope |
|---|---|---|---|
| Individual returns received, 2026 season | 140,222,000 | National Taxpayer Advocate | Tax-specific |
| E-filed returns from tax professionals | 73,898,000 | IRS, to April 24, 2026 | Tax-specific |
| Average refund | USD 3,268 | IRS, to April 24, 2026 | Tax-specific |
| Streaming share of US TV time | 49.0% | Nielsen The Gauge, July 2026 | Cross-industry |
| CTV ad spend growth | 11% | IAB 2026 estimate | Cross-industry |
| Invalid traffic, US open programmatic CTV | 18% | Pixalate, Q3 2025 | Cross-industry |
The filing-season curve is the media plan
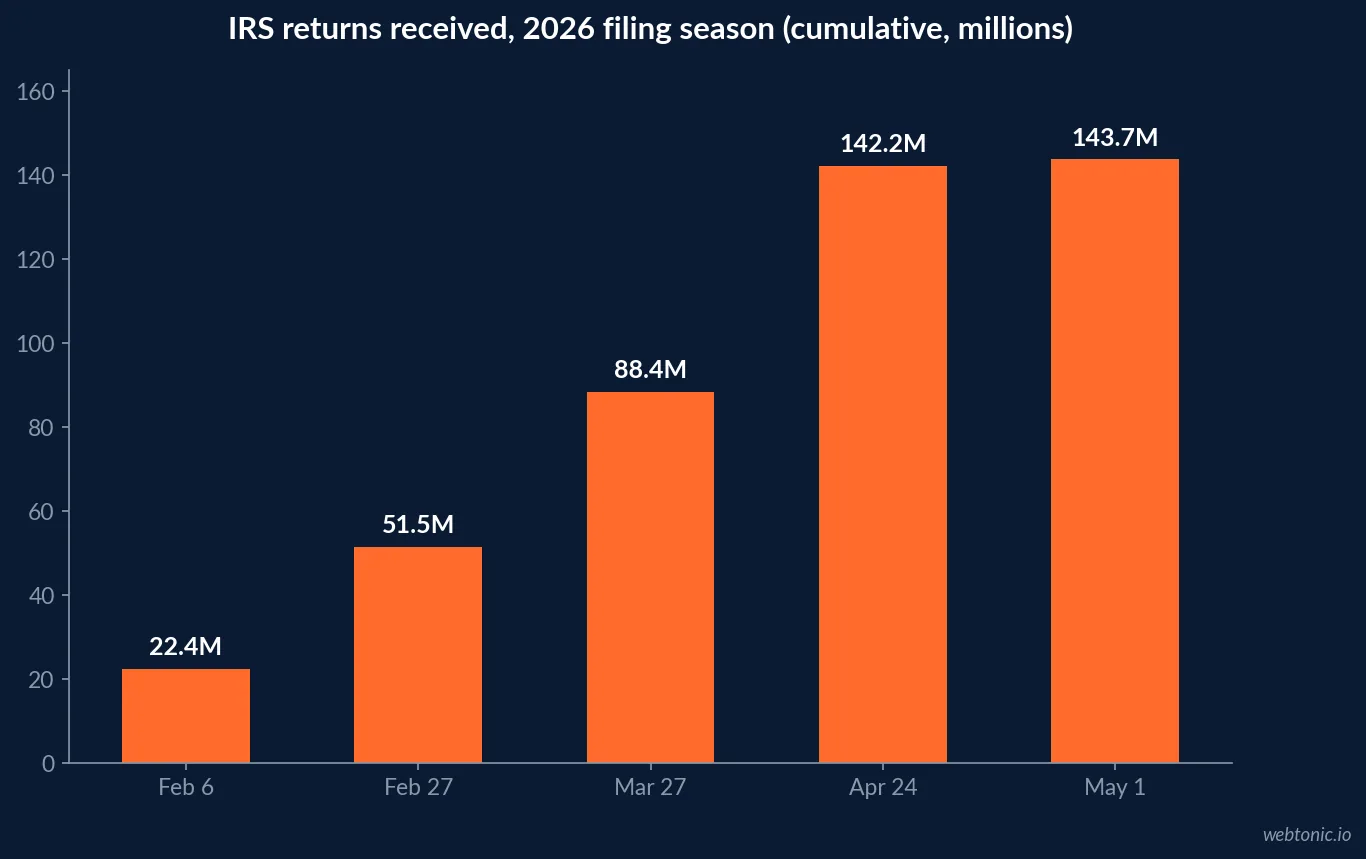
Most categories can spread CTV evenly. Tax cannot, because demand is compressed into about fourteen weeks. The IRS weekly releases show the shape: 22,351,000 returns by February 6, 2026, then 51,491,000 by February 27, 88,424,000 by March 27 and 142,225,000 by April 24. The season opened on January 26, 2026.
Measured against the April 24 count, about 36% arrived in the first five weeks and roughly 38% between March 27 and April 24. A firm that books streaming inventory for March alone misses the early refund filers, and a firm that stops in February misses the extension and deadline crowd.
Week-by-week filing data
The same IRS series splits returns between professional preparers and self-filers. Self-prepared returns dominate early; professionals overtake them as the deadline nears, which is when an accounting firm's message has the most people still looking for help.
| IRS cumulative, 2026 | Returns received | E-filed by tax professionals | E-filed self-prepared |
|---|---|---|---|
| Week ending February 6 | 22,351,000 | 7,865,000 | 14,170,000 |
| Week ending February 27 | 51,491,000 | 23,064,000 | 27,809,000 |
| Week ending March 27 | 88,424,000 | 45,854,000 | 41,017,000 |
| Week ending April 24 | 142,225,000 | 73,898,000 | 65,323,000 |
By April 24, professionals had filed 53% of all e-filed returns. In the first two weeks the split was roughly one in three. That swing is the closest thing to an industry audience signal a tax marketer has: early CTV creative can speak to refund speed, late creative to complexity, extensions and representation.
Refund size shifts through the season
Refund-motivated filers arrive first, and the IRS data shows it in the average refund, which fell as the season went on. At the same time IRS.gov traffic ran far above 2025, a sign of how much of the taxpayer journey starts online before anyone picks up a phone or books an appointment.
| IRS cumulative, 2026 | Average refund | IRS.gov visits | Visits vs 2025 |
|---|---|---|---|
| Week ending February 27 | USD 3,742 | 287,178,000 | +49.8% |
| Week ending March 27 | USD 3,521 | 408,346,000 | +57.0% |
| Week ending April 24 | USD 3,268 | 534,164,000 | +59.8% |
For creative, the numbers suggest a sequence: early spots can speak to getting a refund processed correctly, while later spots can speak to taxpayers who owe, have complex returns or need an extension, a group the average-refund decline implies is growing as a share of filers. The data describes filing behaviour; it does not show that any message performs better, so test both.
Taxpayer friction is part of the message
The National Taxpayer Advocate's 2026 mid-year report recorded 48.1 million calls to the IRS, with 9.9 million answered by assistors (21%) and an average hold of 14 minutes, against a 25% answer rate and 8 minutes the season before. More than one million taxpayers waited beyond normal processing times, averaging about 5.5 weeks.
The Advocate's FY2027 objectives report adds that about 98% of Forms 1040 were filed electronically. Digital behaviour is near-universal; the unmet need is a person to call. That is a factual frame a CTV spot can use without promising any outcome.
Streaming now reaches half of TV time
Nielsen's July 2026 report of The Gauge put streaming at 49.0% of total US TV usage, up 0.5 points on June, with YouTube at a record 14.2%, broadcast at 19.5% and cable at 18.7%. July is outside tax season, and Nielsen notes streaming typically peaks in summer, so a January-to-April share would be slightly lower.
For a practice whose clients skew older, that caveat matters: linear still carries a large share of viewing, so CTV is best treated as a reach extension, not a replacement for every other screen.
Where CTV budgets are coming from
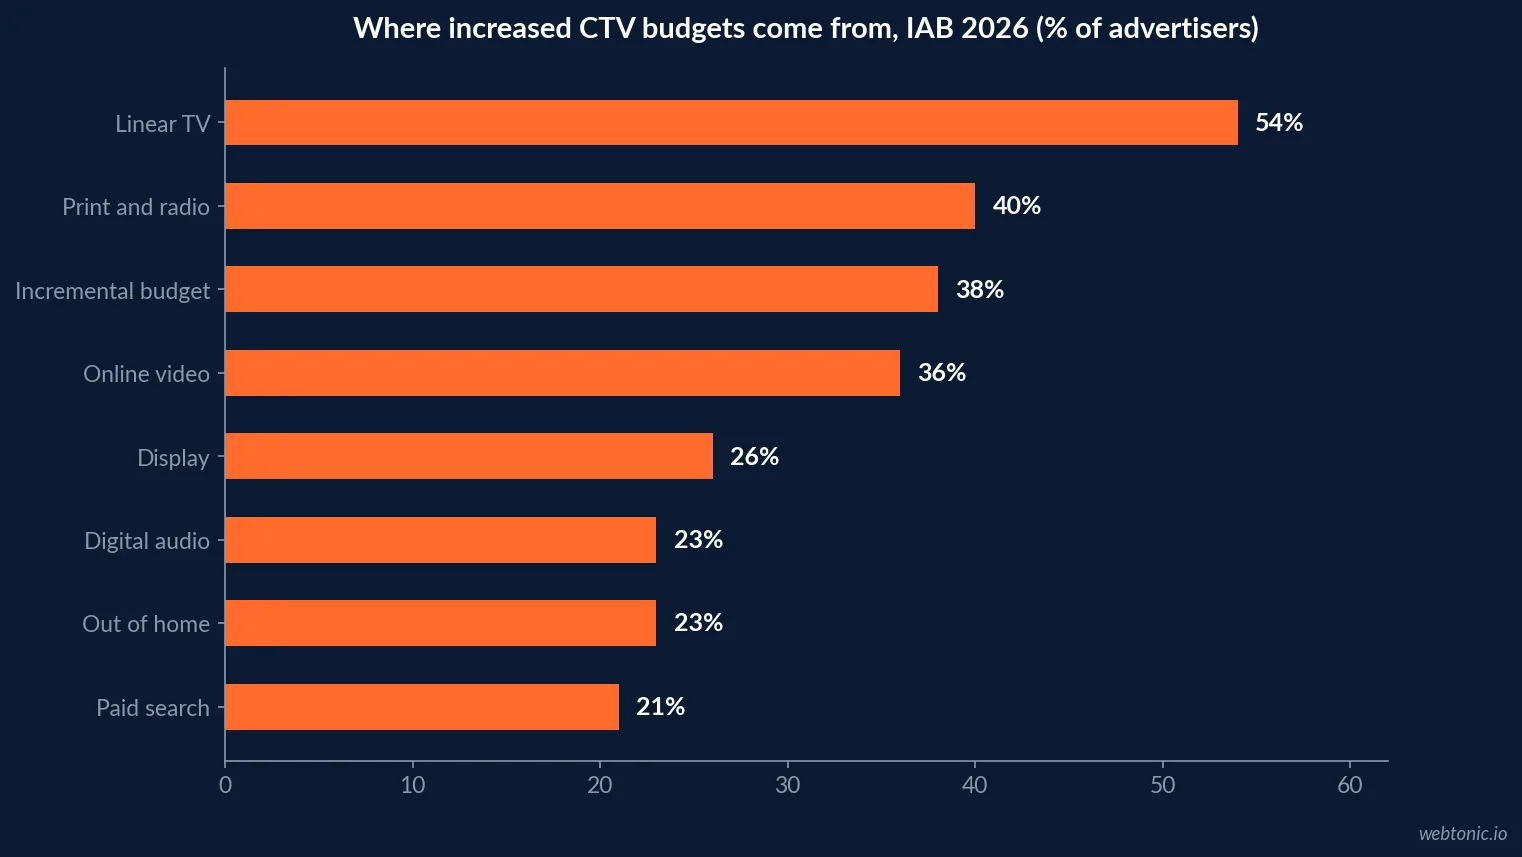
The IAB 2026 Digital Video Ad Spend and Strategy report estimates US digital video ad spend at USD 81.9 billion in 2026, with CTV growing 11%. It puts the financial category's total digital video spend at USD 5.5 billion, up 6%; that category is broad and is not a tax-preparer figure. Among advertisers raising CTV spend (n=149), the money comes from these budgets:
| Budget tapped to fund more CTV (IAB 2026, n=149) | Share of advertisers | Reading for a tax firm |
|---|---|---|
| Linear TV | 54% | Most CTV money is TV money moving screens |
| Print and radio | 40% | Local-media budgets are the next source |
| Incremental budget | 38% | Fresh money, not a swap |
| Digital audio and podcasts | 23% | Audio is rarely cut first |
| Paid search | 21% | Search is the least-raided digital line |
Entry costs published by the platforms
Seasonal businesses benefit from self-serve buying because there is no annual upfront. Roku's help centre states that lifetime budgets are required on every campaign and must be USD 500 or more. Amazon Ads describes its streaming TV ads as having no minimum spend requirement. Tatari wrote in its 2025 planning guide that campaigns can start at about USD 1,000 per week.
| Platform | Published entry point | Fit for a 14-week season |
|---|---|---|
| Roku Ads Manager | USD 500 lifetime budget per campaign | Short flights, start date must be in the future |
| Amazon streaming TV ads | No minimum spend stated | Self-serve and managed options |
| Tatari (managed) | About USD 1,000 per week | Weekly pacing across the season |
These are vendor thresholds. They say nothing about what a tax campaign needs to reach a useful frequency in one metro, which depends on audience size and CPM on the day.
Local and regional buyers are the growth segment
The 2026 CTV/OTT Advertiser Survey by Premion and Advertiser Perceptions (n=151 US advertisers spending at least USD 250,000 a year; Premion sells local CTV, so read it as vendor research) found 70% plan to raise CTV spend by an average of 17%, and 86% agree CTV will grow as a channel for local and regional advertisers. The IAB separately reports the share of small spenders using CTV rising from 60% in 2024 to 85% in 2026.
Most tax and accounting firms buy one metro or a handful of ZIP codes, so geo-targeting is the mechanism that makes CTV usable at all; national reach is wasted spend for a firm that only serves its city.
Fraud and measurement in a short season
Pixalate's Q3 2025 North America benchmarks, built on more than 106 billion programmatic impressions, put invalid traffic at 18% of US open programmatic CTV traffic, the lowest of the US device types measured, against 24% for US mobile apps. In a 14-week window there is no time to discover in April that a fifth of February's impressions were not real.
Practical controls: buy through direct or curated deals where possible, require publisher-level delivery reports, and compare CTV-exposed ZIP codes against unexposed ones on calls and booked appointments.
Circular 230: what a tax CTV spot may say
Anyone practising before the IRS is bound by Circular 230, 31 CFR Part 10. Section 10.30 prohibits any public communication containing a false, fraudulent, coercive, misleading or deceptive statement. It also bars enrolled agents and registered preparers from calling themselves certified or implying an employer relationship with the IRS, and lets practitioners publish fixed fees, hourly rates or fee ranges.
| Claim in a CTV script | Circular 230 status | Safer wording |
|---|---|---|
| IRS-certified preparer | Barred for EAs and registered preparers | Enrolled to practice before the IRS |
| Guaranteed bigger refund | Likely misleading | Describe services, not outcomes |
| We work with the IRS | Implies an IRS relationship | We represent clients before the IRS |
| Flat fee for a simple return | Allowed if accurate | State what the fee covers and costs excluded |
A flighting plan built on the numbers
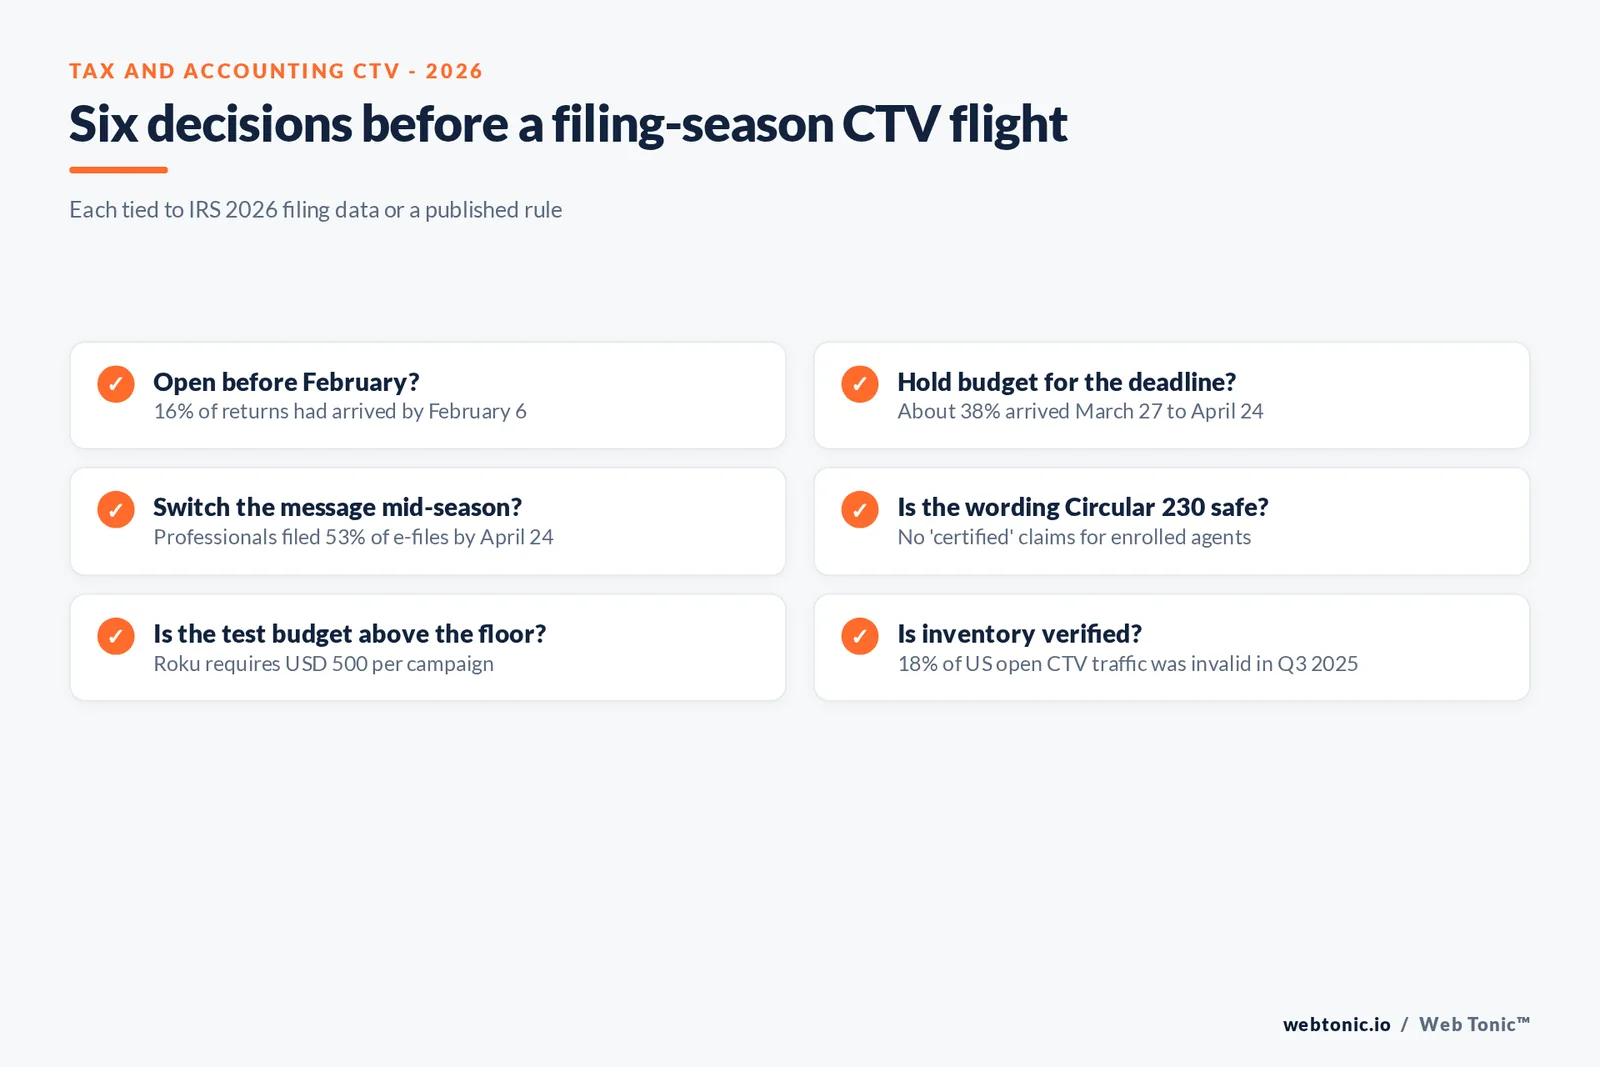
- Open in the last week of January; about 16% of season volume arrived by February 6.
- Weight February for refund-driven filers, when self-prepared returns still outnumber professional ones.
- Shift creative to complexity and representation in late March, as professional filings overtake.
- Hold budget for the final four weeks, when roughly 38% of the season's returns arrived.
- Keep search running; only 21% of CTV-increasing advertisers fund CTV from search.
- Use a post-deadline flight for extension filers and business clients rather than going dark.
What the data cannot tell you
There is no industry CPM, completion rate or cost per new client for tax CTV. Any vendor quoting one should name the dataset. What exists is a well-documented demand calendar, a cross-industry view of streaming reach and cost floors, and a clear rulebook on claims. For related channel data see our connected TV advertising benchmarks, tax and accounting SMS marketing statistics and tax and accounting influencer data, or talk to our performance creative team.
Frequently Asked Questions
Is there a CTV benchmark specific to tax preparers or accounting firms?
No. We found no published CPM, completion rate, cost per lead or ROI for CTV campaigns run by tax or accounting firms. The figures on this page are cross-industry CTV data from Nielsen, the IAB, Tatari, Pixalate and platform pages, combined with IRS filing-season statistics that describe when taxpayer demand actually happens.
When does filing-season demand peak?
IRS cumulative data show 22.4 million returns received by February 6, 2026, 51.5 million by February 27, 88.4 million by March 27 and 142.2 million by April 24. About 36% of the April 24 count had arrived by the end of February and about 38% arrived in the four weeks between March 27 and April 24.
What does it cost to test CTV for a tax practice?
Platform minimums are the floor, not a recommendation. Roku Ads Manager requires a lifetime campaign budget of at least USD 500. Amazon says its streaming TV ads carry no minimum spend requirement. Tatari has said campaigns can start at about USD 1,000 per week. None of these are industry prices; they are entry points set by the vendors.
What advertising rules apply to tax professionals on TV?
Practitioners before the IRS fall under Circular 230 (31 CFR Part 10). Section 10.30 bars any public communication with a false, fraudulent, coercive, misleading or deceptive claim, and bars enrolled agents and registered preparers from using the term certified or implying an employment relationship with the IRS.
Should a firm move money from search into CTV?
The IAB's 2026 study found that among advertisers increasing CTV budgets, 21% planned to fund it partly from paid search, against 54% from linear TV. For a tax practice that relies on deadline searches, the evidence supports adding CTV alongside search rather than replacing it.
Sources
IRS / National Taxpayer Advocate, 2026 mid-year report
IRS filing season statistics, week ending April 24, 2026
Taxpayer Advocate Service, FY2027 objectives report
eCFR, 31 CFR Part 10 (Circular 230)
Nielsen, The Gauge, July 2026
IAB, 2026 Digital Video Ad Spend and Strategy report
Pixalate, Q3 2025 North America IVT benchmarks
Roku Ads Manager, campaign budget and schedule
Amazon Ads, streaming TV ads
Tatari, how to budget and plan for TV in 2025
Premion / Advertiser Perceptions, 2026 CTV/OTT survey


