



Table of contents
Streaming reached 49.0% of US TV viewing in July 2026, and connected TV now sells on four metrics: completion rate, CPM, reach and frequency, and traffic quality. This page gives each one from a named dataset with its year, and flags where a benchmark is weaker than it looks.
Key Takeaways
- Streaming took 49.0% of US TV time in July 2026 (Nielsen); YouTube alone took 14.2%.
- US digital video ad spend is projected at USD 81.9 billion in 2026; CTV grows 11% (IAB).
- Digital video passes 61% of total TV/video spend in 2026 for the first time.
- Interactive CTV completion rates rose from 85% to 95% in Innovid's 2021 dataset.
- Tatari's 2019-2023 data put streaming CPMs at USD 9.50 against USD 2.50 for linear.
- Sponsorship CPMs run 2 to 3 times standard streaming but deliver 62% higher response (Tatari 2026).
- 25% of US open programmatic CTV traffic was invalid in Q2 2026 (Pixalate).
- Roku's self-serve minimum is USD 500 per campaign.
CTV benchmarks at a glance
The table collects the headline number for each metric a CTV buyer is usually quoted, with the dataset and period behind it. Periods differ because the underlying reports are published on different cycles; none of these is an industry-specific benchmark.
| Metric | Benchmark | Dataset | Period |
|---|---|---|---|
| Streaming share of US TV time | 49.0% | Nielsen The Gauge | July 2026 |
| US digital video ad spend | USD 81.9 billion | IAB / Guideline | 2026 estimate |
| CTV ad spend growth | 11% | IAB | 2026 estimate |
| Interactive CTV completion rate | 95% | Innovid Global Benchmarks | 2021 impressions |
| Streaming vs linear CPM | USD 9.50 vs USD 2.50 | Tatari client data | 2019-2023 |
| Invalid traffic, US open programmatic CTV | 25% | Pixalate | Q2 2026 |
Streaming is now half of TV viewing
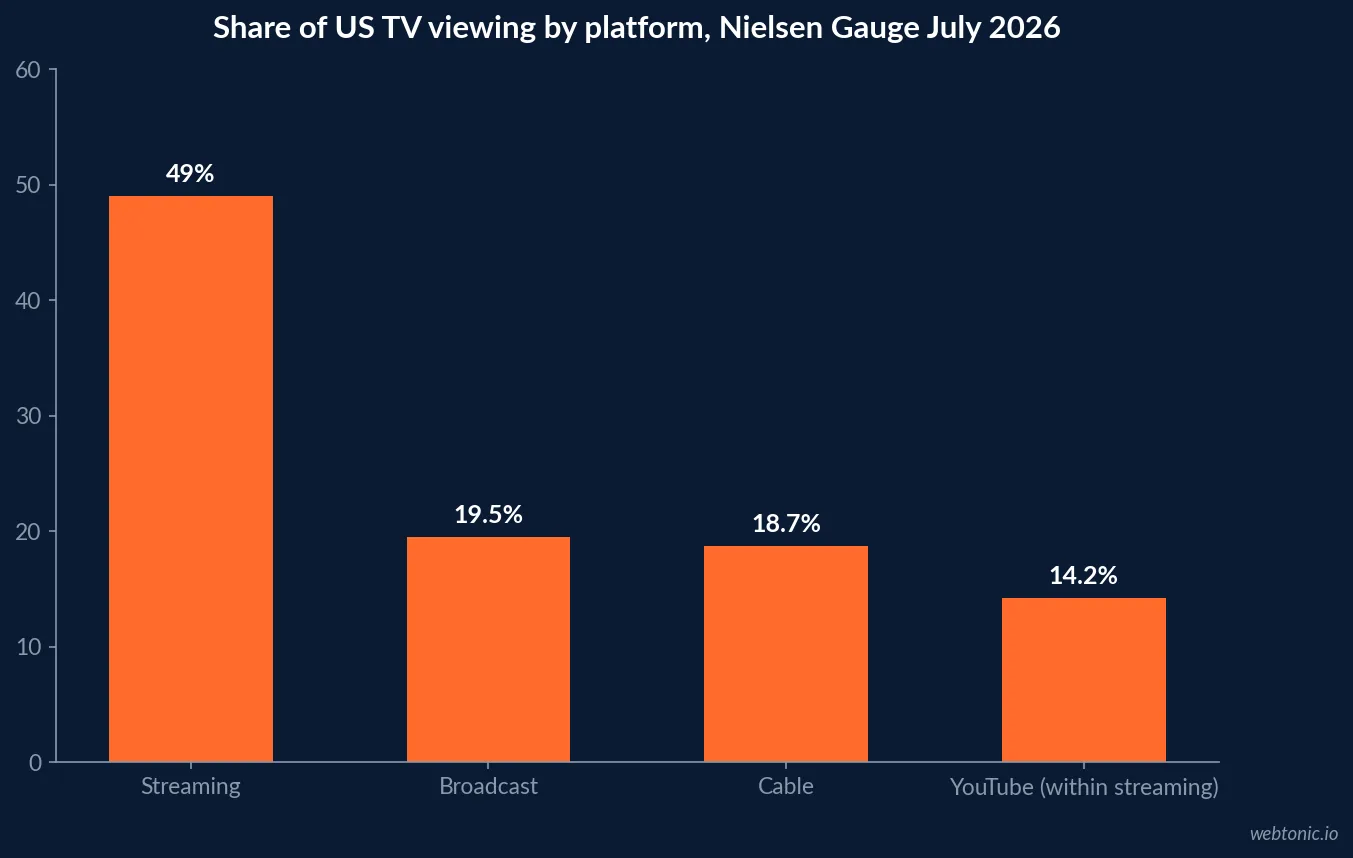
Nielsen's July 2026 report of The Gauge put streaming at 49.0% of total TV usage, up 0.5 points, with streaming usage up 3.4% on June. YouTube rose 6% month on month to a record 14.2% of TV, broadcast held 19.5% and cable 18.7%, even with FIFA World Cup coverage lifting broadcast.
The ad-supported view matters more for buyers. Nielsen's Q2 2026 Ad Supported Gauge put ad-supported TV at 71.5% of total viewing and streaming at 48.2% of that ad-supported time, up 1.6 share points, with cable at 25.2%. Among adults 18+, streaming drops to 44.4%, so the audience you are buying changes the share you are buying.
Where CTV spend stands in 2026
The 2026 IAB Digital Video Ad Spend and Strategy Report, built with Guideline estimates and a buyer survey of 360 respondents, projects US digital video ad spend at USD 81.9 billion in 2026, up 11% and nearly 20% faster than the total ad market. CTV grows 11%, social video 13% and online video 10%; social video overtook CTV in spend volume in 2025.
Digital video will account for 61% of total TV/video spend in 2026, against 58% in 2025 and 38% in 2021. Among advertisers raising CTV budgets, 54% are taking the money from linear TV and 40% from print and radio.
| TV/video spend split (IAB, Guideline estimates) | Linear TV | Digital video |
|---|---|---|
| 2021 | 62% | 38% |
| 2022 | 58% | 42% |
| 2023 | 52% | 48% |
| 2024 | 49% | 51% |
| 2025 | 42% | 58% |
| 2026 estimate | 39% | 61% |
Video completion rates: high by design
Completion benchmarks come from ad-server datasets. Innovid's CTV Takes Center Stage Global Benchmarks report, covering 286 billion video impressions served in 2021, found interactive CTV completion rates rising from 85% to 95%, against 62% for PC and mobile combined. Across devices, ads of 30 seconds or less completed at 80% or more, while longer ads completed at 67% to 77%, and over 95% of all video ads ran 30 seconds or less.
Innovid itself explains the CTV figure: a viewer typically must watch the ad for the content to continue. That is why a mid-90s VCR on CTV is the baseline, not a win. It confirms delivery; it does not measure attention or outcome.
| Completion benchmark (Innovid, 2021 impressions) | Completion rate | What it tells a buyer |
|---|---|---|
| Interactive CTV, 2021 | 95% | Near-universal, largely non-skippable |
| Interactive CTV, 2020 | 85% | Baseline the year before |
| PC and mobile combined | 62% | Skippable environments complete far less |
| Ads 30 seconds or shorter, all devices | 80% or more | Short spots complete best |
| Ads longer than 30 seconds, all devices | 67% to 77% | Length costs completion |
CPMs: streaming versus linear, direct versus programmatic
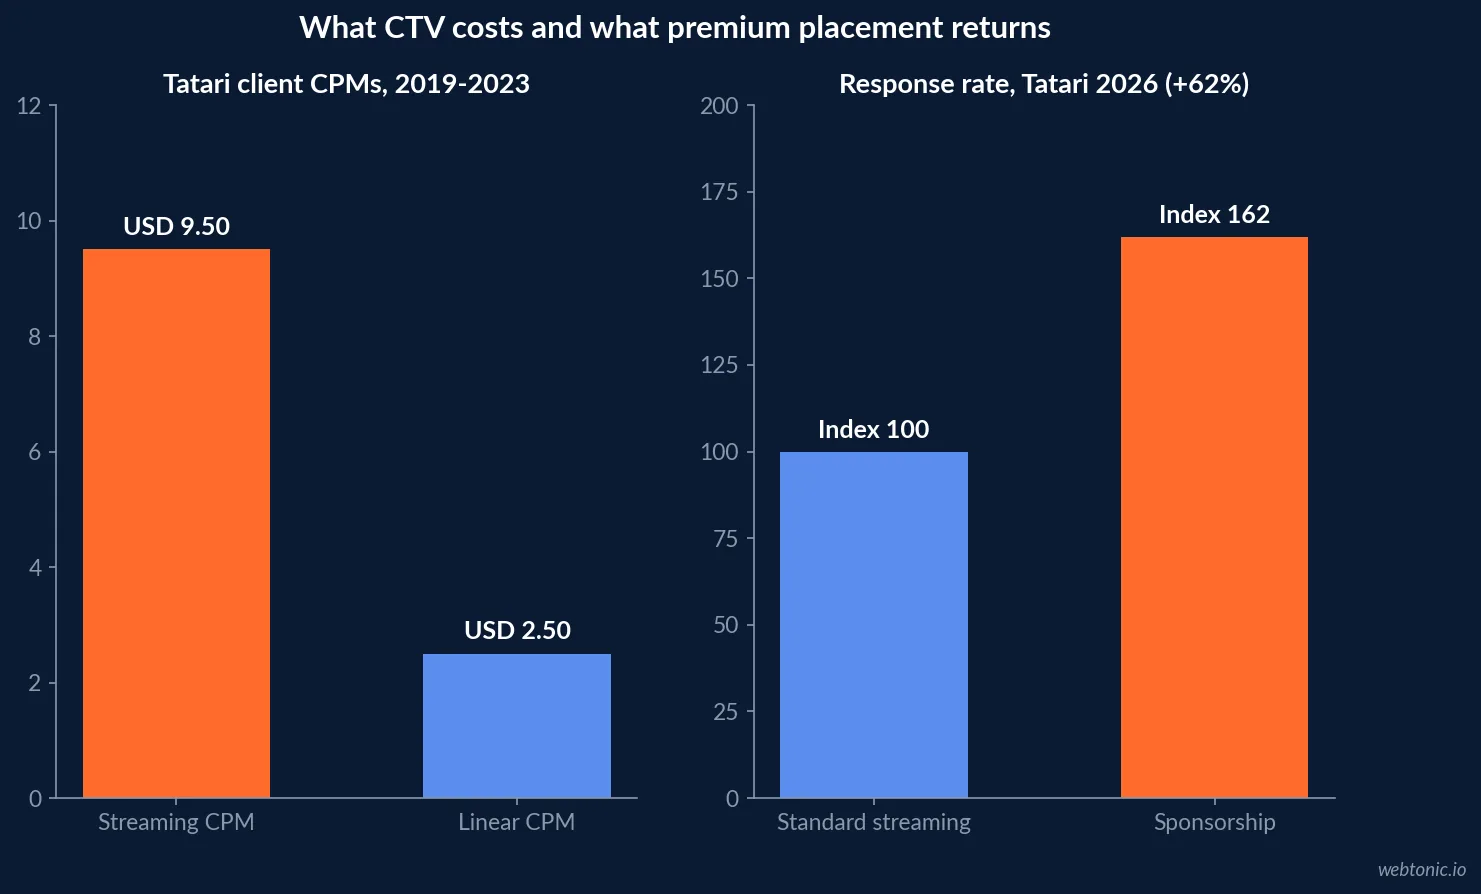
Tatari's analysis of its own client data from 2019 to 2023 found streaming CPMs typically three to four times linear, about USD 9.50 against USD 2.50. Tatari adds that its streaming CPMs are already well below market because of direct publisher deals, often 66% lower than buying programmatically. Treat the USD 9.50 as a direct-buy floor, not a market average.
Premium placements cost more. Tatari's June 2026 sponsorship analysis puts in-show sponsorship CPMs at 2 to 3 times standard streaming placements, but reports 62% higher response rates, about 75% incremental audience, and roughly 90% of CTV impressions coming from just ten publishers.
Reach and frequency: the metrics VCR hides
Innovid's CTV Advertising Insights Report 2024 found CTV made up 53% of the video impressions its ad server delivered in 2023, up 12%, from almost 380 billion impressions. Average frequency across CTV campaigns was 7.42, and campaigns using five or fewer publishers reached 87% unique reach.
The 2021 dataset shows how small most campaigns are: US CTV campaigns reached on average only 9.23% of more than 95 million CTV households. High completion on a small, heavily repeated audience is a common CTV outcome, and it is invisible if VCR is the only number on the report.
Minimum spends: what it takes to start
Self-serve tools have pulled the entry price down. Roku's Ads Manager help centre states lifetime budgets are required on all campaigns and must be USD 500 or more, and Roku's own cost guide says USD 500 to 1,000 is enough for most first-time advertisers. Amazon Ads lists a USD 10,000 recommended minimum for self-service streaming TV packages and USD 50,000 for managed service.
The IAB links the shift to smaller buyers: the share of small spenders investing in CTV rose from 60% in 2024 to 85% in 2026, with self-serve platforms lowering the barrier.
| Platform entry point (vendor pages) | Minimum | Buying model |
|---|---|---|
| Roku Ads Manager | USD 500 lifetime budget | Self-serve, dynamic CPM |
| Roku, first test (Roku guidance) | USD 500-1,000 | Enough to start learning |
| Amazon streaming TV, self-service | USD 10,000 recommended | Amazon DSP |
| Amazon streaming TV, managed service | USD 50,000 | Amazon Ads team |
Fraud and inventory quality
Pixalate's Q2 2026 benchmarks, drawn from more than 80 billion programmatic impressions, put invalid traffic at 25% of US open programmatic CTV traffic and 26% globally. Its Q1 2026 supply chain report gives North American share of voice to Roku at 36%, Amazon Fire TV 19%, Samsung 15%, Apple TV 13% and LG 4%.
Buyers notice. In the IAB's July 2026 full report, 43% of buyers expressed somewhat to no confidence in inventory quality even within the most trusted buying methods. Integral Ad Science's 21st Media Quality Report puts global video viewability at 79.7%, against 67.9% for display.
How CTV fraud compares with other environments
CTV is not the worst environment for invalid traffic, but it is not the clean one either. Pixalate's Q2 2026 US benchmarks put mobile app traffic at 39% invalid, desktop and mobile web at 25% and CTV at 25%. Globally the rates were 41% for mobile app, 20% for web and 26% for CTV. Because CTV CPMs sit well above web and app CPMs, the same invalid share wastes more money per impression.
Device concentration shapes where that risk sits. With Roku holding 36% of North American programmatic share of voice in Q1 2026 and Amazon Fire TV 19%, a buyer's exposure depends heavily on how two or three device ecosystems police their app supply.
| Environment (Pixalate, Q2 2026) | US invalid traffic rate | Global invalid traffic rate |
|---|---|---|
| Connected TV | 25% | 26% |
| Mobile app | 39% | 41% |
| Desktop and mobile web | 25% | 20% |
What buyers now prioritise
The IAB found targeting overtook content quality as the top criterion for TV and video buys, up 10 points year on year, with small and mid-size spenders (under USD 50 million a year) driving it at +23 points. For a CTV plan, that means audience definition and household matching are now the first questions, ahead of which show the ad runs in.
None of these benchmarks is industry-specific. Use them as cross-industry reference points and set the actual targets on your own site-visit, conversion and incrementality data.
How to read a CTV report in 2026
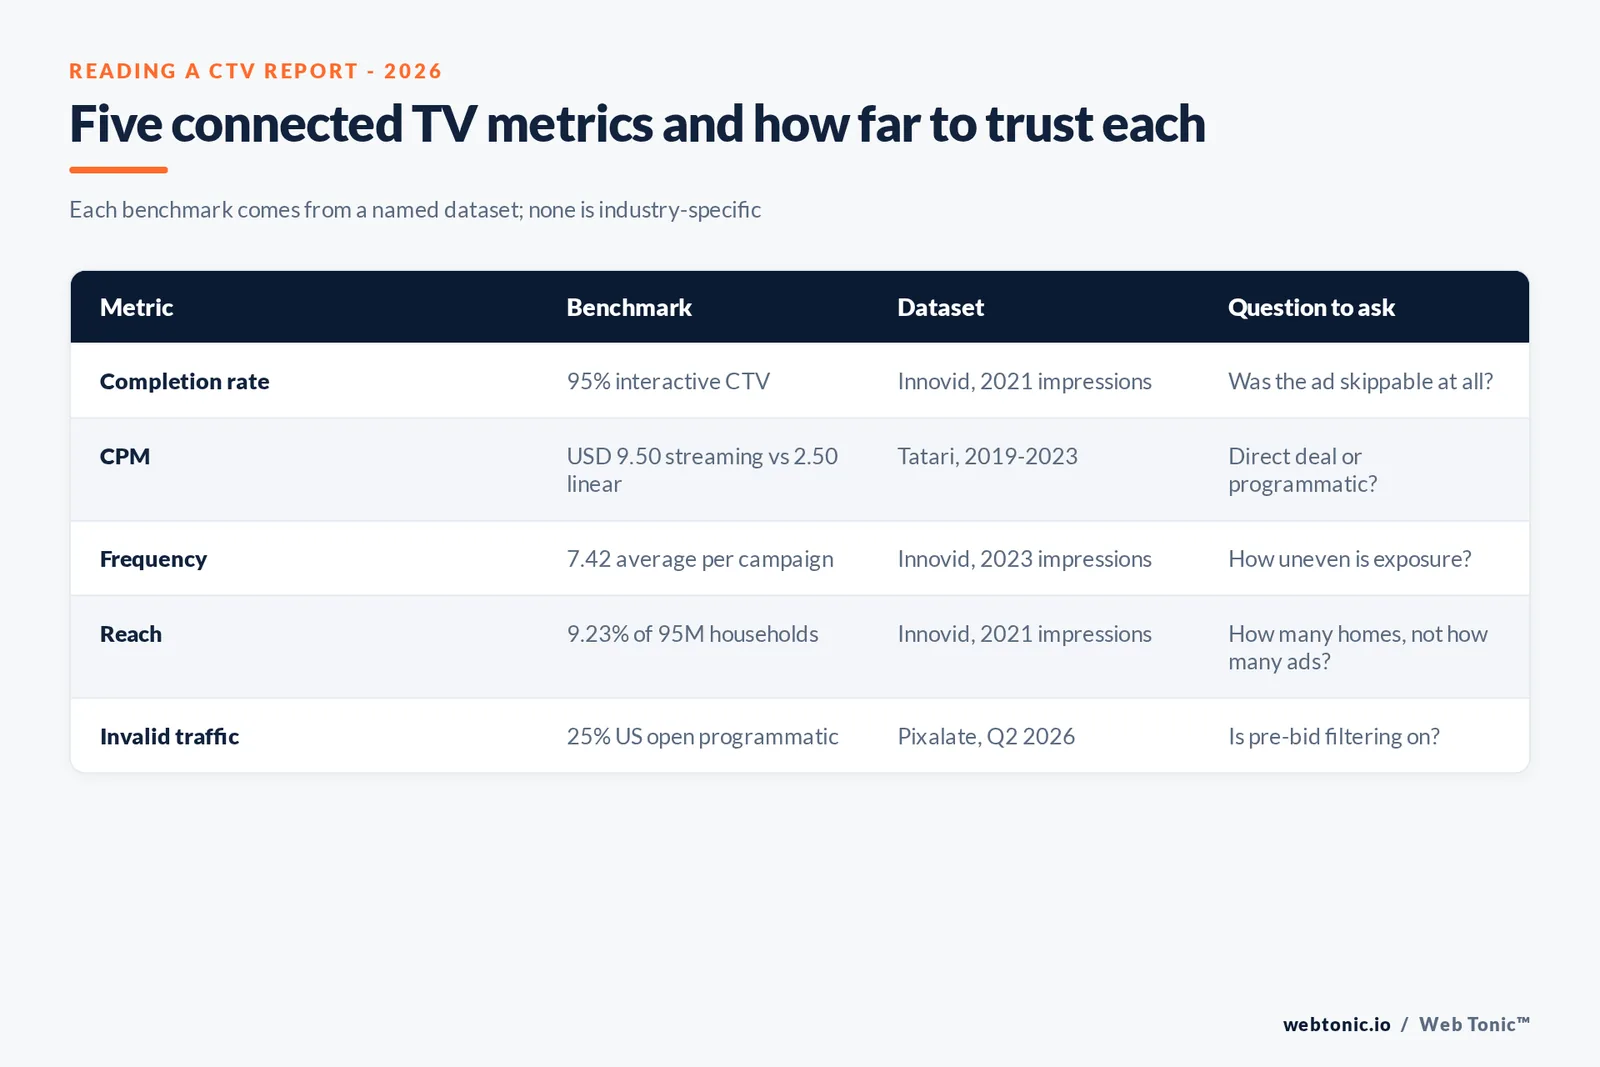
- Discount VCR. A 95% completion rate is the norm for non-skippable inventory.
- Ask for reach and frequency. An average frequency of 7.42 hides very uneven exposure.
- Ask how the CPM was bought. Direct deals can sit 66% below programmatic.
- Ask for IVT filtering. 25% of open programmatic CTV traffic was invalid in Q2 2026.
- Start small, then scale. Self-serve entry points begin at USD 500.
Our data intelligence team sets up CTV measurement and incrementality, and our performance creative team builds TV-ready spots. For viewing context, read our streaming media statistics and the wider advertising statistics.
Frequently Asked Questions
What is a good video completion rate on connected TV?
Most CTV inventory is non-skippable, so completion rates are high by design. Innovid's Global Benchmarks report, covering 286 billion impressions served in 2021, found interactive CTV completion rates rising from 85% to 95%, against 62% for PC and mobile combined, and ads of 30 seconds or less completing at 80% or more across devices. A CTV VCR in the mid-90s is normal; it tells you the ad ran, not that it worked.
How much does CTV cost per thousand impressions?
It depends heavily on how it is bought. Tatari's client data from 2019 to 2023 put streaming CPMs at about USD 9.50 against USD 2.50 for linear, and Tatari notes those streaming rates are already below market because of direct publisher deals. Tatari's 2026 sponsorship data puts in-show sponsorship CPMs at 2 to 3 times standard streaming placements. Programmatic and premium publisher rates run higher than direct-deal averages.
What is the minimum budget for connected TV advertising?
Self-serve platforms have lowered the entry point. Roku Ads Manager requires a lifetime campaign budget of at least USD 500 and says USD 500 to 1,000 is enough for most first-time advertisers to start learning. Amazon's streaming TV ads carry a USD 10,000 recommended minimum for self-service packages and USD 50,000 for managed service.
How much CTV traffic is invalid or fraudulent?
Pixalate's Q2 2026 benchmarks put invalid traffic at 25% of open programmatic CTV traffic in the United States and 26% globally, based on more than 80 billion impressions. The figure covers open programmatic supply; direct and curated deals typically carry less exposure, which is one reason 43% of buyers in IAB's 2026 study expressed somewhat to no confidence in inventory quality.
What share of TV viewing is streaming now?
Nielsen's The Gauge put streaming at 49.0% of total US TV viewing in July 2026, up 0.5 points on June, with YouTube alone at a record 14.2%. Broadcast held 19.5% and cable 18.7%. Within ad-supported TV, streaming reached a 48.2% share in Q2 2026.
Sources
Nielsen - July 2026 The Gauge report
Nielsen - Q2 2026 Ad Supported Gauge
IAB - 2026 Digital Video Ad Spend and Strategy Full Report
IAB - Business outcomes are just the beginning (July 2026)
Innovid - CTV Takes Center Stage Global Benchmarks Report (2021 data)
Innovid - CTV Advertising Insights Report 2024
Tatari - What's driving down linear CPMs
Tatari - Streaming sponsorships drive higher response than standard CTV (2026)
Pixalate - Q2 2026 Ad Fraud Benchmarks Report for North America
Pixalate - Q1 2026 CTV Ad Supply Chain Trends Report
Roku Self Serve Help Center - Campaign budget and schedule
Roku Advertising - How much does it cost to advertise on Roku?
Amazon Ads - Streaming TV ads
Integral Ad Science - 21st Media Quality Report


