Table of contents

Accounting firms report that 57% of clients arrive by referral and 3% from advertising - then plan budgets on that number. The 2026 attribution data shows how much of the actual buying journey those two figures hide.
Key Takeaways
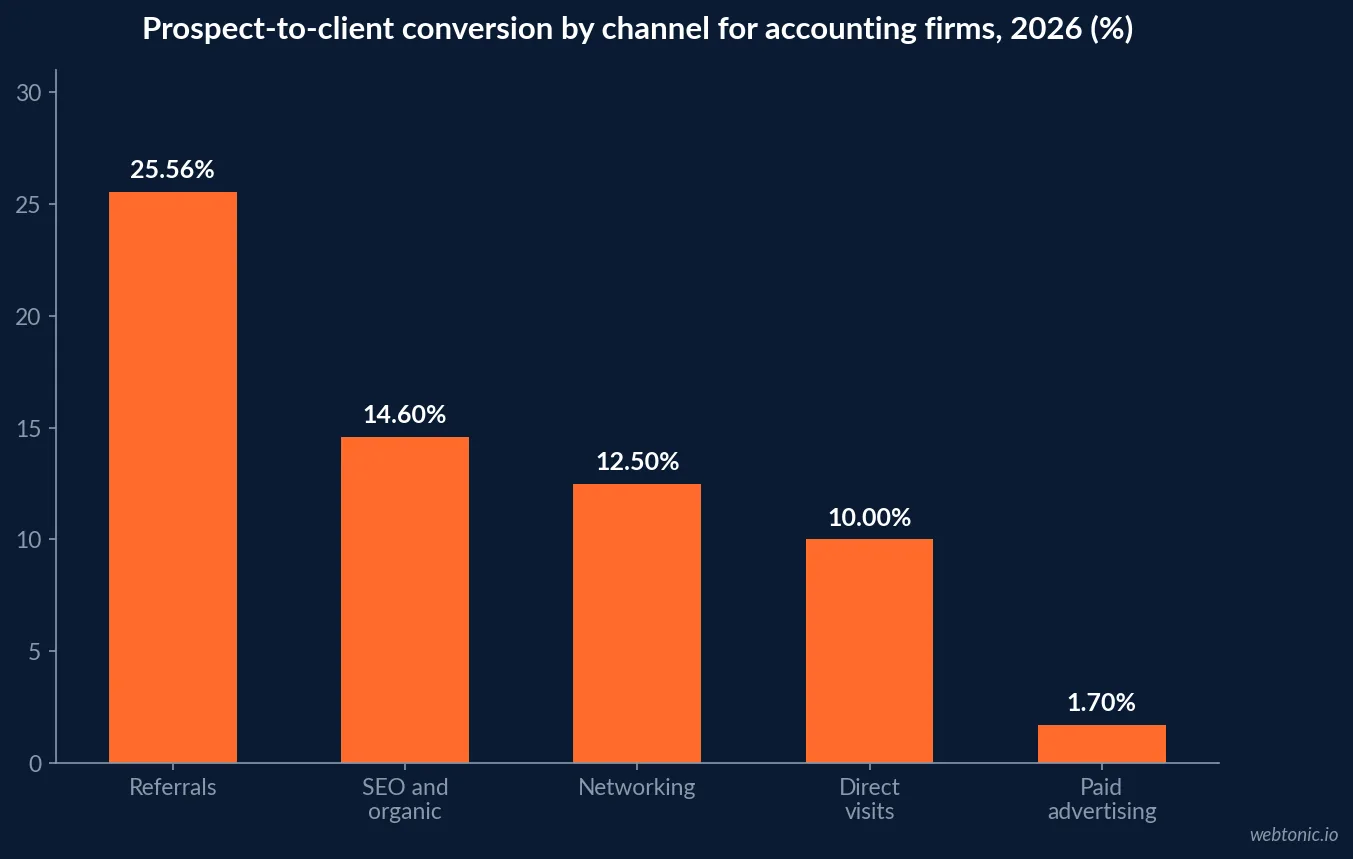
- Referrals convert at 25.56% prospect-to-client - the strongest channel in accounting.
- SEO and organic convert at about 14.6%; networking 10-15%; direct 8-12%.
- Paid advertising converts at 1.7% prospect-to-client - a 15x gap to referral.
- 57% of clients name a referral as their source; only 3% name advertising.
- Tax season drives 60%+ of annual acquisition, breaking annual averages.
- Median accounting Google Ads CPC is $4.44 with a $101 CPA and a 4.40% conversion rate.
- Meta CPC $2.84 at 0.64% CTR and 2.4x ROAS; LinkedIn CPL $84.40.
- Landing pages convert at 3.20%; email opens 22.8% at 2.4% CTR.
- Working CPL band is $200-$2,000: content and SEO $200-$800, paid and events $500-$2,000.
- CAC runs $1,000-$8,000; lead-to-client conversion 5-20%.
- Website visitor-to-lead conversion is 1.0-3.0%, or 3.0-5.0% for optimised niche sites.
- Target LTV:CAC of 3:1 or better and revenue-to-spend of 3:1 to 5:1, best-in-class above 8:1.
- Keep acquisition cost under 10% of first-year revenue; payback under 12 months for advisory.
- 45% of B2B marketers use attribution tools; 58% run CRM integrated with automation.
- Multi-touch attribution adoption is 47% and marketing mix modelling 26%.
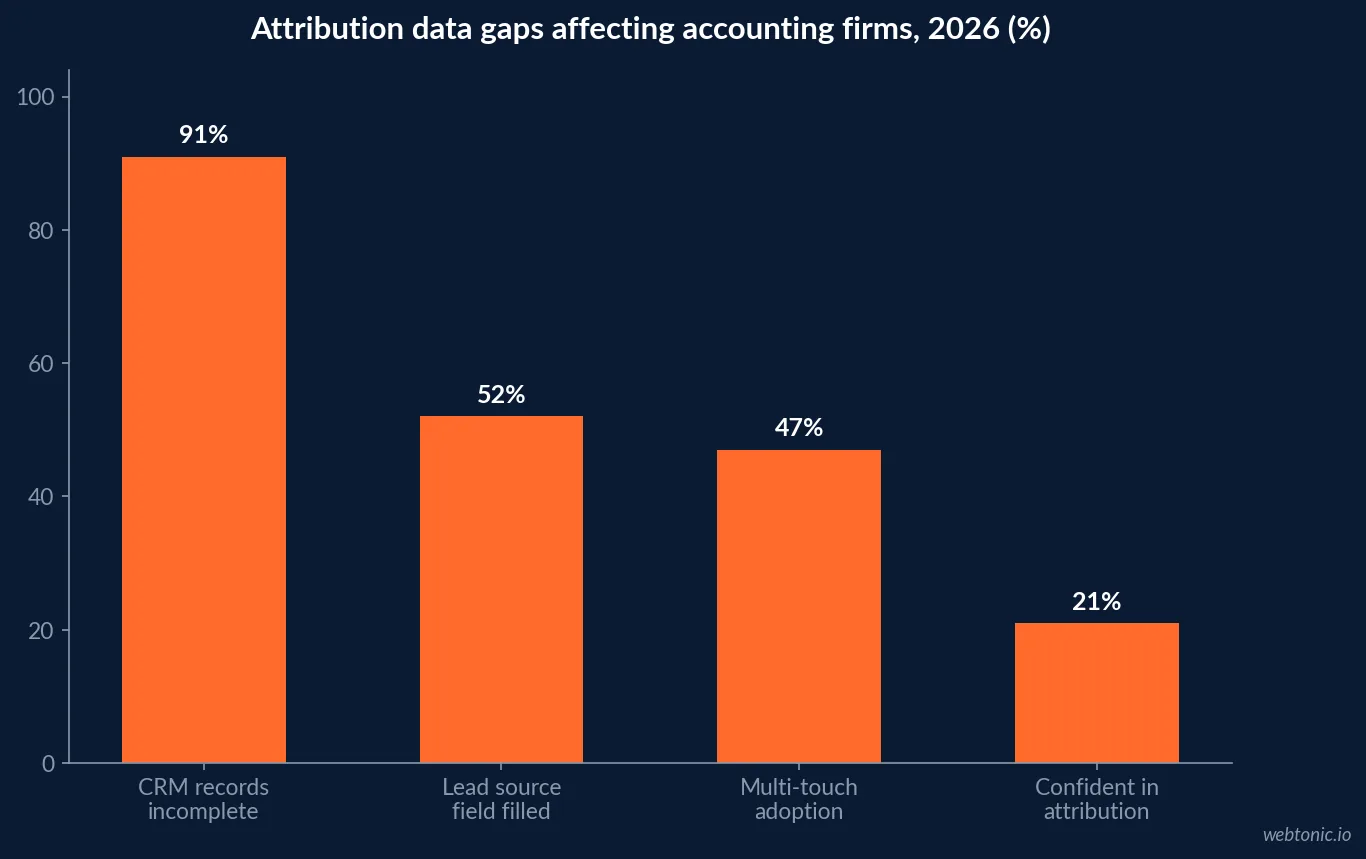
- 91% of CRM records are incomplete and only 52% of users fill the lead-source field.
- B2B journeys average 14 touchpoints over 8.3 months - longer than most reporting windows.
- Only 21% of teams are confident in their attribution, with 38% of pipeline in the dark funnel.
- High-growth firms invest 9.0% of revenue in marketing versus a 5% industry median.
- Median firm fee growth is 6.7%, so misallocated spend now costs real growth.
The self-reported source is not the attribution
Two 2026 datasets sit awkwardly beside each other. The first: 57% of businesses found their accountant through a peer referral and 3% through advertising. The second: every referred prospect then searches the firm, reads service pages and checks LinkedIn before making contact, which the NJCPA describes as a six-step research sequence that can silently kill the introduction.
Both are true. The client’s honest answer is "a referral", because that is what they remember. The firm then reads that answer as a budget instruction and defunds the digital layer the referral had to survive. Attribution in accounting is less about assigning fractional credit and more about not mistaking a memory for a measurement.
| Channel | Prospect-to-client conversion | Lead quality | Acquisition cost |
|---|---|---|---|
| Referrals | 25.56% | High | Low |
| SEO and organic search | 14.6% | Medium to high | Medium |
| Traditional networking | 10-15% | Medium | Medium |
| Direct website visits | 8-12% | Medium | Low |
| Paid advertising | 1.7% | Low to medium | High |
| Advertising as named source | 3% of clients | n/a | Under-credited |
Channel conversion rates, and why paid looks worse than it is
2026 industry data puts referral conversion at 25.56%, SEO at 14.6% and paid advertising at 1.7%. Read as a scoreboard, that argues for cancelling paid media. Read as an attribution artefact, it argues something different: referrals enter the funnel pre-qualified and pre-trusted, while paid enters at the top with strangers. Comparing their conversion rates compares two different funnel positions.
The economics have to be judged separately. Benchmark medians for the sector show Google Ads at a $4.44 CPC, 2.84% CTR, 4.40% conversion rate and $101 CPA, Meta at a $2.84 CPC and 2.4x ROAS, LinkedIn at an $84.40 CPL, and landing pages converting at 3.20%. Against a client worth thousands of dollars a year on a service with reported client retention around 92%, a $101 cost per acquired lead is not the problem. The problem is that nobody can prove which of those leads later described themselves as a referral.
| Metric | Accounting median | Note | Attribution risk |
|---|---|---|---|
| Google Ads CPC | $4.44 | 2.84% CTR | Brand terms inflate reported ROAS |
| Google Ads CPA | $101.00 | 4.40% conversion rate | Consultation vs client confusion |
| Meta Ads CPC | $2.84 | 0.64% CTR, 2.4x ROAS | View-through credit |
| LinkedIn CPL | $84.40 | Outperforms Google for business clients | Long lag to engagement letter |
| Landing page conversion | 3.20% | Site median | Form-only tracking misses calls |
| 22.8% open, 2.4% CTR | Retention channel | Credited as direct traffic |
The season is the measurement problem
Benchmark data notes that tax season from January to April drives 60%+ of annual acquisition. That single fact invalidates most default reporting. A 12-month average CPL blends a compressed auction with eight quiet months; a 30-day attribution window that works in February discards the September research that produced the February enquiry; and a firm that judges Q3 media on Q3 signed engagements will cut the campaigns that fill the season.
The B2B journey data explains the mismatch: buyers average 14 touchpoints across an 8.3-month cycle, so a 60-day selling window sits at the end of a research process that started two or three quarters earlier. Attribution windows in accounting should be set to the cycle, not the season, and reported season-over-season rather than month-over-month.
| Reporting habit | What breaks | Better practice | Why |
|---|---|---|---|
| 12-month average CPL | Blends peak and trough | Split season vs off-season | 60%+ of acquisition in Q1 |
| 30-day attribution window | Drops upper-funnel | Match the 8.3-month cycle | 14 touchpoints per buyer |
| Month-over-month growth | Seasonal noise | Season-over-season | January is not December |
| Last-click only | Credits brand search | Multi-touch or holdouts | 47% adoption in B2B |
| Form conversions only | Misses phone enquiries | Call tracking as a conversion | Phone dominates enquiries |
| Judging Q3 on Q3 signings | Cuts season pipeline | Cohort by enquiry quarter | Lag is structural |
The data layer is thinner than the dashboard suggests
Attribution tooling in the profession is partial: 45% of B2B marketers use attribution tools and 58% run a CRM integrated with marketing automation. Across B2B generally, multi-touch attribution adoption has reached 47% and marketing mix modelling 26%, while only 21% of teams are confident in their numbers and 38% of pipeline sits in the dark funnel.
Then there is data hygiene, which is where most accounting-firm attribution actually fails: 91% of CRM records are incomplete and only 52% of CRM users fill the lead-source field. A practice-management system built to track deadlines and WIP is not a source-of-truth for marketing origin, and no modelling layer repairs a blank field. Our data intelligence work usually starts here rather than with a new tool.
Paid channels are the easiest place to see the damage: our Google Ads cost guide shows how much of a reported CPA is brand search that would have converted anyway.
CAC, CPL and the ratios that decide the budget
Working 2026 ranges for the profession put CPL at $200-$2,000, CAC at $1,000-$8,000 and lead-to-client conversion at 5-20%, with website visitor-to-lead at 1.0-3.0% and 3.0-5.0% for optimised niche sites. Content and SEO trend toward the $200-$800 end of CPL over 12-24 months; paid search and events sit at $500-$2,000.
The ratios matter more than the absolutes. Target LTV:CAC of 3:1 or better, revenue-to-marketing spend of 3:1 to 5:1 with best-in-class above 8:1, payback under 12 months for advisory and under 24 for enterprise engagements. A complementary guardrail from agency benchmarks is keeping client acquisition cost under 10% of first-year revenue against net margins of 15-40%. Service line changes the maths: compliance tax work carries lower LTV and needs a lower CAC, while CFO and advisory services justify the highest.
| Measure | Working range | Target | Service-line note |
|---|---|---|---|
| Cost per lead | $200-$2,000 | $200-$800 from content and SEO | Paid and events at the top end |
| Customer acquisition cost | $1,000-$8,000 | Under 10% of first-year revenue | Advisory justifies the top |
| Lead-to-client | 5-20% | Above 15% with qualification | Referral-heavy mixes run higher |
| Visitor-to-lead | 1.0-3.0% | 3.0-5.0% for niche sites | Requires a booking path |
| LTV:CAC | Varies | 3:1 or better | Compliance work is thinner |
| Revenue-to-spend | 3:1 to 5:1 | 8:1 best-in-class | Referral scale lifts this |
Where the budget disagreement usually comes from
High-growth accounting and financial services firms invest 9.0% of revenue in marketing against a 5% industry median, grow 3.5x faster and run 37.7% profitability. Partners looking at a 3% advertising attribution number and a 25.56% referral conversion rate will not approve that budget, and they are being rational with the data they have. That is exactly why the measurement problem is a growth problem: with median fee growth at 6.7% and falling from 9.1%, misallocated spend now shows up in the accounts.
The practical fix is a two-question intake and an evidence log. Ask the client what prompted them, and record separately every observable pre-contact touch. Within two seasons the firm has a matched pair of datasets - what clients say and what they did - and the budget conversation stops being an argument about beliefs. See how we structure that in our growth marketing engagements.
A minimum viable attribution stack for a firm
- Mandatory lead-source field with a short closed list - the fix for the 52% fill rate and 91% incomplete records.
- Open-text "how did you hear about us" on every intake form, kept alongside the closed list rather than instead of it.
- Call tracking with dynamic numbers, treated as a primary conversion, not a footnote.
- UTM discipline on every campaign, newsletter and partner link, so direct traffic stops absorbing email and referral clicks.
- Conversion on the booking, not the contact-page view - and add scheduling if the site lacks it.
- Season cohorts: group enquiries by the quarter they started, not the quarter they signed.
- Monthly reconciliation of signed engagement letters against recorded sources, with unknowns counted rather than hidden.
- One owner for the numbers - if nobody presents them monthly they decay; talk to us if that owner does not exist yet.
- One brand-search baseline per quarter as the cheapest proxy for reputation-driven demand.
| Firm size | Attribution setup | Effort | What it answers |
|---|---|---|---|
| Solo to 5 staff | Lead-source field, call tracking, UTMs | Low | Which channel starts enquiries |
| 6-25 staff | CRM plus automation integration | Medium | Cost per client by channel |
| 26-100 staff | Multi-touch model, season cohorts | Medium-high | Upper-funnel contribution |
| 100+ staff | MMM plus incrementality holdouts | High | True marginal return |
| Any size, season peak | Weekly pacing view | Low | Whether Q1 is on track |
| Any size, off-season | Pipeline build reporting | Low | Whether the season is being filled |
Frequently Asked Questions
Why is attribution harder for accounting firms than for ecommerce?
Three structural reasons. First, discovery and decision are separated: 57% of clients arrive by referral, but the referred prospect still researches the firm digitally, so the closing touch and the crediting touch are different events. Second, the season compresses everything - tax season drives 60%+ of annual acquisition, so a 12-month attribution average describes a period that barely exists. Third, the CRM is usually a practice-management tool: 91% of CRM records are incomplete and only 52% of users fill the lead-source field, so the source data firms plan on is largely blank.
What conversion rates should a tax or accounting firm expect by channel?
2026 industry data puts referral prospect-to-client conversion at 25.56%, SEO and organic at about 14.6%, traditional networking at 10-15%, direct website visits at 8-12% and paid advertising at 1.7%. Those are prospect-to-client rates, not click metrics, which is why paid looks catastrophic beside referral. Judged on its own economics - a $4.44 median Google Ads CPC and a $101 CPA against a client worth thousands a year - paid still clears, it just cannot be compared to a warm introduction on conversion rate alone.
What are realistic CAC and CPL numbers for an accounting firm?
Working ranges for 2026: CPL of $200-$2,000 depending on channel, with content and SEO trending to $200-$800 and paid search and events at $500-$2,000; CAC of $1,000-$8,000 driven by average client revenue and service complexity; lead-to-client conversion of 5-20%; and website visitor-to-lead conversion of 1.0-3.0%, or 3.0-5.0% for optimised niche sites. A common guardrail is keeping acquisition cost under 10% of first-year revenue, with LTV:CAC at 3:1 or better and payback under 12 months for advisory work.
How should a firm attribute a referral that came through Google first?
Ask two questions instead of one. Record the source the client names, and separately record every pre-contact touch you can see - branded search, LinkedIn profile visits, content downloads, review-site sessions. Firms that only capture the self-reported answer end up crediting 57% to referral and defunding the digital evidence layer that the referral had to pass. Multi-touch attribution adoption sits at 47% across B2B and marketing mix modelling at 26%, so the tooling to do this is now mainstream.
What is the minimum viable attribution setup for a small firm?
Five things: a mandatory lead-source field with a short closed list plus an open-text 'how did you hear about us'; call tracking, because a large share of enquiries arrive by phone and phone leads convert far better than forms; UTM discipline on every campaign and email; conversion tracking on the consultation booking rather than the contact-page view; and a monthly reconciliation of new engagement letters against recorded sources. That closes most of the gap without buying an attribution platform.
Sources
SmartFirm - referral conversion rate for accounting firms, 2026 data
Benchmarketing - accounting marketing benchmarks 2026
CPA Practice Advisor - how SMBs find and select accounting firms
NJCPA - from referrals to reputation, 2026 growth
Select Advisors Institute - marketing ROI benchmarks for accounting firms
Get X Media - accounting firm marketing benchmarks 2026
ZipDo - marketing in the accounting industry statistics
Hinge Marketing - 2026 High Growth Study
AICPA - 2025 National MAP Survey
CUFinder - CPA firm marketing benchmarks 2026