



Table of contents

Targeted-advertising budgets are reallocating, not simply expanding. Surveyed marketers reported planned growth in connected TV and retail media, while the Interactive Advertising Bureau cut its 2025 U.S. ad-growth forecast in its September update. For operators, that means a rising market tide does not prove a channel or targeting method will earn its next dollar.
Key Takeaways
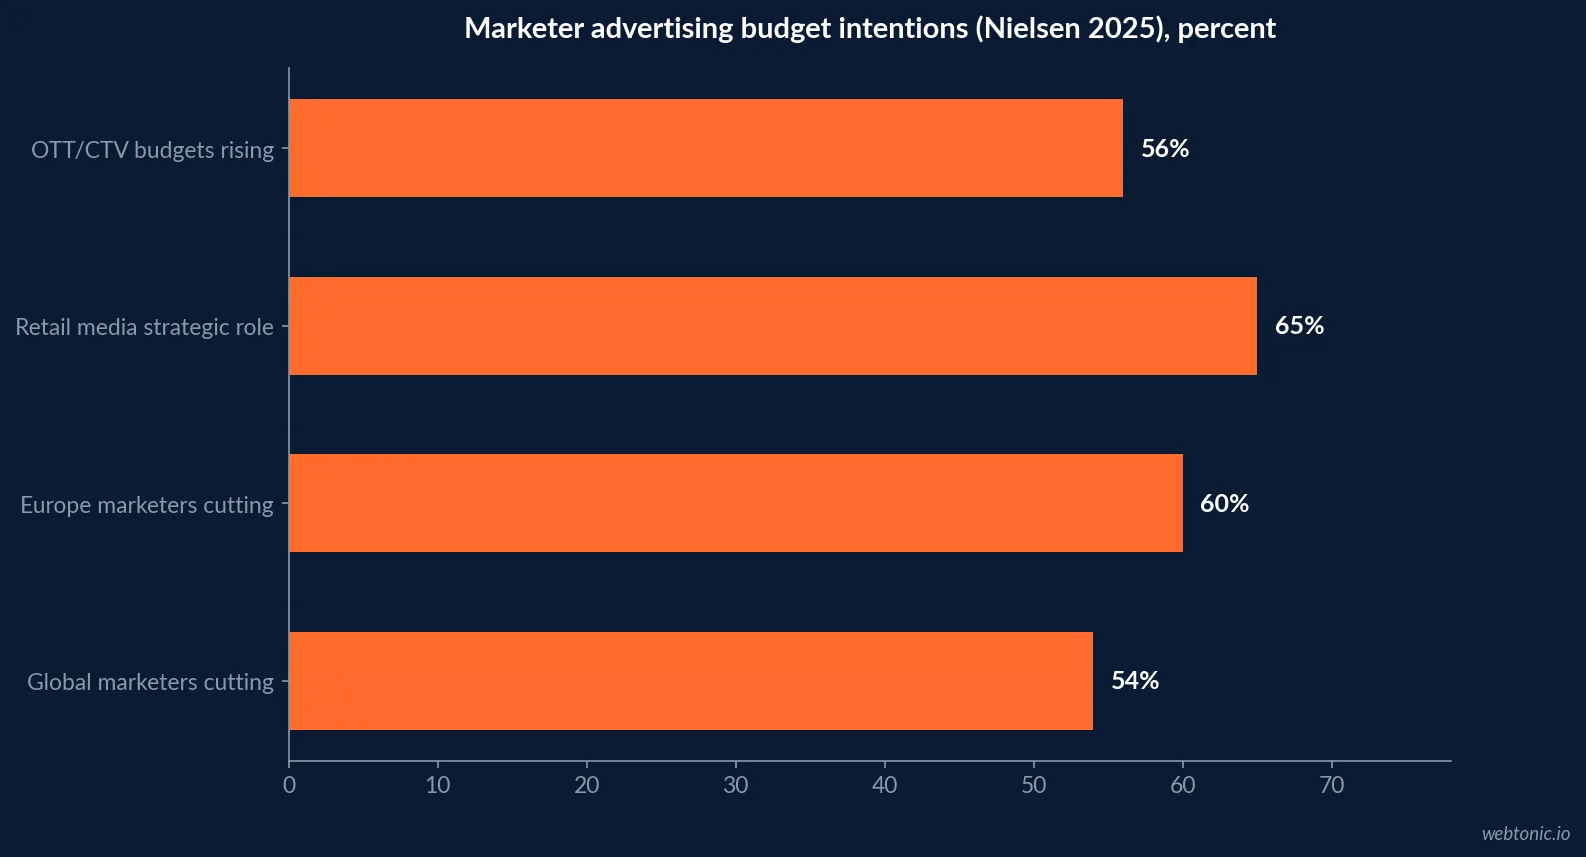
- 54% of global marketers expected to cut ad spending in 2025 in Nielsen’s survey, rising to 60% in Europe.
- 56% planned to increase OTT/CTV budgets, according to Nielsen’s 2025 Annual Marketing Report.
- 65% expected retail media networks to play a growing role in media strategies (Nielsen, 2025).
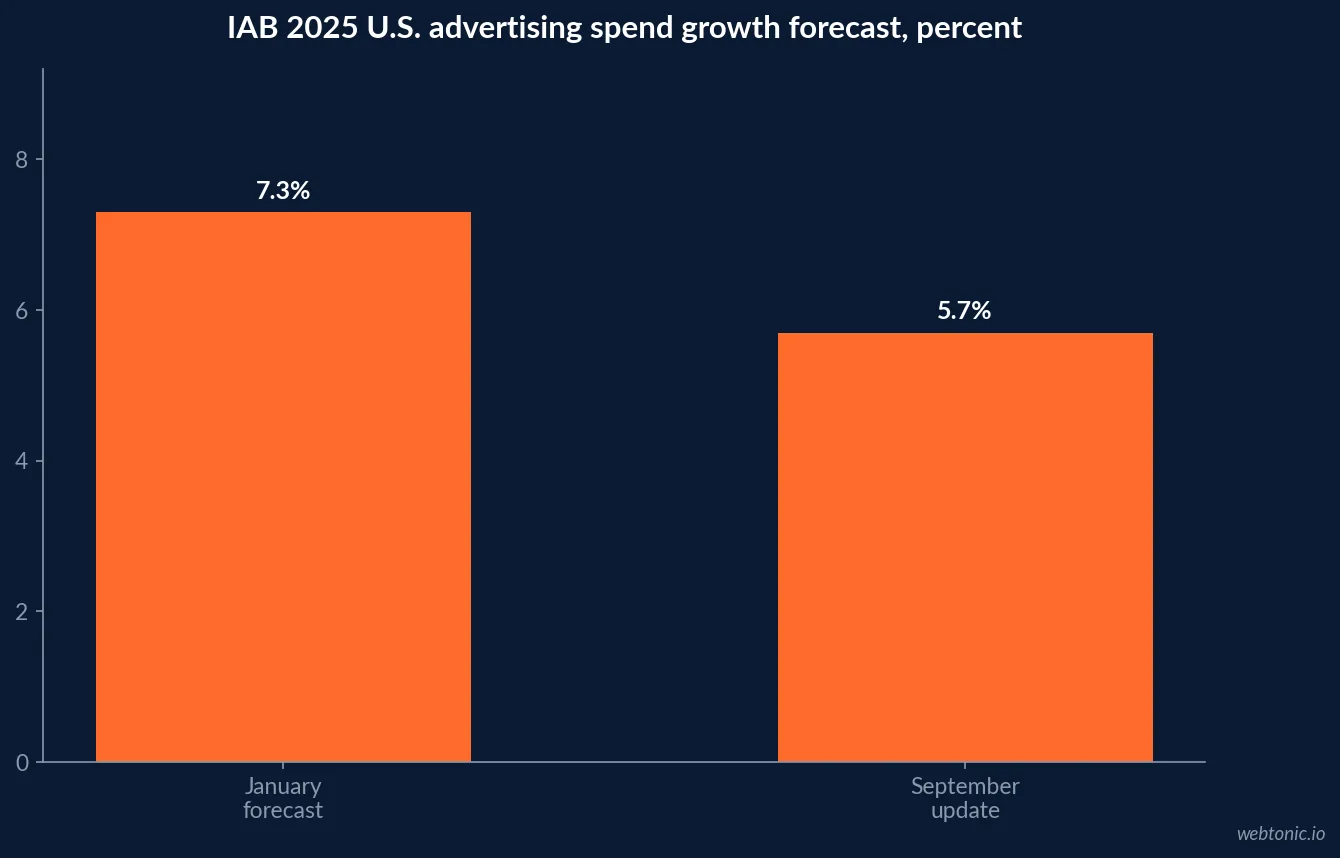
- IAB lowered its 2025 U.S. ad-spend growth outlook from 7.3% to 5.7% in September, a 1.6-point reduction.
- IAB’s September update described continued spend in social and CTV, while traditional media was projected to face steeper declines.
- 32% of Nielsen respondents measured media holistically across digital and traditional channels.
- 61% of budgets were based on company revenue, budget or prior spend in Deloitte Digital’s 2025 US leader survey.
- 16% of marketers planned to increase out-of-home budgets by more than 50% in Nielsen’s 2025 survey.
- IAB’s September 2025 study surveyed 204 U.S. buy-side decision-makers.
- Use market forecasts to frame planning; campaign-level experiments determine allocation.
Budget outlooks are snapshots, not promises
Advertising allocation reports are easy to misread because a projected market change, a marketer’s stated plan and an individual campaign’s return are separate units. Nielsen’s 2025 global survey, fielded among 1,400 marketers, described marketer plans; IAB’s September Outlook was a U.S. forecast based on responses from 204 buy-side decision-makers at brands and agencies. Neither is an account-level recommendation.
IAB’s September 2025 update revised its full-year U.S. ad-spend growth forecast to 5.7%, down from January’s 7.3% projection and a 1.6 percentage-point reduction. The revision reflects changed expectations under macroeconomic pressure. The update described continued spending on social and CTV, but pulled those forecasts back from earlier projections. The forecast vintage matters: report the date and context whenever you quote a market projection.
Use the aggregate numbers to identify where competition and experimentation may increase, not to declare that budgets are migrating uniformly into “targeted advertising.” The phrase covers many different media, data and buying mechanisms.
Spending plans diverge across channels
Nielsen’s 2025 Annual Marketing Report found 56% of marketers planned to increase OTT/CTV spending, three points higher year over year, while 65% said retail media networks would play a growing role in strategy. The same report found 54% of global respondents planned to cut ad spend in 2025, including 60% in Europe. Those numbers can coexist: overall budgets can tighten while some channels gain allocation.
The report also found 16% planned to increase out-of-home budgets by over 50%, showing that the reallocation story is not only digital. Among respondents, North American and Asia-Pacific marketers reported a near-even balance between brand awareness and revenue growth priorities; Europe tilted more strongly toward revenue growth. Geography changes the planning brief.
Before shifting spend, ask whether a new channel provides incremental reach, a distinct audience, stronger measurement or a better cost for qualified outcomes. A channel’s percentage of respondents planning increases is a popularity signal, not evidence of its marginal return.
| Signal | Study and field | Reported figure | What it measures |
|---|---|---|---|
| OTT/CTV planned increases | Nielsen Annual Marketing Report 2025 | 56% | Share planning higher spend |
| Retail media gaining role | Nielsen 2025 | 65% | Strategic importance, not exact spend |
| Global spend cuts | Nielsen 2025 | 54% | Marketers expecting ad reductions |
| European spend cuts | Nielsen 2025 | 60% | Regional plan response |
| US growth forecast | IAB September Outlook 2025 | 5.7% | Market forecast, not actual result |
| Holistic cross-media measurement | Nielsen 2025 | 32% | Self-reported measurement approach |
Market growth does not tell you where the next dollar belongs
IAB’s forecast is a top-down view of U.S. ad market growth. It cannot identify your audience’s marginal response to the next dollar. A growing category may become more competitive, prices can rise, and inventory may serve a different role in the funnel. Conversely, a flat category may still be efficient for a specific business.
Use a marginal-return question: what additional qualified volume does the next budget increment deliver, compared with keeping spend in its current home? Establish a holdout or credible comparison before scaling. For channels with weak identity-level reporting, geo experiments or matched-market designs may be more suitable than relying on the platform’s attributed conversions alone.
Keep market sizing and performance analysis in separate columns. Market forecasts help set a range of scenarios; your own campaign results determine constraints, saturation and the pace of a reallocation.
Audience data and privacy shape addressability
IAB’s January 2025 Outlook identified first-party data for precision and effectiveness as a buyer focus. Its September update said CTV and online video forecasts were pulled back, while social growth relative to prior projections was supported by medium-to-large spenders. Its State of Data report discusses first-party data, second-party partnerships and modeling as strategies used in response to signal loss and privacy regulation. These approaches can support targeting, but require data quality, rights, identity management and measurement work.
Build data costs into the channel model. The media line is only one part: consented collection, CRM hygiene, audience refresh, matching, suppression and analysis also consume resources. A segment’s size should be described with its source, recency, market and methodology; it is not necessarily a count of distinct people who can receive an ad.
FTC staff’s 2024 report on social media and video-streaming services raised concerns about large-scale collection and use of personal data, including targeted ad campaigns. Put provenance and permitted use into buying requirements. Avoid activating sensitive inferences just because a platform makes them available. Pew Research Center found 67% of US adults in 2023 understood little or nothing about what companies do with their personal data, which is a useful transparency signal for advertisers.
| Targeting input | What it can enable | Budget implication | Control to require |
|---|---|---|---|
| First-party customer data | Known relationship or behavior | Collection, integration and maintenance | Consent, purpose and retention |
| Partner data | Additional reach or context | Partnership and match costs | Provenance and lawful use |
| Modeled segments | Broader audience discovery | Model, validation and refresh | Methodology and calibration |
| Contextual signals | Relevant placement or content | Inventory and suitability controls | Placement transparency |
| Platform-defined segments | In-platform campaign reach | Media spend and platform measurement | Overlap, exclusions and outcome checks |
Targeting claims need measurement discipline
Nielsen reported only 32% of surveyed marketers measured media holistically across digital and traditional channels. It identified data limitations, weak tools, too many vendors and lack of transparency as obstacles to evaluating cross-media campaigns. Retail media and CTV can increase fragmentation, even as they promise new audience and outcome signals.
Set a common reporting layer for the campaign: spend, reach, frequency, audience definition, qualified response and business outcome. State which conversions are platform-reported, which are observed in a CRM or sales system, and what the attribution window includes. Where identity resolution is unavailable or inappropriate, use aggregate methods and acknowledge their limits.
Do not compare one channel’s click-through rate with another channel’s view-through or call conversion without aligning the underlying outcome and exposure rules. Reporting needs the same denominator and observation window before channel comparisons become useful.
Budget flexibility is limited by how firms set budgets
Deloitte Digital’s 2025 Marketing Investment Trends study surveyed 1,395 US marketing leaders at midsize and large B2B and B2C companies. The report says 61% of marketing budgets are based on enterprise-level revenues or budgets or prior spend. This means many teams do not have full control over the inputs; they need to make a stronger case for how allocation choices influence measurable output.
The study describes broadly distributed working-media investment across channels and funnel stages, with no significant correlation between channel mix and revenue growth in its analysis. The IAB study also separates actual first-half growth from forecasted full-year spending; preserve that distinction in dashboards. That is not proof that channel mix never matters. It is a warning against assuming that a fashionable allocation pattern is a growth lever on its own.
For operators, present a budget request as a test with a clear owner, constraint, forecast range and exit rule. If the total budget is fixed, state what will be reduced and what result must be observed before the next reallocation.
| Budget governance question | Why ask it | Evidence to show |
|---|---|---|
| Who controls the budget input? | 61% tied to enterprise revenue, budget or prior spend (Deloitte, 2025) | Decision rights and approval timing |
| Is the plan a market forecast or account target? | Different levels answer different questions | Publisher, date and unit of analysis |
| What is being displaced? | Cuts may finance channel increases | Baseline and opportunity cost |
| Which outcome will govern? | Channel metrics are not interchangeable | Qualified action and measurement window |
| What triggers scale or stop? | Prevents popularity-led spending | Experiment design and threshold |
Compare forecasts without mixing their units
When market studies disagree, first reconcile geography, field dates, survey population, forecast horizon, included channels and whether the number is a plan, spend estimate or observed outcome. IAB’s January and September 2025 releases are not contradictory; the second is an update to the first under changed expectations. Nielsen’s global survey is a different instrument and cannot be substituted for a U.S. market forecast.
For a planning deck, place the source and release month beside the value. Keep consumer spending, advertiser budgets, agency billings and media spend separate. If the forecast has been revised, show both versions and the reason, rather than choosing only the one that fits the desired storyline.
Scenario-plan a base case and a downside case. Use the audience and channel mix to explain how each is likely to affect your own reach and pipeline, then revisit as actual spend data comes in.
Practical reallocation workflow
Start with a stable baseline: spend, reach, frequency, outcomes, attribution and audience overlap. Identify the campaign or audience where the next investment could improve marginal efficiency. Shift a measured amount, preserve a comparison group and hold other variables steady as far as possible.
After the test, compare incremental qualified outcomes and contribution—not just attributed conversions. Check whether the new inventory reached people who were not already exposed elsewhere. If the result is positive, scale in increments and monitor whether marginal returns decline. If inconclusive, decide whether to extend the test or reallocate based on the value of further evidence.
Web Tonic’s growth marketing practice can support channel planning, and data intelligence can help align measurement. See our practical guide to building a Google Ads strategy for an example of connecting paid budgets to performance goals.
| Reallocation step | Track | Decision |
|---|---|---|
| Baseline | Spend, audience, reach, frequency | Is the current allocation understood? |
| Test design | Treatment, holdout, duration, threshold | Can incremental impact be observed? |
| Audience quality | Qualified response and downstream conversion | Is the shift reaching the right people? |
| Channel incrementality | Deduplication and cross-channel overlap | Is reach genuinely new? |
| Scale | Marginal outcome and saturation | Does next increment still meet the goal? |
| Governance | Owner, budget cap and review date | Is the change reversible and accountable? |
What a targeted-advertising dashboard should say
Report market context separately from campaign performance. A compact dashboard can show the source and date of forecast assumptions, then display your own budget, audience, reach, frequency, qualified outcomes, incremental results and marginal cost. Add a note for platform-reported figures and a definition for each audience bucket.
Distinguish prospecting from retargeting, and new customers from existing customers. Where channels cannot deduplicate, disclose that limitation. Avoid a “targeted share” that aggregates unlike systems and implies more precision than the data support.
The decision-useful question is not “Is the market spending more?” It is “What changed in our reachable audience and incremental outcome when we moved this budget?”
Summary: treat reallocation as a hypothesis
Market evidence shows competing pressures: Nielsen’s respondents reported planned ad-spend cuts alongside increased interest in OTT/CTV and retail media. IAB lowered its 2025 U.S. forecast as uncertainty changed. Deloitte found budgets often follow corporate-level inputs rather than marketer-controlled performance alone.
Put those signals to work as scenario assumptions, not automatic allocations. Select a reachable audience, disclose its source and rights, define an outcome and measure incremental impact. Shift budget only when the evidence supports the move—and revisit it as the market and campaign mature.
| 2025 benchmark | Value | Source | Use |
|---|---|---|---|
| Expected global advertising budget cuts | 54% | Nielsen | Scenario risk |
| OTT/CTV planned increases | 56% | Nielsen | Channel planning context |
| Retail media strategic role | 65% | Nielsen | Track new inventory, not guaranteed ROI |
| US ad spending growth forecast, September update | 5.7% | IAB | Market forecast vintage |
| Cross-media holistic measurement | 32% | Nielsen | Measurement gap to address |
| Marketing budgets tied to enterprise inputs | 61% | Deloitte Digital | Budget governance context |
Frequently Asked Questions
Frequently Asked Questions
Are advertising budgets shifting toward targeted channels?
The direction varies by channel, market and survey. Nielsen’s 2025 Annual Marketing Report found 56% of surveyed marketers planned to increase OTT/CTV spend and 65% saw retail media taking a growing role. The IAB’s September 2025 Outlook revised its U.S. ad spend growth forecast from 7.3% in January to 5.7%, a 1.6 percentage-point reduction. These are different measures: channel plans versus a market forecast, not a universal targeting budget share.
How much of an ad budget should go to targeted advertising?
There is no universal percentage supported by the studies cited here. The right allocation depends on the reachable audience, unit economics, privacy-safe data, marginal returns and whether a channel brings incremental reach. Use a test allocation, define a control and scale only when the additional spend improves the chosen business outcome.
What is changing in U.S. ad spend?
IAB’s September 2025 Outlook projected U.S. advertising spend growth of 5.7% for 2025 after reducing the January outlook by 1.6 percentage points. It reported continued investment in social and CTV, alongside buyer interest in performance, first-party data and cross-channel measurement. Nielsen separately reported planned increases in OTT/CTV and retail media. Forecasts are not final receipts or client-level ROI.
Why do ad-budget forecasts differ?
Forecasts differ because of release date, scope, market definition, channel inclusion and economic assumptions. IAB revised its own 2025 U.S. forecast between January and September as macroeconomic and tariff expectations changed. When comparing studies, label the publisher, field dates, population, geography, metric and forecast vintage rather than selecting whichever headline suits a narrative.
How should targeted campaigns be measured?
Report spend, deduplicated reach where available, frequency, qualified outcomes and incremental lift. Nielsen found only 32% of marketers measured media holistically across digital and traditional channels in 2025. Pair platform reporting with a consistent outcome framework, and use holdouts, geo experiments or other suitable controls to separate incremental response from conversions that would have happened anyway.
Sources
Nielsen — 2025 Annual Marketing Report
American Marketing Association — Reinventing Segmentation, 2025
IAB — 2025 Outlook Study, January
IAB — 2025 Outlook Study, September update
IAB — State of Data 2025
Deloitte Digital — 2025 Marketing Investment Trends
Federal Trade Commission — 2024 staff report on social media and streaming services
HubSpot — State of Marketing 2025
Attentive — State of Personalized Marketing 2025
Pew Research Center — How Americans View Data Privacy
IAB — January 2025 forecast release


