Table of contents

Surrogacy may be the hardest attribution problem in healthcare marketing. Two funnels, 18 to 24 months between the first click and recognised revenue, a phone-first inquiry pattern and privacy limits on tracking. The data below is about what you can actually measure - and what to use instead where you cannot.
Key Takeaways
- Intended-parent acquisition costs $800 to $3,000 against journey revenue of $120,000 to $200,000-plus.
- Cost per qualified surrogate runs $1,500 to $8,000; per matched surrogate $3,000 to $15,000.
- Only 2% to 3% of surrogate inquiries pass full screening - a 30 to 50x pipeline ratio is required.
- Intended-parent decision cycles run 3 to 12 months; surrogate cycles 2 to 6 months; full commitment 18 to 24 months.
- Multi-touch attribution adoption reached 47% in 2026, up from 31% in 2023.
- Media mix modelling adoption reached 26%, up from 9% in 2023.
- The dark-funnel gap averages 38% of B2B pipeline.
- Only 21% of marketers are confident in their attribution.
- Multi-touch attribution is credited with 15% to 30% ROI improvement.
- Last-click misallocates 40% to 60% of credit in long-cycle categories.
- An average complex purchase involves 14 meaningful touchpoints over an 8.3-month cycle.
- 91% of CRM records are incomplete, which caps attribution accuracy regardless of model.
- Clean lead-source and opportunity-source fields should reach at least 85% accuracy to be usable.
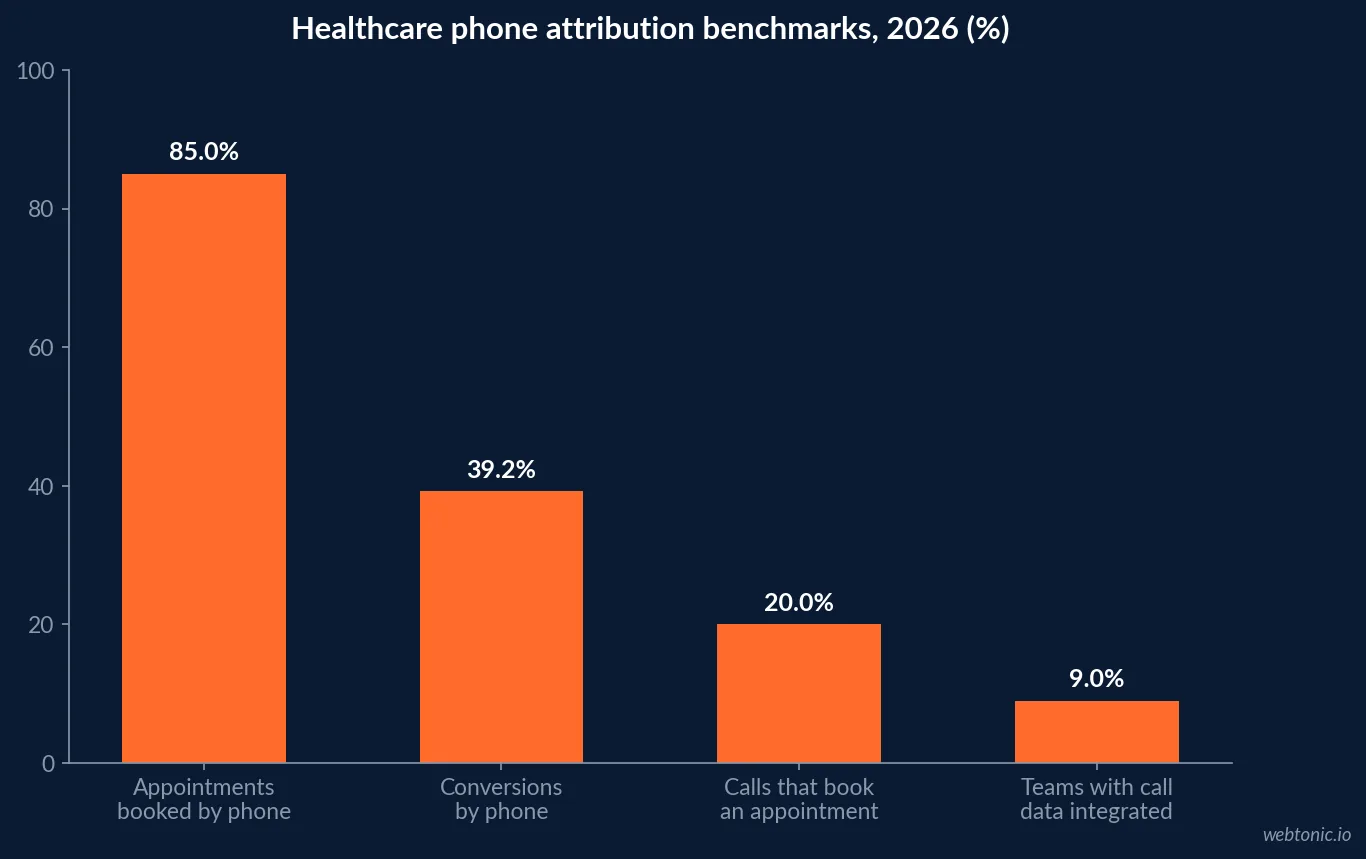
- Only 9% of healthcare measurement teams have integrated call-centre data into measurement.
- 80% to 90% of healthcare appointments are still booked by phone.
- About 39.2% of healthcare conversions happen by phone, and callers convert 30% faster.
- 15% to 25% of healthcare calls lead to a booked appointment.
- Healthcare advertisers currently tie 10% to 25% of spend to patient outcomes against a 26% to 50% target.
- True patient acquisition cost is often 3 to 4 times the reported figure.
- Fertility paid search averages $9.84 CPC, 5.28% CTR, 6.8% CVR and $112 CPA.
- Agency-side fertility cost per lead runs $120 to $300, and $200 to $450 in tier-one metros.
- Meta typically takes 35% to 55% of surrogate recruitment budget and Google 25% to 35%.
- The global surrogacy market reached $28.91 billion in 2026 at a 22.19% CAGR.
Two funnels, two measurement systems
The single most common reporting failure in this category is a blended cost per lead. Intended parents and prospective surrogates have different costs, different cycle lengths and different qualification rates, and averaging them produces a number that describes neither. Recruitment benchmarks and intended-parent benchmarks should be tracked as two separate P&Ls.
| Measurement dimension | Intended parent funnel | Surrogate funnel | Why blending breaks |
|---|---|---|---|
| Cost per acquisition | $800-$3,000 per signed client | $3,000-$15,000 per match | A 5x cost difference vanishes in the average |
| Value per conversion | $120,000-$200,000+ journey | Enables one journey | Revenue attaches to one side only |
| Qualification rate | Most inquiries are viable | 2%-3% pass full screening | Lead counts are not comparable units |
| Cycle from first touch | 3-12 months | 2-6 months | Different attribution windows required |
| Dominant channel | Search and referral | Meta 35%-55% of budget | Channel ROI reverses by audience |
| Terminal event | Signed agreement | Cleared and matched | Two conversion definitions |
The lag problem, and the metrics that survive it
A click today becomes revenue in a year and a half. Ad platforms do not have an attribution window that long, and no CFO will wait. The answer is a documented chain of leading indicators with known step conversion rates, reported weekly, trued up quarterly against signed agreements.
| Stage | Funnel | Typical measurement lag | Use as |
|---|---|---|---|
| Qualified inquiry | Both | Same week | Weekly operating metric |
| Pre-screen pass | Surrogate | 1-2 weeks | Earliest true quality signal |
| Consultation held | Intended parent | 1-4 weeks | Weekly operating metric |
| Full medical and psychological clearance | Surrogate | 4-10 weeks | Monthly metric |
| Signed agreement | Intended parent | 3-12 months | Quarterly true-up |
| Match confirmed | Both | 2-6 months | Quarterly true-up |
| Cycle start and outcome | Both | 12-24 months | Annual cohort analysis only |

Attribution method adoption in 2026
The industry has moved, but not far enough to be complacent. 2026 attribution research puts multi-touch adoption at 47% against 31% in 2023, and media mix modelling at 26% against 9%. Meanwhile only 21% of marketers report confidence in their attribution at all, per B2B attribution survey data.
| Capability or finding | 2026 figure | Prior year | Relevance to surrogacy |
|---|---|---|---|
| Multi-touch attribution adoption | 47% | 31% (2023) | The right default for a 14-touch journey |
| Media mix modelling adoption | 26% | 9% (2023) | Needs volume most providers lack |
| Practitioners confident in attribution | 21% | - | Low confidence is the norm, not a failure |
| Dark-funnel share of pipeline | About 38% | - | Support groups and word of mouth |
| ROI lift credited to multi-touch | 15%-30% | - | Reallocation, not new budget |
| Touchpoints in a complex purchase | 14 over 8.3 months | - | Surrogacy runs longer still |
| Incomplete CRM records | 91% | - | The real ceiling on accuracy |
| Target lead-source field accuracy | 85%+ | - | Achievable with process, not tooling |
One correction to the "low confidence" number: it is not a reason to buy more software. Attribution implementation research is blunt that incomplete CRM data - missing contact associations, unenforced deal stages, empty source fields - caps accuracy no matter which method sits on top. Fixing the intake form is cheaper and works faster than replacing the stack.
The phone gap is most of the missing data
Surrogacy inquiries become real on a call. So do the vast majority of healthcare bookings: healthcare industry research reports roughly 80% of appointments booked by phone, while Freshpaint's 2026 State of Healthcare Marketing report found only 9% of healthcare measurement teams have integrated call-centre data into measurement.
| Phone finding | Benchmark | Consequence if untracked |
|---|---|---|
| Healthcare appointments booked by phone | 80%-90% | Most conversions never reach the ad platform |
| Share of conversions occurring by phone | About 39.2% | Channel ROI is understated everywhere |
| Calls leading to a booked appointment | 15%-25% | Call quality, not call volume, is the KPI |
| Speed advantage of callers | Convert about 30% faster | Response time is a marketing metric |
| Healthcare teams with call-centre data integrated | 9% | Nine in ten optimise on partial data |
| Reported versus true patient acquisition cost | True is often 3-4x reported | Budgets set on fiction |
| Spend tied to patient outcomes today | 10%-25% | Target is 26%-50% |
The fix is unglamorous and effective: dynamic number insertion on every landing page, a required source field in the intake script, and call outcomes written back to the CRM the same day. Healthcare acquisition analysis puts the stakes plainly - true acquisition cost frequently lands at 3 to 4 times the reported number once phone and offline stages are included.
What a workable surrogacy measurement stack looks like
Sized for a real agency rather than an enterprise. Nothing here requires a data team.
| Layer | Minimum viable tool | What it must capture | Common failure |
|---|---|---|---|
| Web analytics | GA4 with consent handling | Session source, page path, form starts | No separation of the two funnels |
| Call tracking | Dynamic number insertion | Source, duration, outcome | Numbers on some pages only |
| Self-reported source | One required inquiry-form field | How the person actually heard of you | Optional field, so it stays empty |
| CRM | Any, with enforced stages | Lead source, stage dates, terminal outcome | 91% of records incomplete |
| Screening data | Screening tracker joined to CRM | Pre-screen and clearance pass rates | Lives in a spreadsheet nobody joins |
| Reporting layer | One dashboard per funnel | Stage conversion and cost per stage | One blended dashboard for both |
| Quarterly true-up | Cohort spreadsheet | Signed agreements traced to first touch | Never scheduled, so never done |
Build the reporting layer once and it pays for itself every month; that is exactly the remit of our data intelligence practice. If you also need the campaign side of the story, our surrogacy Google Ads statistics cover the paid benchmarks these numbers are measured against.
Self-reported attribution beats modelling at low volume
Most providers sign somewhere between a handful and a few hundred journeys a year. That is far below the volume any algorithmic method needs. At that scale a single required question - "how did you first hear about us?" - reconciled quarterly against tracked source is more accurate than a statistical method, and it captures the 38% dark funnel that tracking cannot see at all.
| Approach | Volume needed | Captures dark funnel | Best use |
|---|---|---|---|
| Last click | Any | No | Sanity reference only |
| Position-based multi-touch | Moderate | Partly | Default operating standard |
| Time decay | Moderate | Partly | Long cycles with steady spend |
| Data-driven or algorithmic | High | No | Multi-location groups only |
| Media mix modelling | Very high, 2-3 years of data | Yes, indirectly | Large networks |
| Self-reported at inquiry | Any | Yes | The highest-value single field you own |
| Geo holdout testing | Moderate spend | Yes | Validating a channel worth keeping |
Reporting cadence that matches the business
Weekly reporting on a metric that moves annually invites bad decisions. Match the cadence to the actual signal frequency.
| Cadence | Audience | Metrics | Decision it supports |
|---|---|---|---|
| Weekly | Marketing and intake | Inquiries by funnel, call volume, response time, pre-screen pass | Creative and budget nudges |
| Monthly | Leadership | Cost per qualified lead by funnel, consultation rate, clearance rate | Channel reallocation |
| Quarterly | Ownership | Cost per signed journey, cost per match, self-reported versus tracked source | Annual budget and channel mix |
| Annually | Ownership | Cohort revenue traced to first touch, LTV per channel | Strategic bets and hiring |
Two figures are worth pinning to the wall while you build this: fertility paid search averages $9.84 CPC, 5.28% CTR, 6.8% conversion and $112 CPA per fertility clinic benchmarks, and the global surrogacy market reached $28.91 billion in 2026 at a 22.19% CAGR per 2026 surrogacy statistics. Growth that fast punishes agencies that cannot tell which half of their spend is working. The trust layer that converts those clicks is quantified in our surrogacy branding statistics.
Frequently Asked Questions
Why is attribution harder for surrogacy agencies than for other healthcare advertisers?
Four reasons stack on top of each other. First, there are two funnels - intended parents at $800 to $3,000 acquisition cost against $120,000 to $200,000-plus of journey revenue, and surrogates at $1,500 to $8,000 per qualified candidate - and a single blended cost per lead hides both. Second, the lag: intended parents decide over 3 to 12 months and the full commitment runs 18 to 24 months, so a click attributed today produces revenue well outside any ad platform's attribution window. Third, inquiries arrive by phone, and only 9% of healthcare marketing teams have integrated call-centre data. Fourth, privacy constraints limit what can be sent back to ad platforms at all.
What attribution approach should a surrogacy agency use?
Position-based or time-decay multi-touch as the operating standard, with last-click retained only as a sanity reference. Multi-touch adoption reached 47% of marketers in 2026, up from 31% in 2023, and marketing mix modelling reached 26% from 9%. Last-click misallocates 40% to 60% of credit in long-cycle categories, which systematically defunds the content and organic work that actually starts surrogacy journeys. Where volume is too low for statistical modelling - most single-location agencies - use a documented lead-source field plus self-reported attribution on the inquiry form rather than pretending to have a model.
How much of surrogacy inquiry volume comes by phone, and why does it matter?
Healthcare is a phone-first category: roughly 80% to 90% of healthcare appointments are still booked over the phone, and about 39.2% of tracked conversions happen by phone, with callers converting materially faster than web leads. Yet Freshpaint's 2026 State of Healthcare Marketing report found only 9% of healthcare measurement teams have integrated call-centre data into measurement. For an agency where the first real conversation is always a call, that gap is not a reporting inconvenience - it is most of the attribution.
How do you measure channel performance when revenue arrives 18 months later?
Use leading indicators with known conversion rates to the terminal event, and hold the terminal number as a quarterly true-up rather than a weekly KPI. The workable chain for intended parents is qualified inquiry to consultation to signed agreement to cycle start; for surrogates it is inquiry to pre-screen pass to full medical and psychological clearance to match. Because only 2% to 3% of surrogate inquiries pass full screening, the pre-screen pass rate is the single most useful early metric in the whole business.
What is the dark funnel problem in surrogacy marketing?
The dark funnel is demand created where no click is recorded: private support groups, Reddit and Facebook communities, former-surrogate word of mouth, podcasts and direct recommendations. B2B pipeline research puts the dark-funnel gap at about 38% of pipeline, and surrogacy is likely worse because the decision is intensely private. Only 21% of practitioners report confidence in their attribution at all. The practical response is a mandatory self-reported source question at inquiry, reconciled against tracked source quarterly.
Sources
Digital Applied - Marketing Attribution Statistics 2026
Visionary Marketing - B2B Attribution Data 2026
ORM - Marketing Attribution Implementation Guide
Freshpaint - Healthcare Attribution Blind Spots
Invoca - State of Healthcare Marketing 2026
Praxxii - Healthcare Patient Acquisition 2026
Tandem - Surrogate Recruitment Marketing
Tandem - Intended Parent Marketing Benchmarks
Benchmarketing - Fertility Clinic Benchmarks
ACRC Global - Surrogacy Statistics 2026
Meddilink - Blind Spots Causing IVF Patient Drop-Off