



Table of contents
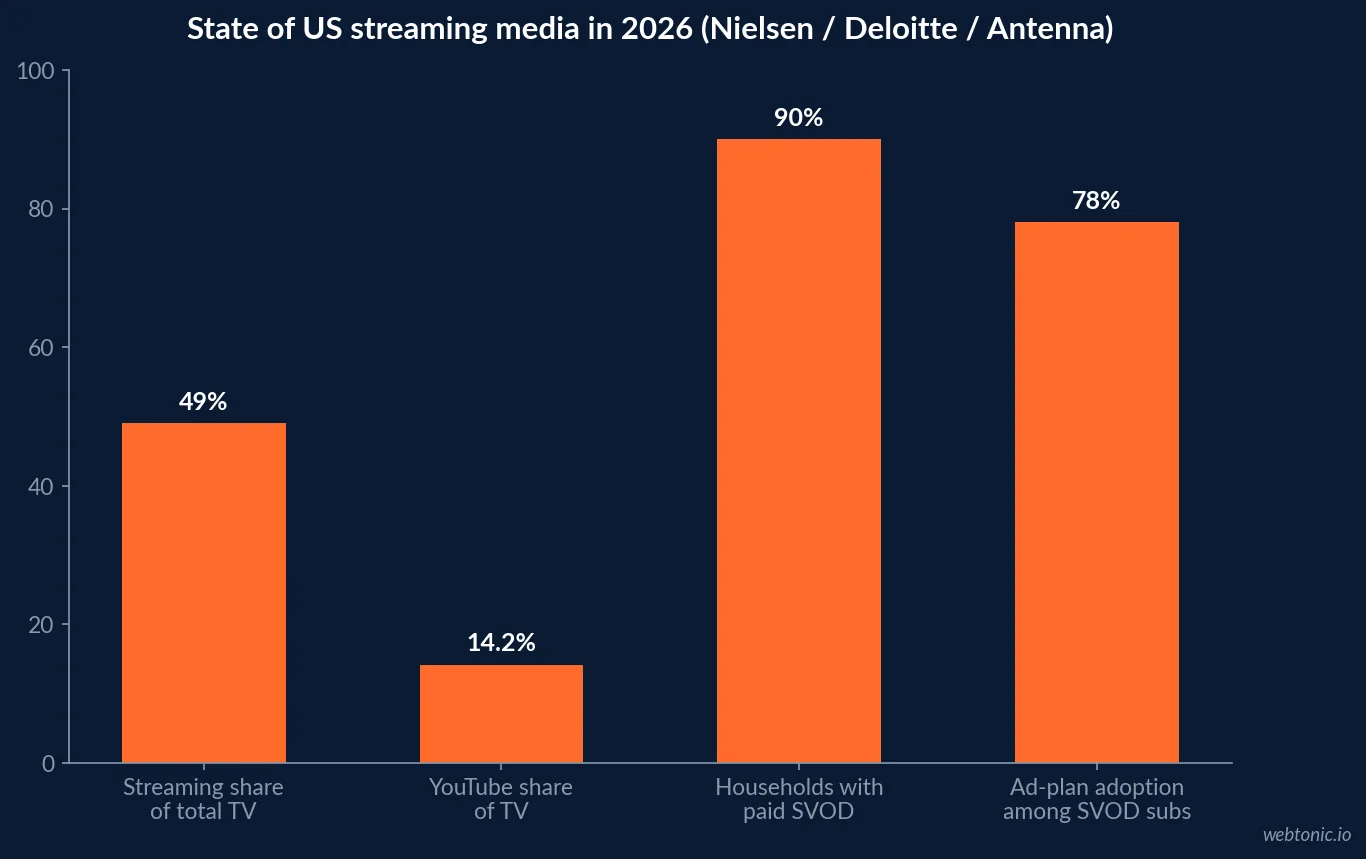
Streaming took a record 49.0% of total US TV usage in July 2026, per Nielsen's monthly Gauge report. That headline share masks a market that is simultaneously maturing - churn is stabilizing, ad tiers are now the default - and still shifting real ad dollars toward connected TV faster than traditional television can hold onto them. This page reads the numbers a media planner actually needs.
Key Takeaways
- Streaming reached 49.0% of total US TV usage in July 2026.
- YouTube alone hit a record 14.2% share of TV.
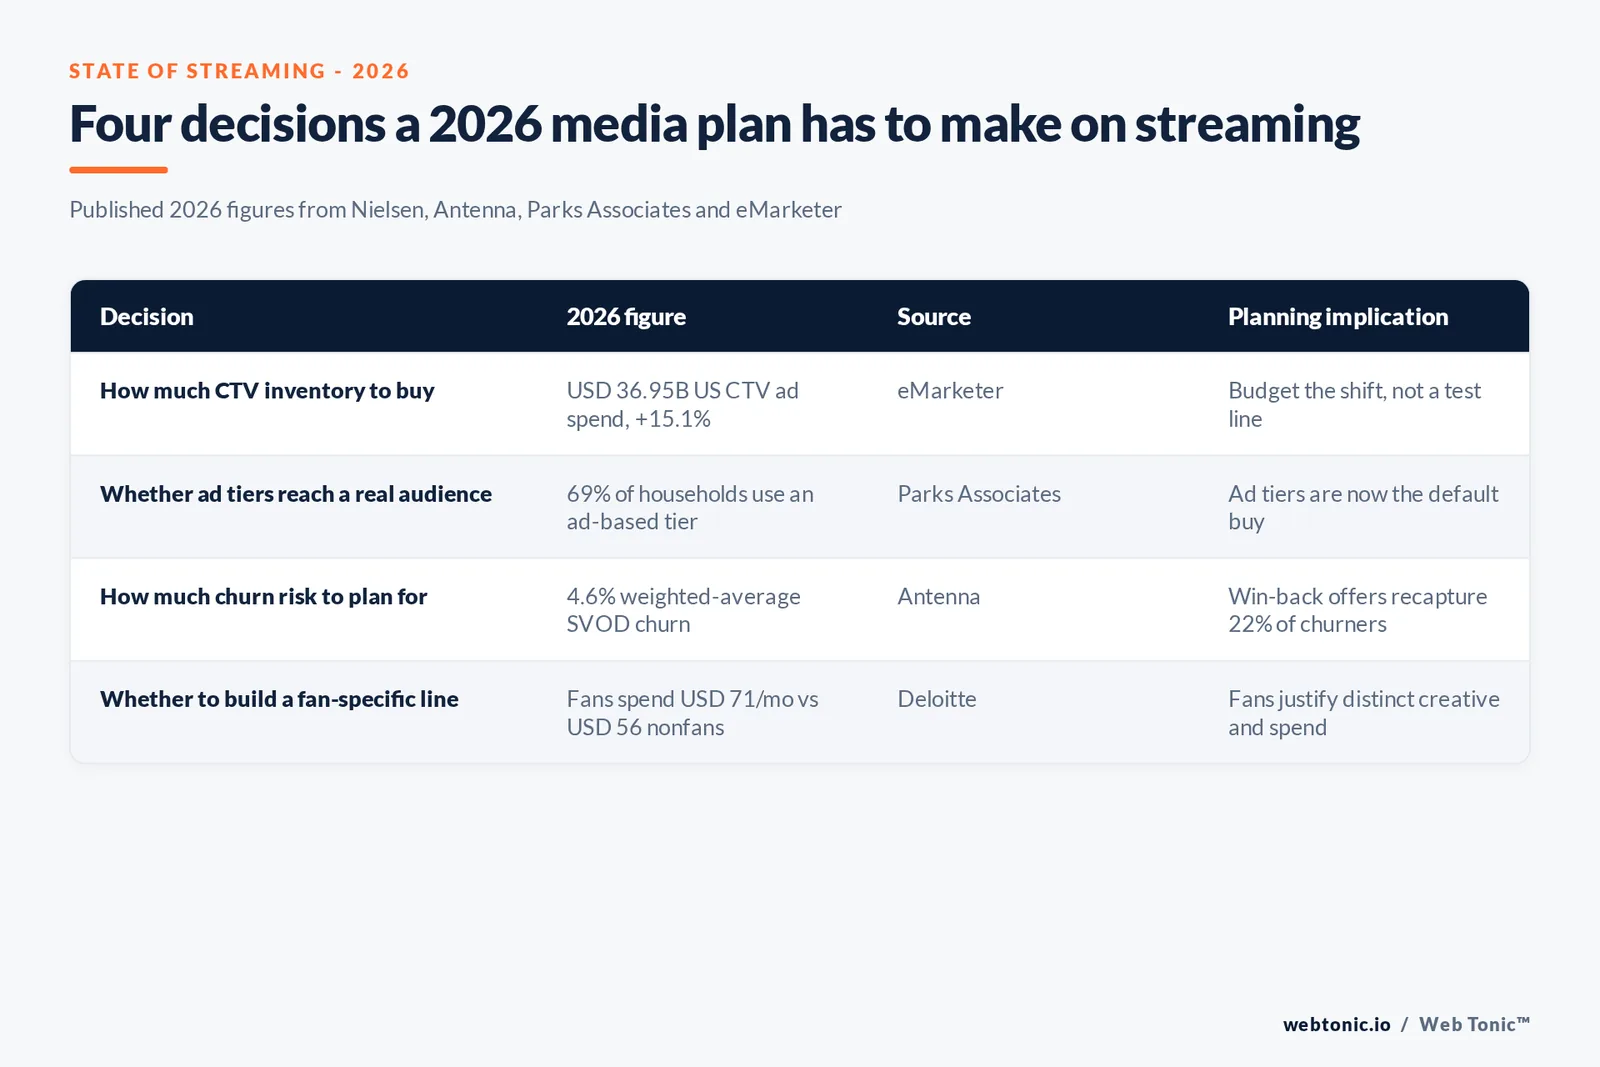
- Premium SVOD churn stabilized at a 4.6% weighted average.
- Subscriber growth slowed to +7% in 2025, down from 12% in 2024.
- 41% of consumers cancelled an SVOD service in the last six months.
- 22% of churners returned to the same service.
- More than 110 million ad-supported streaming plans now exist in the US.
- 78% of Premium SVOD subscribers have tried an ad plan.
- 69% of US internet households use at least one ad-based tier.
- 90% of US households carry a paid SVOD subscription.
- The average household pays for 4 SVOD services.
- Fans spend 51 more minutes a day with media than nonfans.
- Fans spend USD 71 a month on SVOD versus USD 56 for nonfans.
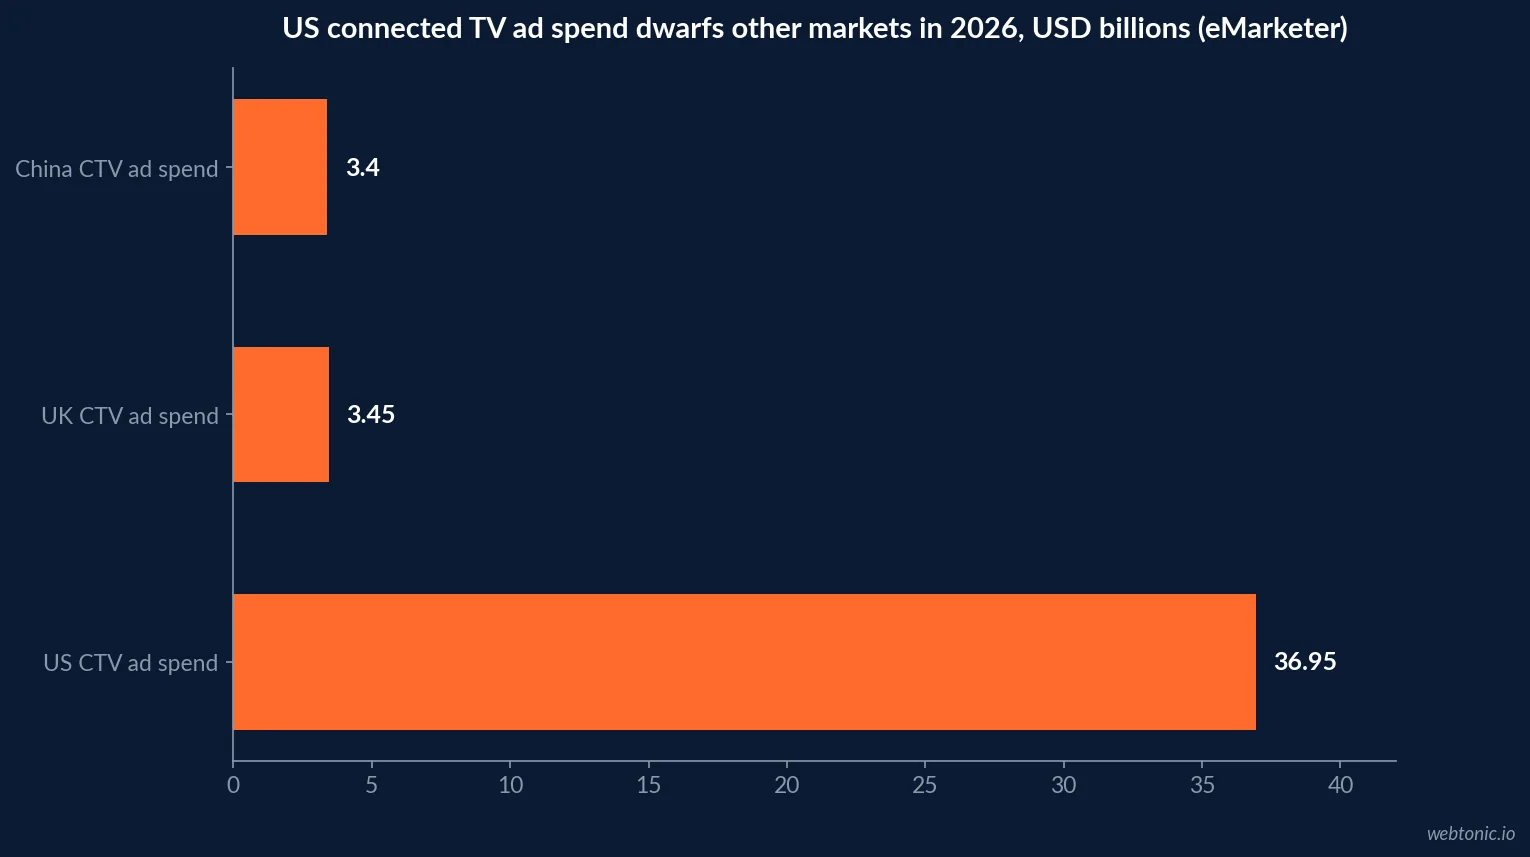
- US CTV ad spend reaches USD 36.95 billion in 2026.
- That is over 10 times the UK and China's CTV markets combined.
- CTV ad spending grows 15.1% this year.
- Traditional TV still draws over USD 50 billion in ad spend.
- Extra streaming member slots add USD 7.99-9.99 a month.
Streaming's record share of the television day
Nielsen's July 2026 Gauge report found streaming climbing to 49.0% of total US TV usage, up 0.5 points month over month and up 3.4% in raw usage, driven by the FIFA World Cup 2026 and a strong original slate. YouTube alone captured a record 14.2% share of TV, extending its lead in Nielsen's Media Distributor Gauge to five full share points. Peacock posted back-to-back monthly viewership gains of roughly 15%, and its most-streamed title generated 4.9 billion viewing minutes in the month alone.
| Nielsen Gauge, July 2026 | Share of TV / change |
|---|---|
| Streaming, total category | 49.0% (+0.5 pt MoM) |
| YouTube | 14.2% (record) |
| NBCU-Versant distributor group | 9.2% (+0.1 pt) |
| FOX (broadcast) | 7.8% (+0.4 pt) |
| Disney streaming properties | 4.7% (+0.1 pt) |
| Peacock | 2.6% (+0.3 pt, viewership +15% MoM) |
Subscriber growth is slowing while churn stabilizes
Antenna's Q1 2026 State of Subscriptions report found overall Premium SVOD subscriber growth falling into single digits for the first time - +7% in 2025, down from 12% in 2024 - while the category's weighted-average churn rate stabilized at 4.6%, with 7 of 11 recent months showing flat or lower churn compared to the prior year. Deloitte's 2026 Digital Media Trends survey separately found 41% of consumers cancelled an SVOD service in the past six months, though 22% of those churners returned to the same service - evidence that win-back offers now recapture a meaningful share of lapsed subscribers rather than losing them permanently.
| Churn and growth metric | 2025-2026 figure | Source |
|---|---|---|
| Premium SVOD subscriber growth, 2025 | +7% (down from +12% in 2024) | Antenna |
| Weighted-average Premium SVOD churn | 4.6% | Antenna |
| Consumers who churned an SVOD in 6 months | 41% | Deloitte |
| Churners who returned to the same service | 22% | Deloitte |
| US households with a paid SVOD subscription | 90% (avg. 4 services) | Deloitte |
Ad-supported tiers have become the default, not the discount
Antenna's Q2 2026 State of Subscriptions report estimates more than 110 million ad-supported streaming plans in the US, excluding Prime Video, with 78% of Premium SVOD subscribers having tried an ad plan at some point in the past four years. Parks Associates' 2026 report, drawing on 8,000 US broadband households, found 69% of households now use at least one ad-based tier, with Peacock and Hulu both above 70% ad-plan adoption since they launched with ads on by default. Ad-supported subscribers show near-identical retention to ad-free subscribers, so the early concern that ad plans would attract lower-quality customers has not held up.
| Ad-tier metric, 2026 | Figure | Source |
|---|---|---|
| US ad-supported streaming plans (ex. Prime Video) | >110 million | Antenna |
| Premium SVOD subscribers who have tried an ad plan | 78% | Antenna |
| Households using at least one ad-based tier | 69% | Parks Associates |
| Peacock / Hulu ad-plan adoption | >70% | Parks Associates |
| US video subscription economy, total | USD 147 billion | Parks Associates |
What a household actually pays once someone else logs in
2026 pricing comparisons across major services show the ad-plan discount is real but modest once a household shares access. Pocket-lint's 2026 password-sharing tracker lists Netflix's Standard plan at USD 19.99 a month and Premium at USD 26.99, with an extra member slot costing USD 7.99 with ads against USD 9.99 without - a gap of only USD 2. Disney+ has held its extra-member pricing at USD 6.99 ad-supported and USD 9.99 ad-free since 2024, even as its base plans climbed to USD 11.99 and USD 18.99 in October 2025.
| Service | Extra member, ad-supported | Extra member, ad-free |
|---|---|---|
| Netflix | USD 7.99 | USD 9.99 |
| Disney+ | USD 6.99 | USD 9.99 |
| Hulu | USD 6.99 | USD 9.99 |
| HBO Max | USD 7.99 | Same tier, no ad-free split |
Where the ad money is actually following the audience
eMarketer's global CTV forecast puts US connected TV ad spend at USD 36.95 billion in 2026, more than ten times the UK and China's CTV markets combined at USD 3.45 billion and USD 3.40 billion respectively, with CTV ad spending growing 15.1% this year. eMarketer's broader 2026 US ad spending forecast still has traditional TV drawing over USD 50 billion this year, but flags another collapse looming in 2027 as CTV ad revenue closes the gap. That is the budget signal for anyone still weighting linear television over streaming inventory: the gap is closing on a fixed timeline, not a gradual one.
Deloitte's fan-segment data adds a targeting layer worth planning around: fans spend 51 more minutes a day (16% more) with media than nonfans, subscribe to SVOD at 92% versus 77%, and pay USD 71 a month for an average of four services against USD 56 for three among nonfans - a premium audience CTV budgets should be built to reach specifically, not just at scale.
Live events still anchor the biggest single moments
The same Nielsen Gauge report credits the FIFA World Cup 2026 with pushing total TV usage up 2.2% in a month that typically declines seasonally. Telemundo's World Cup simulcasts on Peacock drove the streamer's two most-viewed days of the interval, and FOX - which owned 25 of the top 26 July telecasts, including the World Cup Final - added 0.4 share points to close the month at 7.8% of TV even as a broadcast network. Streaming's rising share has not eliminated the audience spike a single global sporting event can still generate; it has simply added streaming platforms to the list of places that spike shows up.
| Live-event impact, July 2026 (Nielsen) | Figure |
|---|---|
| Monthly TV usage lift from FIFA World Cup 2026 | +2.2% |
| FOX share of top 26 July telecasts | 25 of 26 |
| FOX broadcast share gain | +0.4 pt to 7.8% |
| Peacock viewership lift, back-to-back months | +15% MoM |
Why the fan segment is worth a separate media line
Deloitte's fan-versus-nonfan data is granular enough to plan a budget against directly. Fans show 92% SVOD adoption versus 77% for nonfans, subscribe to 67% paid music streaming versus 40%, and are far more likely to also pay for gaming services (39% versus 11%). Roughly half of fans say social media is their primary way of engaging with a fandom year-round, and 36% lean on fan or companion podcasts between releases - meaning the fan audience a CTV budget is trying to reach is also active across social and audio at the same time.
| Fan vs. nonfan behavior (Deloitte 2026) | Fans | Nonfans |
|---|---|---|
| SVOD adoption | 92% | 77% |
| Monthly SVOD spend, avg. 4 vs 3 services | USD 71 | USD 56 |
| Paid music streaming subscription | 67% | 40% |
| Paid gaming service subscription | 39% | 11% |
What this means for a media plan
The practical read for anyone planning 2026 media budget: weight spend toward connected TV inventory given the closing gap with traditional TV, keep a reserve for live-event spikes that still cut across every platform at once, and treat the fan segment as a distinct audience worth its own creative rather than folding it into general reach buys. Our performance creative team builds that split into a media plan before spend goes out, and a short planning call is the fastest way to check a specific budget against these 2026 benchmarks. More broadly, our approach to media strategy starts from the same audience-first premise these numbers argue for.
Frequently Asked Questions
How much of total TV time does streaming now command?
A record share. Nielsen's July 2026 Gauge report put streaming at 49.0% of total US TV usage, up 0.5 points month over month and boosted by the FIFA World Cup 2026 and a strong slate of original titles. YouTube alone reached a record 14.2% of TV, ahead of any single traditional broadcast or cable distributor group.
How much does SVOD churn actually cost a streamer?
Antenna's Q1 2026 State of Subscriptions report found Premium SVOD churn stabilizing at a weighted average of 4.6%, a meaningful improvement over prior volatility, even as overall subscriber growth slowed to single digits (+7% in 2025, down from 12% in 2024). Deloitte's 2026 Digital Media Trends survey separately found 41% of consumers cancelled an SVOD service in the past six months, though 22% of those churners returned to the same service - a sign win-back offers now recapture a meaningful share of lost subscribers.
Have ad-supported tiers actually become the default?
For the leading services, yes. Antenna estimates more than 110 million ad-supported streaming plans in the US, excluding Prime Video, with 78% of Premium SVOD subscribers having tried an ad plan at some point in the past four years. Parks Associates separately found 69% of US internet households now use at least one ad-based tier across the leading services, with Peacock and Hulu both above 70% ad-plan adoption since they launched with ads by default.
Is a household actually paying less by choosing ad-supported plans?
Only for the primary account. Streaming price comparisons for 2026 show Netflix's Standard plan at USD 19.99 a month and Premium at USD 26.99, with an extra ad-supported member slot running USD 7.99 against USD 9.99 without ads - a gap of only USD 2. Disney+ holds a similar structure at USD 6.99 versus USD 9.99 for an extra member. The ad discount is real but modest once a household adds any second user.
Where is ad money actually moving as viewing shifts to streaming?
Toward connected TV, fast. eMarketer forecasts US CTV ad spend at USD 36.95 billion in 2026, more than ten times the next two largest markets (the UK and China) combined, and reports CTV ad spending growing 15.1% this year even as traditional TV still draws over USD 50 billion but faces what eMarketer calls another collapse looming in 2027.
Sources
Nielsen - July 2026 Gauge report
Antenna - Q1 2026 State of Subscriptions
Antenna - Q2 2026 Adds & Ads
Deloitte - 2026 Digital Media Trends
Parks Associates - 2026 streaming subscription report
Pocket-lint - 2026 streaming pricing
eMarketer - Global CTV ad spend forecast
eMarketer - US Ad Spending 2026


