



Table of contents
No published benchmark measures podcast or audio advertising for solar companies. What exists is a clear picture of a contracting residential market, cross-industry proof of how podcasts behave against other audio, and federal rules on the savings claims solar scripts love to make.
Key Takeaways
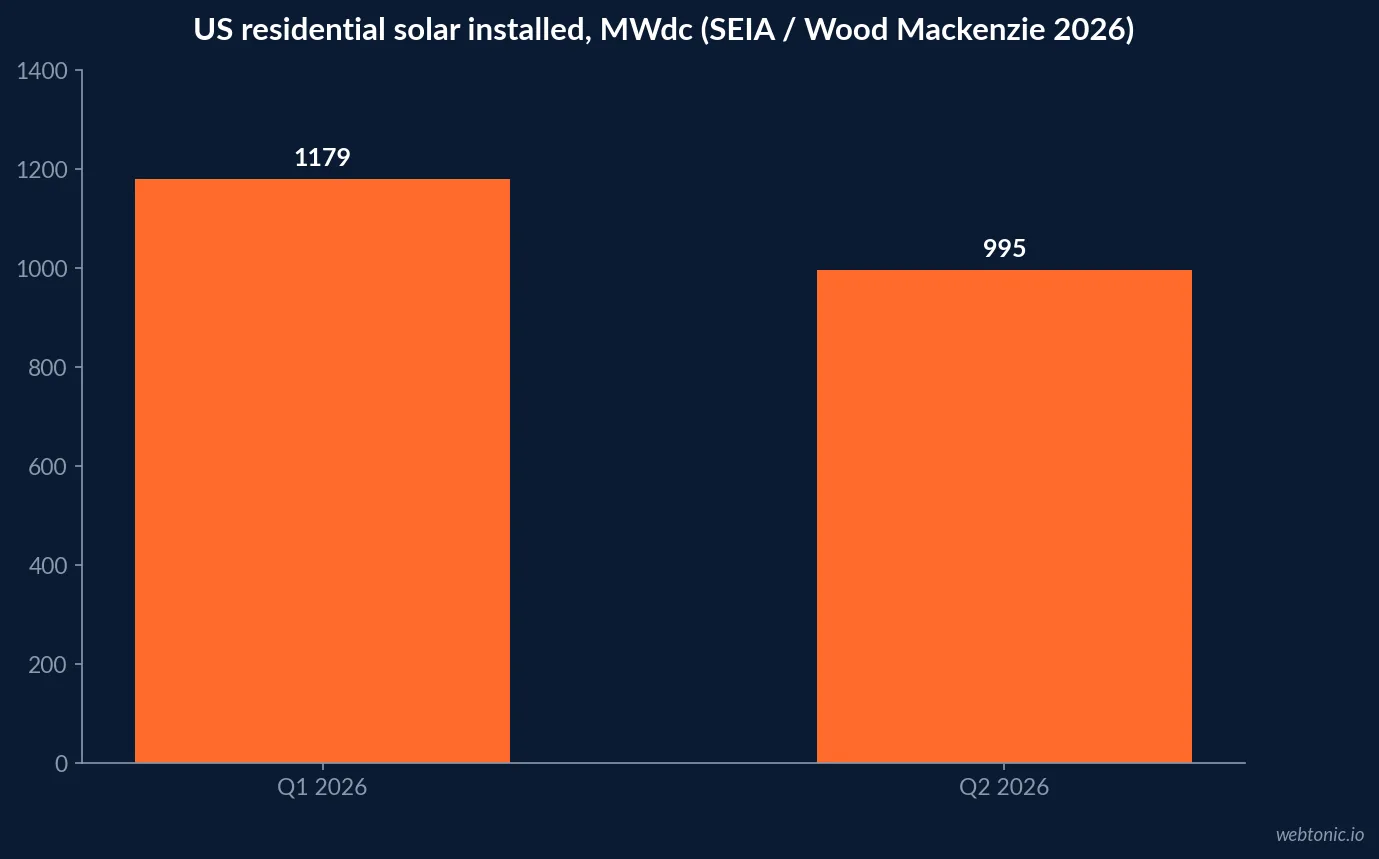
- Residential solar installed 1,179 MWdc in Q1 2026, up 6% year on year (SEIA/Wood Mackenzie).
- Q2 2026 fell to 995 MWdc, the segment's lowest quarter in five years.
- A 23% residential contraction is forecast for 2026.
- The median quoted solar price was USD 2.49/W in H2 2025, up 0.4% (EnergySage).
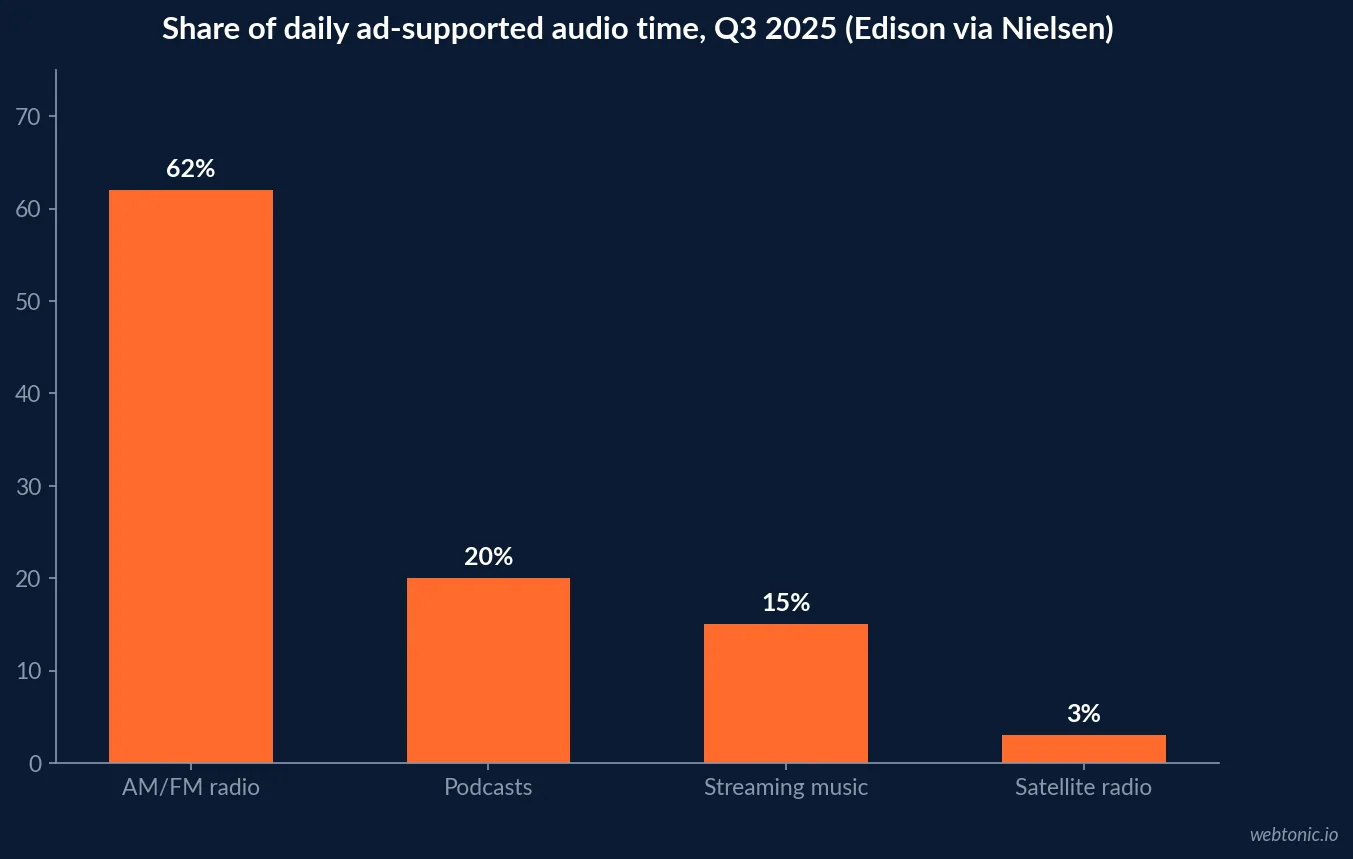
- Radio held 62% of ad-supported audio time in Q3 2025; podcasts held 20%.
- Podcast ads: 0.20% visitor rate vs 0.07% for streaming audio (Podscribe, vendor).
- Podcast CPA USD 168 vs USD 204 for streaming audio, cross-industry.
- 56% of weekly podcast consumers own their home (Edison, 2025).
- Energy sits inside a 23.4% Other bucket of 2023 podcast revenue (IAB/PwC).
- No solar-specific podcast CPM, CTR or CPL exists.
The market audio would be selling into
The SEIA/Wood Mackenzie Solar Market Insight Q2 2026 reports residential installs of 1,179 MWdc in Q1 2026, up 6% year on year but down 15% from Q4 2025, with volumes buoyed by projects started before the Section 25D credit expired. Wood Mackenzie's Q3 2026 commentary then puts Q2 residential at just 995 MWdc, the lowest quarter in five years, and forecasts a 23% contraction for 2026 as installers shift from cash and loan sales toward third-party ownership.
That shift changes the pitch. An audio ad selling a lease or power purchase agreement talks about monthly cost and ownership terms, not a tax credit the listener can no longer claim.
| Residential solar indicator | Figure | Period | Source |
|---|---|---|---|
| Residential installs | 1,179 MWdc (+6% YoY, -15% QoQ) | Q1 2026 | SEIA / Wood Mackenzie |
| Residential installs | 995 MWdc, five-year low | Q2 2026 | Wood Mackenzie |
| Residential outlook | -23% year on year | 2026 forecast | Wood Mackenzie |
| Median quoted price | USD 2.49/W (+0.4%) | H2 2025 | EnergySage |
| Price spread, high vs low | USD 0.58/W to 0.72/W | H1 to H2 2025 | EnergySage |
Price transparency is part of the ad
EnergySage reports that quoted prices rose just 0.4% to USD 2.49/W in the second half of 2025, while the spread between the highest and lowest average quotes widened 24%, from USD 0.58/W to USD 0.72/W, which it calls an USD 8,500 difference on an average-sized system.
A spread that wide is why homeowners shop around, and why a host read that names a vague "huge savings" figure invites comparison it may not survive.
Podcasts versus the rest of audio
The headline in the page title is a real choice. The Record, the quarterly audio report from Nielsen and Edison Research, shows that in Q3 2025 consumers spent 62% of their ad-supported audio time with radio, 20% with podcasts, 15% with streaming music and 3% with satellite radio. Radio still carries the reach.
Response is a different picture. Podscribe's Q3 2026 Performance Benchmark Report (vendor, August 2025 to July 2026 campaigns) puts podcasts at a 0.20% visitor rate and USD 168 CPA, against 0.07% and USD 204 for streaming audio ads. It uses a 30-day conversion window for podcasts and 14 days for streaming. These are all-industry medians, not solar figures.
| Audio format | Share of ad-supported time (Q3 2025) | Visitor rate (Podscribe) | CPA (Podscribe) |
|---|---|---|---|
| AM/FM radio | 62% | Not measured by Podscribe | Not measured |
| Podcasts | 20% | 0.20% | USD 168 |
| Streaming audio | 15% (music) | 0.07% | USD 204 |
| Satellite radio | 3% | Not measured | Not measured |
Why homeownership decides the buy
Solar only sells to people who control a roof. Edison's Podcast Consumer 2025 reports 56% of weekly podcast consumers own their home and 47% of monthly consumers earn USD 75K or more, against 43% of the US population. That skew toward owners and higher incomes is the cross-industry case for podcasts over mass-reach formats.
It is still a national average. An installer serving three counties needs geography before demographics.
Geo targeting: the lever that matters most
Solar is a service-area business, and audio can now be bought that way. The Libsyn Ads marketplace lists geo targeting by city, state, ZIP, DMA and point of interest. Podscribe ranks DMA as the single targeting factor with the largest effect on podcast performance, ahead of recent website visit and buyer power, with listener affluence also among the top levers.
Pair that with the market data: target the DMAs where your permits and financing partners are active, and leave national shows to national installers.
There is also a timing reason to stay local. Wood Mackenzie notes that permitting delays now affect a large share of projects, and installers differ by utility territory in how fast they can interconnect. An audio flight that generates quotes in a county where you cannot install for months is paying for leads you will lose to a competitor with a shorter queue.
| Targeting factor (Podscribe Q3 2026) | Reported impact | Solar use |
|---|---|---|
| DMA | Maximum | Match to the service area and utility territory |
| Recent website visit | High | Retarget quote-page visitors on audio |
| Buyer power / affluence | High | Owner households able to sign a PPA or lease |
| Time of day, day of week | Low | Do not pay a premium for daypart |
The savings-claim rules
Solar marketing has an explicit federal warning on the record. The FTC's 2024 business guidance on solar tells sellers to disclose the total cost, be clear about financing options and not overpromise cost savings that might come through tax credits, rebates or incentives. Renewable-energy claims are covered by the Green Guides at 16 CFR 260.15, which says it is deceptive to misrepresent, directly or by implication, that a product or service uses renewable energy.
Host reads add the FTC Endorsement Guides (16 CFR Part 255): a host who says they installed your system must actually have done so, and the paid relationship has to be clear. On broadcast radio, 47 CFR 73.1212 separately requires the station to announce that paid matter is sponsored and by whom.
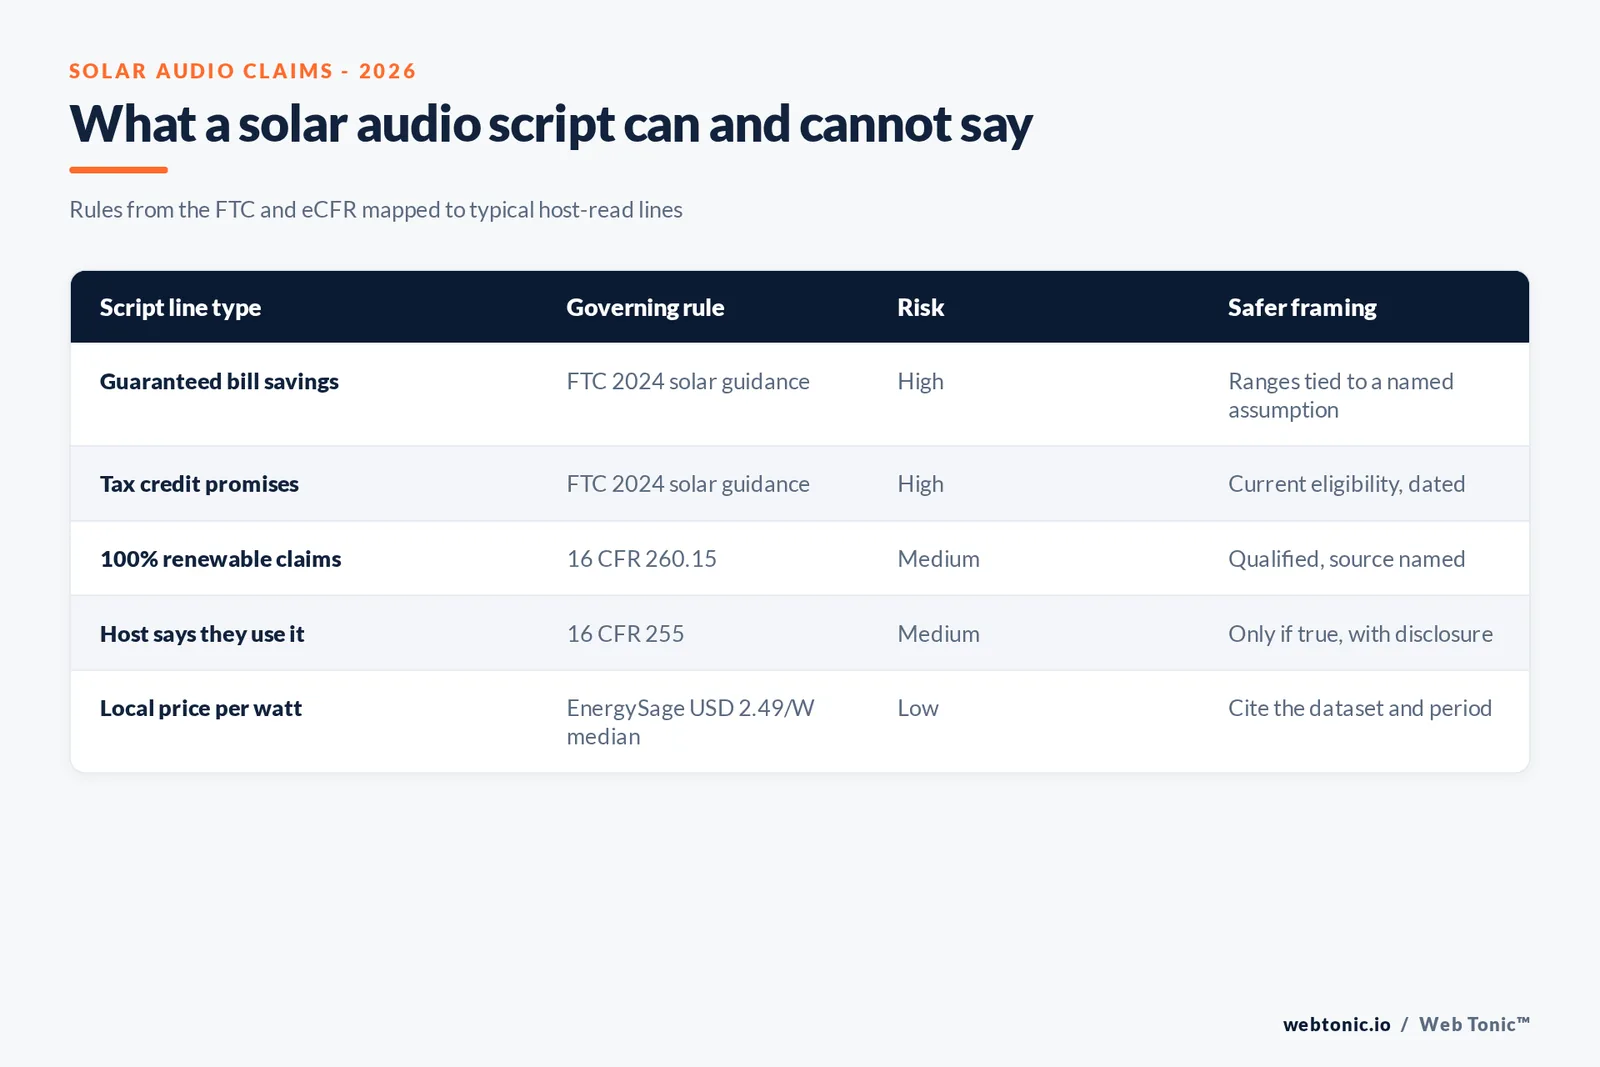
| Claim in the script | Rule | Why it is risky in 2026 |
|---|---|---|
| Save USD X a year, guaranteed | FTC solar guidance 2024 | Savings depend on rates, usage and financing |
| Claim the 30% tax credit | FTC solar guidance 2024 | Section 25D expired for homeowners after 2025 |
| 100% clean energy home | 16 CFR 260.15 | Needs qualification and a named source |
| The host's own install story | 16 CFR 255 | Must be true and the payment disclosed |
| Radio sponsor tag | 47 CFR 73.1212 | Station must identify the sponsor |
What an entry-level audio test costs
Because no solar rate card exists, the practical question is the floor. Spotify's Ad Studio help centre sets a minimum lifetime budget of roughly the equivalent of USD 250, and its self-serve audio spots run up to 30 seconds. On the host-read side, the Libsyn Ads marketplace (vendor, 1,300+ shows and more than 35 million monthly listeners) quotes a typical 30-second spot at USD 10 to 50 per thousand downloads, with 60-second spots and business-audience shows priced higher.
Set against EnergySage's price data, the arithmetic is lopsided in audio's favour: a single signed system at USD 2.49/W is worth many times a starter flight. The risk is not the media cost but wasting a flight on the wrong geography or an unprovable claim.
| Entry route | Published floor or rate | Publisher | Best solar use |
|---|---|---|---|
| Spotify Ad Studio | About USD 250 lifetime minimum | Spotify help centre | Geo-fenced streaming test in one DMA |
| Host-read podcast, 30s | USD 10-50 CPM (typical range) | Libsyn Ads, vendor | Home, finance and local shows |
| Host-read podcast, 60s | Priced above 30s spots | Libsyn Ads, vendor | Explaining lease vs purchase |
| Short 10-15s spot | Priced below 30s spots | Libsyn Ads, vendor | Brand reminders near a quote campaign |
Script angles that fit a post-credit market
The data above points to a handful of honest messages. With the homeowner credit gone and third-party ownership rising, an audio script can lead on monthly cost under a lease or PPA, on quote comparison given a USD 0.72/W spread between high and low quotes, on storage for outage-prone areas, or on the installer's local track record. Each can be said without a guaranteed savings number.
What should not appear is a national savings average read by a host who has never met the installer. The FTC guidance, the Green Guides and the Endorsement Guides all point the same way: specific, true and qualified beats big and vague.
- Monthly cost angle: state the financing type and that terms vary.
- Comparison angle: invite listeners to compare quotes, citing the spread.
- Local proof angle: installs in the listener's own town, only if real.
- Resilience angle: storage and backup, without implied grid-independence claims.
What the category data does and does not say
The IAB/PwC FY2023 podcast revenue study does not break out solar or energy. Energy sits in an Other category, alongside government, non-profit, tech and law, that accounted for 23.4% of 2023 podcast ad revenue. Home Improvement/Furnishings, the nearest home-services category, held 2.0%.
So the honest summary is that solar is a small, unmeasured podcast category. That is an opening for a local installer, and a reason to distrust anyone quoting a "solar podcast CPM".
A test plan sized to a contracting market
- Run one podcast flight and one streaming or radio flight in the same DMA, for the same four weeks.
- Give each a separate landing page and phone number; judge podcasts on a 30-day window.
- Write savings as a range with the assumption spoken aloud.
- Measure cost per signed contract, not cost per visitor.
Our growth marketing team sets up that kind of split test. For other solar channels, see our solar SMS marketing statistics and solar influencer and UGC data, or our streaming media statistics for the wider audience picture.
Frequently Asked Questions
Are podcasts or radio better for solar advertising?
No study compares them for solar specifically. Cross-industry data shows radio still holds the largest share of ad-supported audio time, 62% in Q3 2025 against 20% for podcasts (Edison data published by Nielsen), while Podscribe's 2026 vendor benchmark shows podcast ads outperforming streaming audio on visitor rate, 0.20% against 0.07%. Radio buys reach; podcasts tend to buy response.
Is there a solar-specific podcast CPM or cost per lead?
No. The IAB/PwC podcast study groups energy with government, tech and law inside an Other bucket worth 23.4% of 2023 revenue, and no vendor we reviewed publishes a solar CPM, CTR or cost per lead. Any figure presented as a solar podcast benchmark should be treated with suspicion.
What can a solar ad say about savings?
The FTC's 2024 business guidance tells solar sellers to disclose the total cost, be clear about financing and not overpromise savings from tax credits, rebates or incentives. Renewable-energy claims fall under the Green Guides, 16 CFR 260.15. Keep savings as ranges tied to a stated assumption.
How should an installer target audio geographically?
By service area. Libsyn Ads' marketplace offers geo targeting by city, state, ZIP, DMA and point of interest, and Podscribe's Q3 2026 report ranks DMA as the targeting factor with the largest impact on performance.
Is 2026 a good year to test audio for residential solar?
It is a harder year. SEIA and Wood Mackenzie expect residential installs to contract 23% in 2026 after the 25D credit expired, with Q2 at 995 MWdc, a five-year low. Tests should be small and measured against cost per signed contract, not impressions.
Sources
SEIA / Wood Mackenzie - Solar Market Insight Q2 2026
Wood Mackenzie - US solar Q3 2026 commentary
EnergySage - Home energy market H2 2025 highlights
FTC - Don't waste your energy on a solar scam (2024)
eCFR - 16 CFR 260.15 Renewable energy claims
eCFR - 16 CFR Part 255, FTC Endorsement Guides
eCFR - 47 CFR 73.1212 Sponsorship identification
Nielsen - The Record, Q3 audio listening trends
Podscribe - Performance Benchmark Report Q3 2026
Spotify Advertising - Ad Studio help centre
Libsyn Ads - Podcast advertising marketplace
Edison Research - The Podcast Consumer 2025
IAB/PwC - US Podcast Advertising Revenue Study FY2023


