



Table of contents
Solar marketers should budget for UGC from published third-party rate cards: the average UGC creator on Collabstr charges USD 195 in 2026, and most small-tier creator costs sit under USD 500. No study benchmarks solar creator campaigns specifically, so every rate below is cross-industry.
Key Takeaways
- The average UGC creator charges USD 195 (Collabstr calculator, 2026).
- UGC campaigns averaged USD 197, down 5.7% from USD 209.
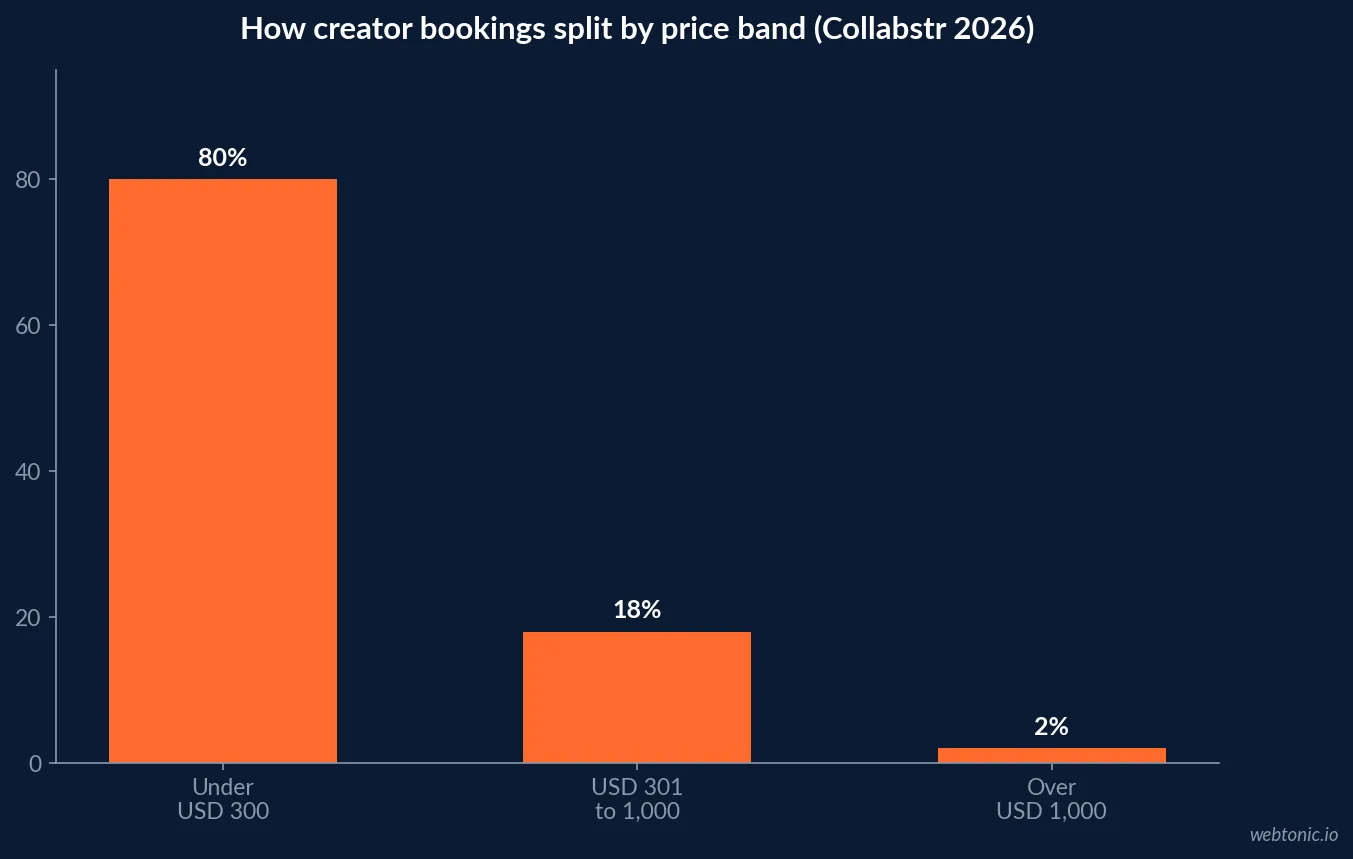
- 80% of marketplace collaborations cost under USD 300.
- Only 2% of collaborations exceed USD 1,000.
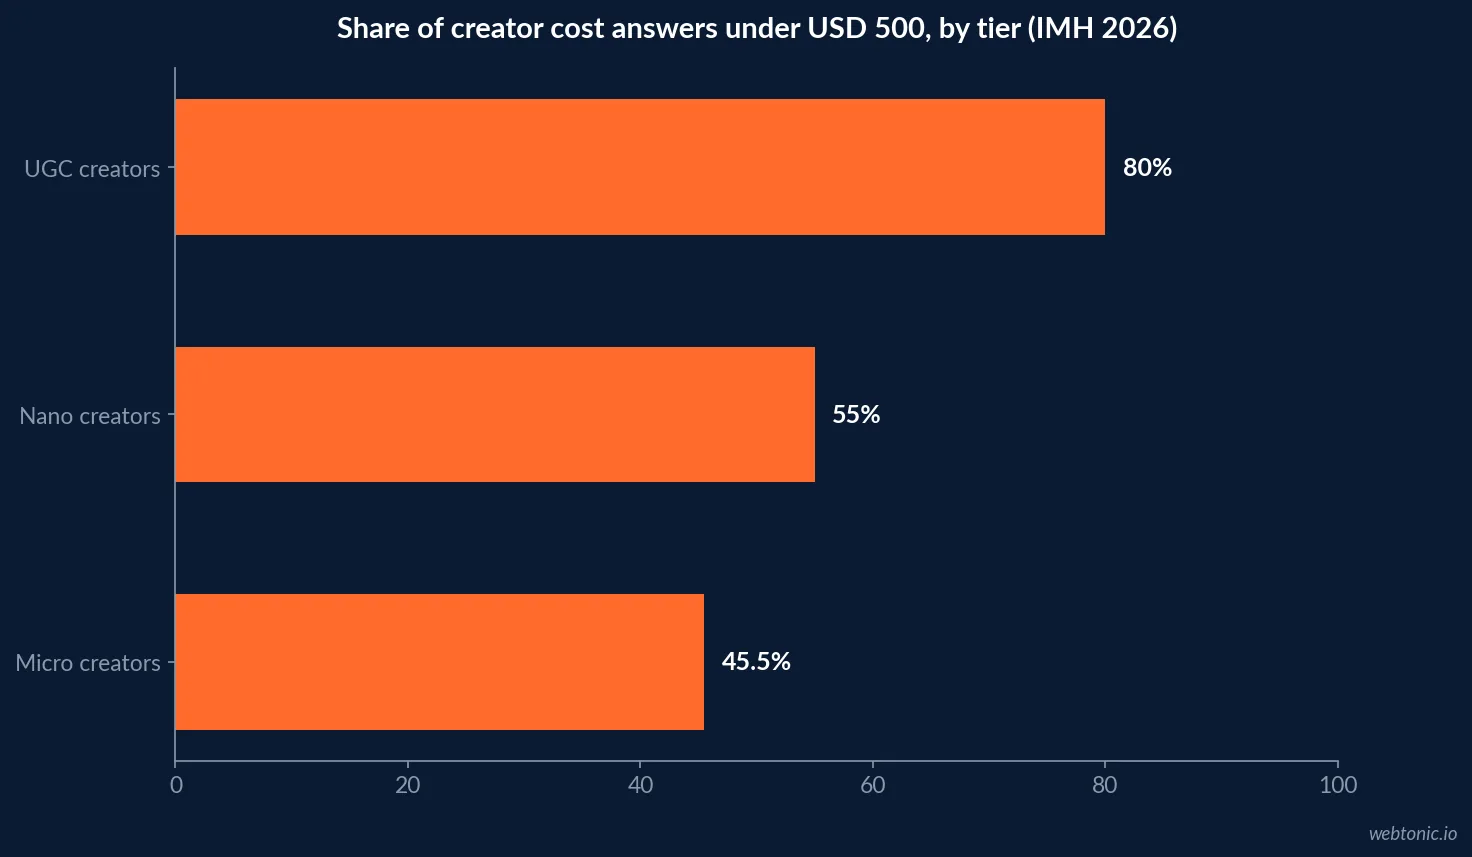
- About 80% of UGC creator costs sit under USD 500 (IMH 2026 survey).
- Mid-tier creators cluster in USD 2,000-10,000 bands (about 22.2% each).
- Skilled Trades creators average USD 309, the priciest niche, up 103% in searches.
- Residential solar installed 995 MWdc in Q2 2026, down 12% (SEIA).
- SEIA forecasts a 23% residential contraction in 2026.
- US creator ad spend is projected at USD 44 billion in 2026 (IAB).
- No solar-specific creator engagement, cost or ROI benchmark exists.
The base rate: what one UGC deliverable costs
The cleanest public rate card is the Collabstr UGC creator price calculator, which draws on more than 1.3 million creator rate data points and puts the average UGC creator at USD 195 in 2026. The Collabstr 2026 Influencer Marketing Report, built from more than 21,000 collaborations, shows the realised average for UGC campaigns at USD 197, down from USD 209 the year before.
That is the unit to budget from: one delivered asset. A solar installer usually needs several per campaign - a rooftop walkthrough, an app screen showing production, a financing explainer - so the line item is the unit cost times the asset count, plus usage rights.
| Rate card (2026) | Figure | Source | What it prices |
|---|---|---|---|
| UGC creator, average ask | USD 195 | Collabstr calculator | One UGC deliverable |
| UGC campaign, realised average | USD 197 | Collabstr report | Negotiated payout |
| UGC campaign, prior year | USD 209 | Collabstr report | Shows a 5.7% fall |
| Collaborations under USD 300 | 80% | Collabstr report | The typical small booking |
| Collaborations USD 301-1,000 | 18% | Collabstr report | Mid-sized creators |
| Collaborations over USD 1,000 | 2% | Collabstr report | Premium partnerships |
Asking price versus what brands actually pay
Collabstr separates posted package prices from final payouts, and the gap is a negotiating guide. Average asks run from USD 311 on YouTube and USD 214 on Instagram to USD 180 for UGC, while average payouts are USD 255, USD 193 and USD 154 respectively. YouTube's average payout fell 63% year on year from USD 418.
For an installer, the point is that the listed rate is an opening number. Bundling several assets, fixing the shoot location and agreeing usage terms up front is how brands on the platform close below ask.
| Platform (Collabstr 2026) | Average ask | Average payout | Gap |
|---|---|---|---|
| YouTube | USD 311 | USD 255 | USD 56 |
| USD 214 | USD 193 | USD 21 | |
| TikTok | USD 182 | USD 186 | Payout above ask |
| UGC | USD 180 | USD 154 | USD 26 |
| Twitch | USD 398 | USD 127 | USD 271 |
Cost bands by creator tier
The Influencer Marketing Hub 2026 benchmark asked 600-plus respondents what they pay by tier. Roughly 80% of UGC creator answers sit under USD 500, about 55% for nano creators and about 45.5% for micro creators. Mid-tier creators most often land in the USD 2,000-5,000 and USD 5,000-10,000 bands, about 22.2% each, while macro creators spread into bands above USD 10,000.
Intent is shifting down-market too: 51.43% plan to expand nano work and 52.83% micro work, against 42.42% for mid-tier. For local installers, nano and micro creators with a regional audience are the realistic tier.
Which tiers marketers plan to grow
Influencer Marketing Hub also asked respondents how their use of each creator tier will change in 2026. Expansion intent is highest at the small end: 52.83% for micro creators and 51.43% for nano creators, against contraction of 7.55% and 10.00%. UGC creators show 50.00% planning growth and none planning to cut. Mid-tier is split, with 42.42% expanding and 21.21% contracting.
For a solar budget, this is a supply signal as much as a demand one. More brands chasing the same local nano and micro creators means the cheapest tier may not stay cheapest, so lock rates for a full season where you can and keep a shortlist of backup creators in each service area.
| Creator tier (IMH 2026) | Plan to expand | Plan to reduce or stop |
|---|---|---|
| Micro | 52.83% | 7.55% |
| Nano | 51.43% | 10.00% |
| UGC | 50.00% | 0% |
| Mid-tier | 42.42% | 21.21% |
Why trades content prices higher
Collabstr ranks Skilled Trades as the most expensive niche at USD 309 per collaboration and the second-fastest growing, with searches up 103%. Solar content that explains inverters, panel layouts or battery sizing sits close to that niche, because it relies on demonstrable know-how rather than lifestyle aesthetics.
Budget the expert tier for explainers and the cheaper UGC tier for homeowner reaction and testimonial formats. Mixing the two keeps the average cost near the marketplace mean while covering both trust and reach.
| Content job | Creator type | Published cost reference | Source |
|---|---|---|---|
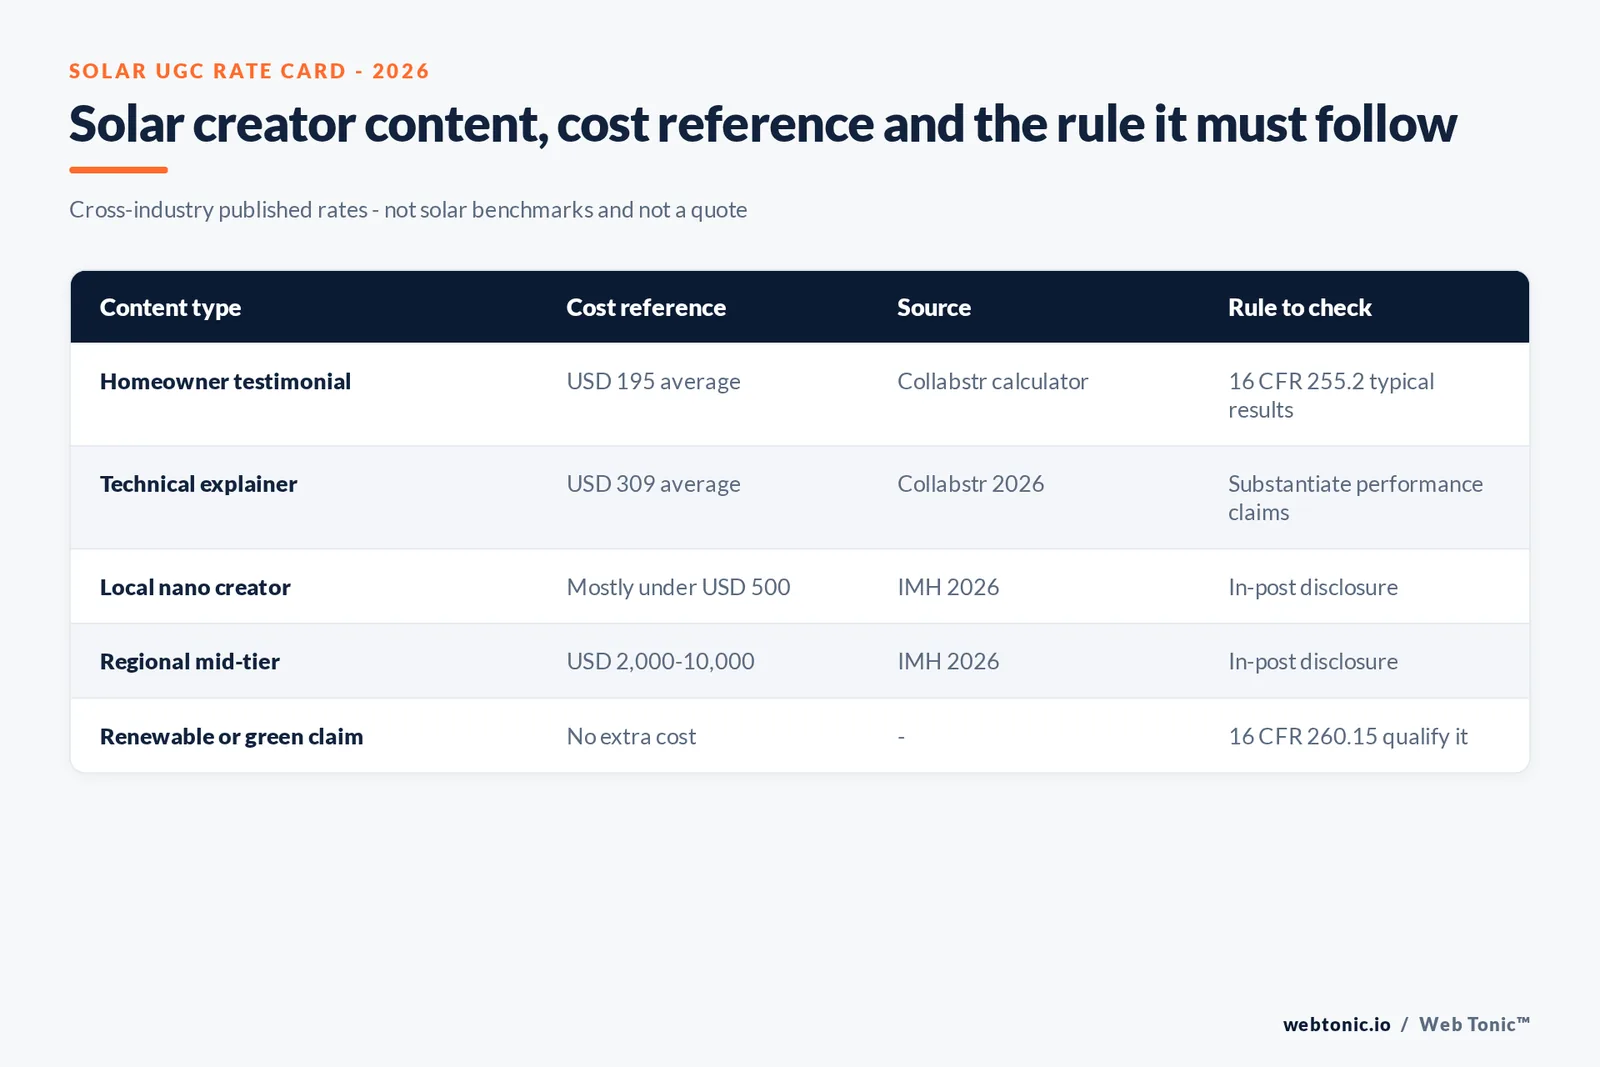
| Technical explainer | Trades or education creator | USD 307-309 average | Collabstr 2026 |
| Homeowner testimonial | UGC creator or customer | USD 195 average | Collabstr calculator |
| Local awareness | Nano or micro creator | Mostly under USD 500 | IMH 2026 |
| Regional reach | Mid-tier creator | USD 2,000-10,000 bands | IMH 2026 |
What the rate cards cannot tell a solar marketer
None of the datasets on this page records a solar campaign's cost per lead, engagement rate or return. Collabstr's figures are marketplace averages across all niches, Influencer Marketing Hub's bands are survey answers, and neither separates home-energy brands. Treat any vendor quoting a solar-specific creator ROI without a named sample with suspicion.
What the rate cards do support is a floor and a ceiling for a test: a handful of assets near the USD 195 mean, one or two expert explainers near USD 309, and a tracked consultation link per creator to produce the first solar-specific numbers you will actually own.
Sizing the budget against a contracting market
The SEIA and Wood Mackenzie Solar Market Insight Q3 2026 reports 995 MWdc of residential solar installed in Q2 2026, down 12% year on year and 10% on the quarter, as the Section 25D credit for customer-owned systems expired at the end of 2025. The forecast is now a 23% residential contraction for 2026, steeper than the 21% expected a quarter earlier, before average growth of 6% a year from 2027 to 2031.
SEIA notes installers report longer sales cycles and falling close rates, and a shift toward third-party ownership. That changes the brief: creator content that explains leases and power purchase agreements honestly is doing more work than generic rooftop footage.
Regional detail sharpens the picture. SEIA reports California and Illinois led residential volume in Q2 2026 on high third-party ownership and rising retail rates, with installed capacity up 8% and 38% in the first half, but permits down 25% and 20%, signalling a contraction ahead. An installer in a market where permits are falling should fund fewer, better-targeted assets rather than a broad awareness push, and put financing and ownership explainers ahead of lifestyle footage.
| Residential solar (SEIA Q3 2026) | Figure |
|---|---|
| Q2 2026 installed | 995 MWdc |
| Change year on year | -12% |
| Change quarter on quarter | -10% |
| 2026 residential forecast | -23% |
| Annual growth 2027-2031 | +6% average |
Savings claims: Green Guides and typical results
The biggest compliance risk in solar UGC is the bill-savings line. Under the FTC Endorsement Guides, section 255.2, a consumer testimonial on a central attribute is read as what customers generally achieve; without substantiation, the ad must clearly disclose the generally expected result. The Green Guides (16 CFR 260.15) add that renewable energy claims should be clearly qualified unless the marketer can substantiate every express and implied claim.
The FTC's Disclosures 101 guide makes the creator side plain: paid or gifted relationships must be disclosed in the post. A homeowner who received a discount and films their install is a material connection.
Paying to extend the best asset
Much of a UGC budget goes to distribution, not production. TikTok Spark Ads let a brand run an organic post - its own, or a creator's with authorisation - as an ad, with engagement credited to the original post, and support conversion and lead generation objectives. That turns one USD 195 asset into a paid unit without re-shooting.
Linqia's 2026 survey of 200-plus enterprise marketers found 100% repurpose creator content beyond the creator's own feed and 81% say it outperforms brand assets. That is self-reported and cross-industry, but it explains why licensing terms belong in the budget.
Where the wider market is heading
The IAB projects US creator ad spend of USD 44 billion in 2026, after an estimated USD 37 billion in 2025, with 48% of creator ad buyers now calling creators a must-buy. Influencer Marketing Hub reports 87.49% of respondents expect budgets to rise. Solar installers are entering a crowded channel in a soft year, so small, tested bookings beat a single large commitment.
A budgeting checklist for installers
- Price assets individually from the USD 195 UGC reference, then multiply.
- Reserve the expert tier for technical explainers only.
- Negotiate from the ask, using the published payout gap.
- Put paid usage rights and Spark Ads authorisation in the contract.
- Substantiate or qualify every savings and renewable claim.
See our influencer and UGC marketing statistics for the cross-industry picture and our solar SMS marketing data for follow-up after a lead. Our performance creative and growth marketing teams can scope a test, or contact us.
Frequently Asked Questions
How much does a UGC video cost for a solar company?
There is no solar-specific rate card. Collabstr's UGC price calculator, built on more than 1.3 million creator rate data points, puts the average UGC creator at USD 195 in 2026, and its annual report shows UGC campaigns averaging USD 197, down 5.7% from USD 209. Installers should read these as cross-industry marketplace figures and budget more for creators who can film on a real roof or with a real customer.
What budget do different creator tiers need?
Influencer Marketing Hub's 2026 survey of 600-plus respondents reports about 80% of UGC creator costs and about 55% of nano creator costs under USD 500, about 45.5% of micro creator costs under USD 500, and mid-tier creators most often in the USD 2,000 to 5,000 and USD 5,000 to 10,000 bands (about 22.2% each). None of this is broken out for solar.
Can a solar creator talk about bill savings?
Only with care. Under the FTC Endorsement Guides (16 CFR 255.2), a customer testimonial about a key attribute such as savings is read as what customers generally achieve, so the installer needs substantiation or a clear statement of typical results. The Green Guides (16 CFR 260.15) add that renewable energy claims should be qualified unless every express and implied claim can be substantiated.
Is 2026 a sensible year to increase solar UGC spend?
It is a harder year. SEIA and Wood Mackenzie report 995 MWdc of residential solar installed in Q2 2026, down 12% year on year, and now forecast a 23% residential contraction for 2026 after the Section 25D credit expired. Installers report longer sales cycles, which argues for content that answers financing and ownership questions rather than pure awareness.
Do installers have to disclose paid creator partnerships?
Yes. The FTC requires any material connection - payment, free or discounted products, or other benefits - to be disclosed clearly and conspicuously in the post itself. That includes a discounted system given to a homeowner who then posts about it.
Sources
Collabstr - UGC creator price calculator
Collabstr - 2026 Influencer Marketing Report
Influencer Marketing Hub - Influencer Marketing Benchmark Report 2026
SEIA and Wood Mackenzie - Solar Market Insight Report Q3 2026
eCFR - 16 CFR Part 255, FTC Endorsement Guides
eCFR - 16 CFR 260.15, Green Guides renewable energy claims
FTC - Disclosures 101 for Social Media Influencers
TikTok - About Spark Ads
Linqia - 2026 State of Influencer Marketing
IAB - 2025 Creator Economy Ad Spend and Strategy Report


