



Table of contents
No study measures CTV results for solar companies specifically, so the honest answer is that it depends on evidence you collect yourself. What the data does show is a residential market that shrank to 995 MWdc in Q2 2026, cheaper and more local CTV buying, and strict federal rules on green claims.
Key Takeaways
- Residential solar installed 1,179 MWdc in Q1 2026, up 6% year over year (SEIA / Wood Mackenzie).
- Q2 2026 residential installs fell to 995 MWdc, the lowest quarter in five years (Wood Mackenzie).
- Wood Mackenzie expects a 23% residential contraction in 2026.
- A record 45% of Q1 residential systems were paired with batteries (SEIA).
- Median quoted solar price was USD 2.49 per watt in H2 2025 (EnergySage marketplace data).
- 70% of CTV advertisers plan to raise CTV spend in 2026, by 17% on average (Premion survey).
- 21% of global open programmatic CTV traffic was invalid in Q4 2025 (Pixalate).
- Streaming held 48.2% of ad-supported TV viewing in Q2 2026 (Nielsen).
What "working" can mean, and what evidence exists
An ad channel works for solar when it produces quote requests and signed contracts at an acceptable cost. The table grades each type of evidence by how close it gets to that test.
| Evidence type | Example | Solar-specific? | Strength |
|---|---|---|---|
| Industry CTV benchmark | None published | No | Does not exist |
| Vendor outcome reporting | MNTN verified visits and ROAS | No, cross-industry | Directional, vendor-measured |
| Advertiser intent surveys | Premion 2026, n=151 | No, cross-industry | Shows spending plans, not results |
| Market demand data | SEIA, Wood Mackenzie, EnergySage | Yes | Strong for sizing and timing |
| Your own geo test | Exposed vs unexposed ZIP codes | Yes | Best available proof |
The residential market CTV would be selling into
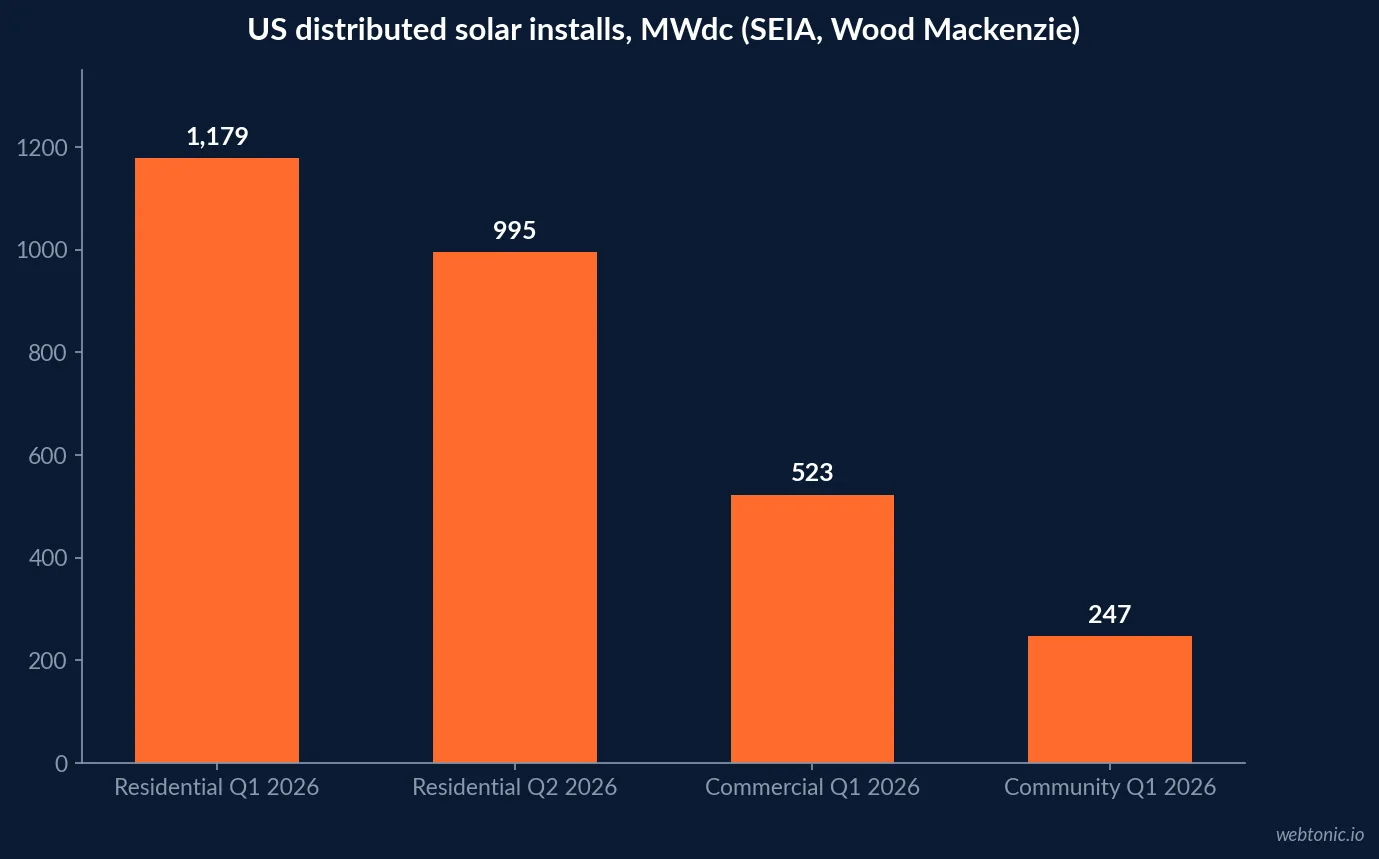
The SEIA / Wood Mackenzie Solar Market Insight Q2 2026 put residential installs at 1,179 MWdc in Q1 2026, up 6% on Q1 2025 and down 15% on Q4 2025, buoyed by projects started before the Section 25D credit expired. Commercial solar added 523 MWdc and community solar 247 MWdc.
The second quarter was weaker. In its September 2026 analysis, Wood Mackenzie reports 995 MWdc of new residential installs, the lowest quarterly total in five years, and a forecast 23% contraction for 2026 as installers move from cash and loan sales to third-party ownership.
| Residential solar indicator | Value | Period | Source |
|---|---|---|---|
| Residential installs | 1,179 MWdc | Q1 2026 | SEIA / Wood Mackenzie |
| Residential installs | 995 MWdc | Q2 2026 | Wood Mackenzie |
| Full-year residential outlook | -23% | 2026 forecast | Wood Mackenzie |
| Share of residential systems with storage | 45% (record) | Q1 2026 | SEIA |
Buyer behaviour after the 25D deadline
EnergySage's 22nd marketplace report, drawn from transaction-level shopping data between July and December 2025, recorded a 205% year-over-year jump in homeowners actively working with installers, and median quoted prices up only 0.4% to USD 2.49 per watt. Its H2 2025 highlights show the price spread between high and low quotes widening from USD 0.58 to USD 0.72 per watt, about USD 8,500 on an average system.
| EnergySage marketplace, H2 2025 | Figure | Why it matters for ads |
|---|---|---|
| Median quoted solar price | USD 2.49/W | Price claims need current local quotes |
| Quote spread, high vs low | USD 0.72/W | Room for a transparent-pricing message |
| National battery attachment | 38% (from 41%) | Deferred storage = retrofit audience |
| Homeowner interest in storage | 73% (from 74%) | Interest held while purchases slipped |
| California battery attachment | 71% (from 79%) | State markets differ sharply |
That last group is a practical CTV audience: households that installed solar in the 2025 rush and deferred a battery. EnergySage calls it a retrofit opportunity; a geo-fenced streaming flight in high-attachment states is one way to reach it, though no dataset yet measures how well it performs.
Streaming reach in the ad-supported TV market
Nielsen's Q2 2026 Ad Supported Gauge put ad-supported TV at 71.5% of total viewing, with streaming holding 48.2% of that ad-supported time, up 1.6 points. Among adults 18+, streaming falls to 44.4% while broadcast rises to 28.6%. Homeowners are overwhelmingly adults, so the 18+ view is the more relevant one for a solar buyer.
Local advertisers are buying more CTV
The Premion / Advertiser Perceptions 2026 CTV/OTT Advertiser Survey (n=151 US advertisers spending at least USD 250,000 a year, fielded October 2025; Premion sells regional CTV) asked which channels each advertiser would increase in 2026. CTV led by a wide margin.
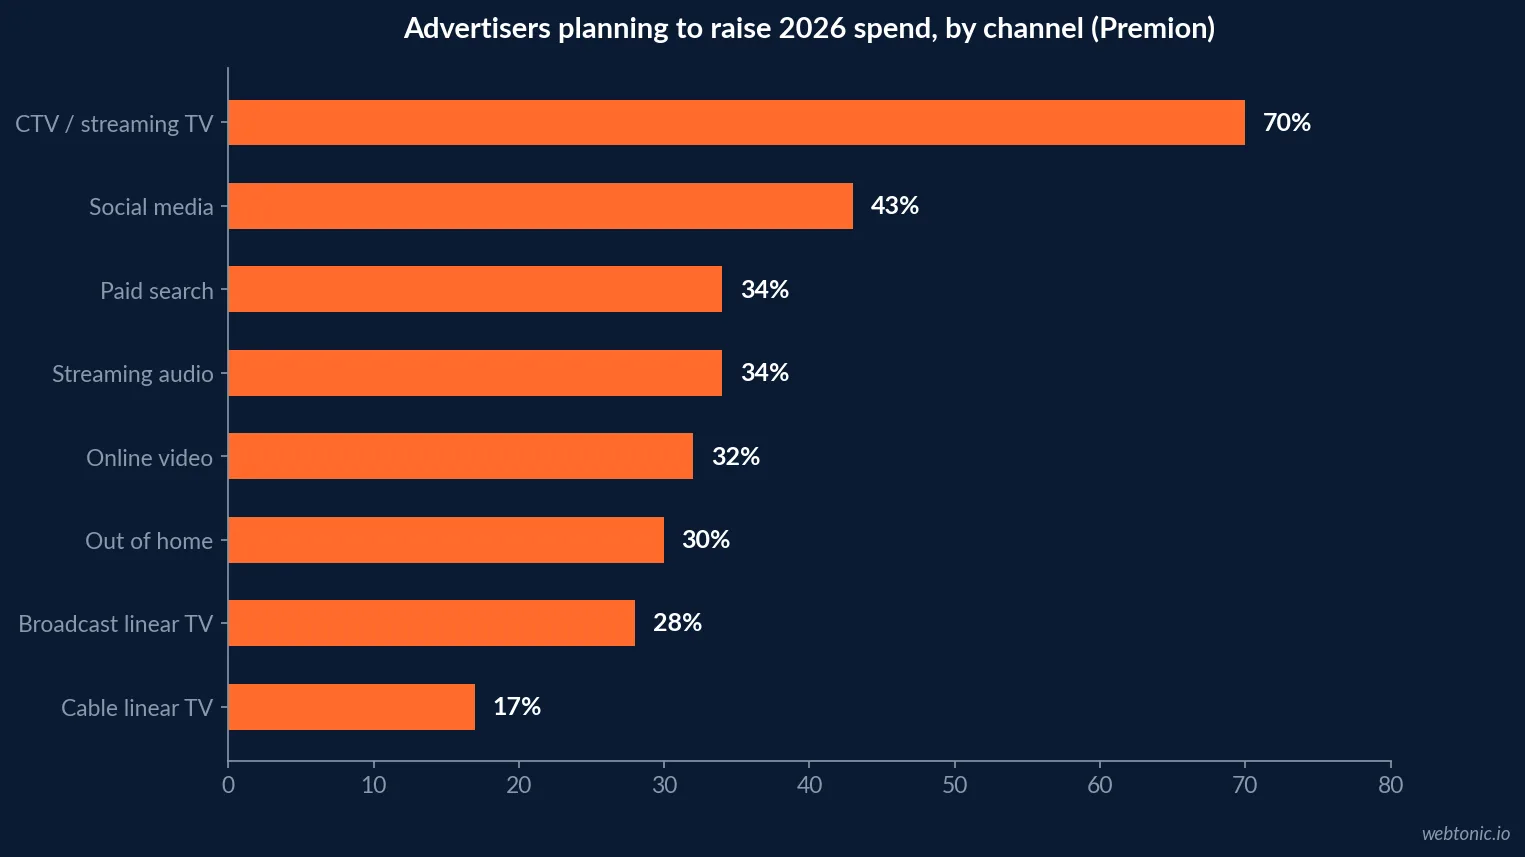
The same survey found 86% agree CTV will grow as a key channel for local and regional advertisers, and that 50% of CTV buying is expected to be programmatic in 2026. Intent to spend is not proof of return; it shows that local service businesses are testing the channel.
Outcome data: what vendors report
Performance CTV vendors publish outcome figures from their own platforms. MNTN's small-business test (vendor data, one stationery retailer) spent USD 10,000 and reported 410,816 airings reaching 260,000+ households with a 16% lift in site visits. MNTN states campaigns can start at USD 2,000 and geo-target locally. None of this is solar data.
Buyers are sceptical of such numbers. In an MNTN-commissioned survey of senior brand and agency marketers, 62% said they question the CTV performance figures they receive, only 33% fully trust platform claims, and 35% define success as qualified leads, the metric a solar installer would use.
Fraud and device mix
Pixalate's Q4 2025 CTV supply chain report, based on more than 7 billion open programmatic transactions, found 21% of global CTV traffic invalid and recorded USD 6.9 billion in global open programmatic CTV spend. In North America, Roku held 32% share of voice, Amazon Fire TV 16%, Apple TV 15%, Samsung 14% and LG 10%.
| Device (Pixalate, Q4 2025) | North America share of voice | Global invalid traffic note |
|---|---|---|
| Roku | 32% | Largest North American supply source |
| Amazon Fire TV | 16% | Lowest global IVT rate, 14% |
| Apple TV | 15% | Not separately flagged |
| Samsung Smart TV | 14% | Highest global IVT rate, 28% |
| LG | 10% | 73% of traffic with unmapped bundle IDs |
Entry points for a local solar test
A solar installer rarely needs national reach, and the published entry points are now low enough for a single-metro test. The figures below are what vendors state on their own pages; none is a solar price and none guarantees delivery at a given frequency.
| Vendor or survey | Published figure | What it means for an installer |
|---|---|---|
| Roku Ads Manager | USD 500 to 1,000 enough for most first tests | A metro test is feasible |
| MNTN Performance TV | Campaigns from USD 2,000 | Geo-targeted with outcome reporting |
| MNTN geo coverage | Over 99% of US households | ZIP-level targeting possible |
| Premion survey | 50% of CTV bought programmatically in 2026 | Half of buying is automated |
| Premion survey | 86% see CTV growing for local advertisers | Local peers are testing it |
Roku's cost guide adds that it prices on dynamic CPM, with no upfront payment and the option to cap bids, so an installer can pause a flight when installation calendars fill, as most did by October 2025 according to EnergySage. That flexibility matters more in solar than in most categories because installer capacity, not demand, often limits how many new customers a company can take on in a quarter.
State markets behave differently
National averages hide large state gaps. EnergySage's H2 2025 data shows battery attachment falling from 79% to 71% in California, from 61% to 53% in Texas and from 100% to 85% in Hawaii. SEIA reports Texas as the fastest-growing solar market overall, with Ohio entering the top three states for deployment in Q1 2026. For CTV, where the buy is geographic, a single national message wastes money: a California retrofit spot, a Texas new-install spot and a third-party-ownership spot for states where leases dominate are three different campaigns with three different audiences. Build each on the state's own data and measure it separately.
FTC Green Guides: the claims rule for solar spots
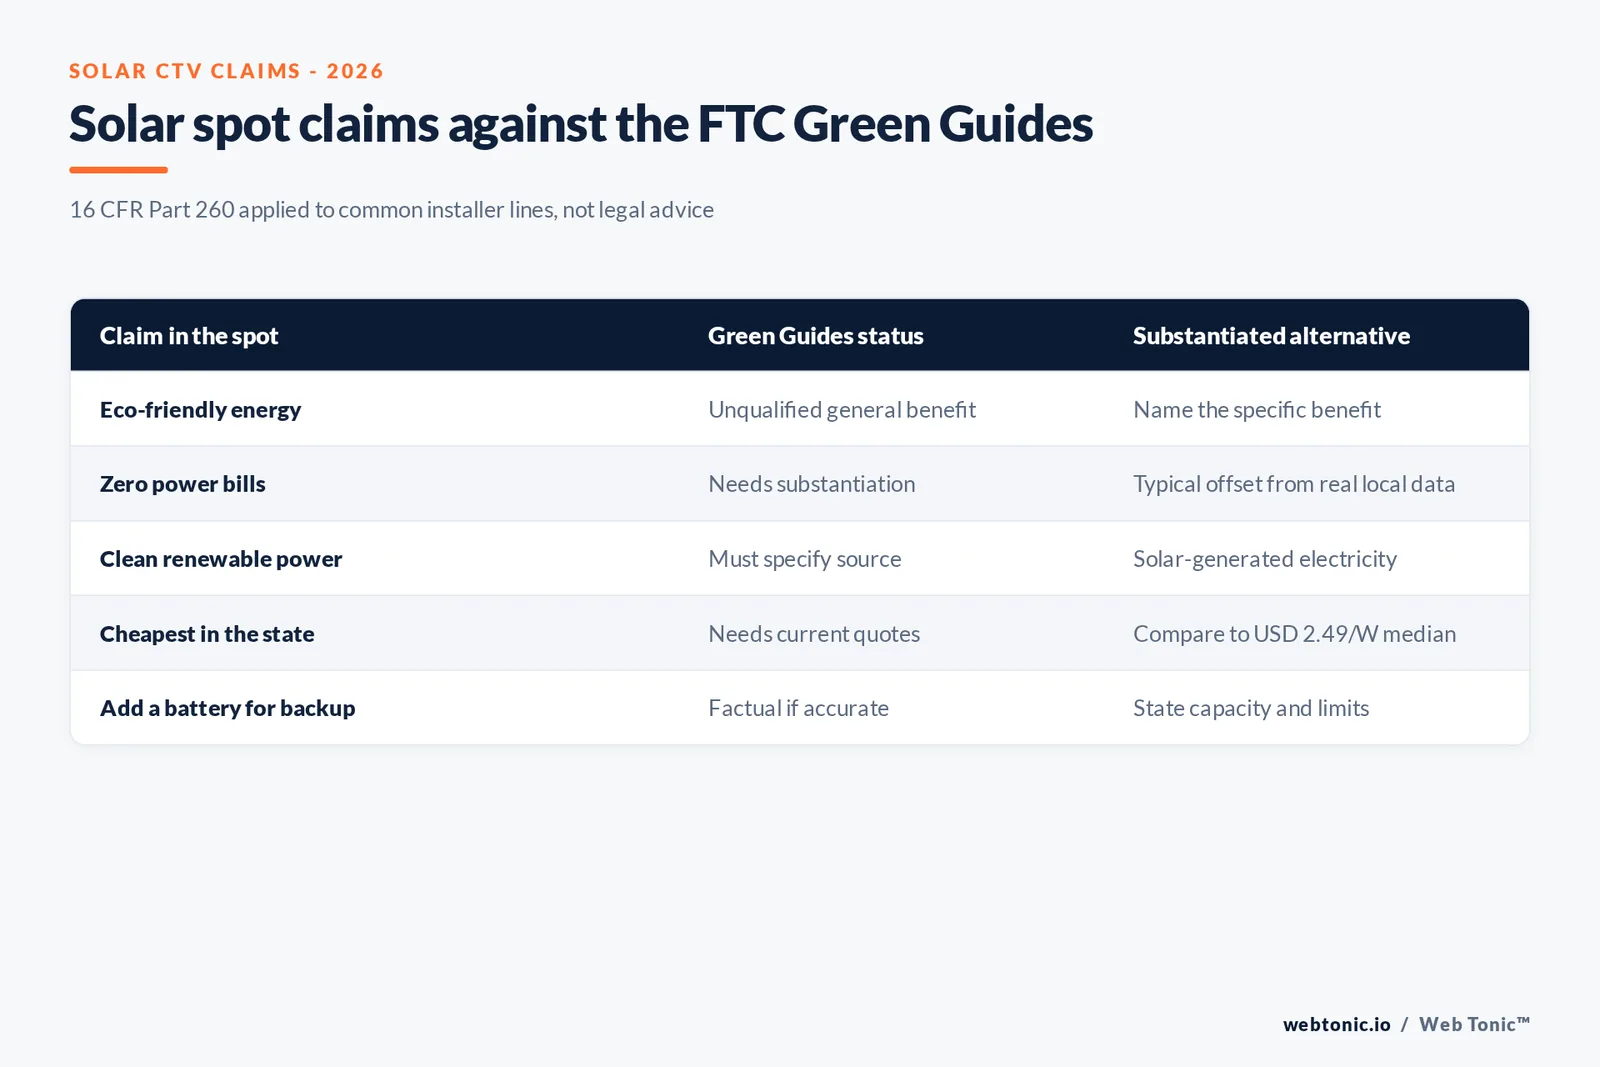
The Green Guides, 16 CFR Part 260, say unqualified general environmental benefit claims are difficult to substantiate and marketers should not make them; qualified claims must limit themselves to a specific benefit and not overstate a negligible one. Renewable energy claims should be clear and specific about the source.
Third-party ownership changes the pitch
Wood Mackenzie describes installers shifting from cash and loan sales to third-party ownership after the Section 25D credit ended for purchased systems at the end of 2025. EnergySage notes that leases and power purchase agreements remain eligible for the tax credit until 2028 and were already gaining share on its marketplace. For a CTV script, that means the offer most homeowners hear in 2026 is different from the one they heard in 2025: a monthly payment or a per-kilowatt-hour rate rather than a system price minus a 30% credit. Any spot that still references the expired homeowner credit risks being misleading under general FTC advertising principles, not just the Green Guides. Script review should check the financing claim, the savings claim and the environmental claim separately, because each draws on a different body of substantiation.
How to run a solar CTV test that answers the question
- Pick matched groups of ZIP codes; run CTV in half and hold out the rest.
- Measure quote requests and site visits per household, not completion rate.
- Aim creative at the storage retrofit audience where attachment fell, such as California at 71%.
- Buy direct or curated inventory to limit the 21% invalid-traffic exposure seen in open exchanges.
- Qualify every environmental and savings claim before the spot airs.
- Read results against the market: a flat lead count in a year forecast at -23% may be a gain.
The verdict the data supports
The data does not show that solar CTV works or fails. It shows cheaper entry points, growing local adoption, real fraud risk and a smaller market to sell into. That argues for a measured geo test rather than a brand campaign. Related reading: our CTV advertising benchmarks, solar SMS marketing statistics and solar influencer data, or ask our data intelligence team about test design.
Frequently Asked Questions
Does CTV advertising work for solar installers?
There is no published study measuring CTV results for solar companies, so nobody can show it works or fails for the category as a whole. What exists is cross-industry evidence: vendor outcome reporting from platforms such as MNTN, advertiser surveys such as Premion's 2026 study, and fraud benchmarks from Pixalate. Judge a solar test on your own quote requests from exposed ZIP codes.
How big is the residential solar market in 2026?
SEIA and Wood Mackenzie report 1,179 MWdc of residential installs in Q1 2026, up 6% year over year, and Wood Mackenzie reports 995 MWdc in Q2 2026, the segment's lowest quarter in five years. Wood Mackenzie now expects a 23% contraction for the full year after the Section 25D credit expired for purchased systems.
What can a solar ad say about savings or the environment?
The FTC Green Guides (16 CFR Part 260) call unqualified general environmental benefit claims deceptive in many cases and ask marketers to qualify claims to a specific, substantiated benefit. Renewable energy claims should be specific about the source. Savings claims need the same substantiation as any other advertising claim.
What is the minimum budget to try CTV?
Roku says USD 500 to 1,000 is enough for most first-time advertisers on Roku Ads Manager, and MNTN advertises campaigns from USD 2,000. These are vendor entry points, not solar-specific prices or recommendations.
How much CTV traffic is fraudulent?
Pixalate measured 21% invalid traffic across global open programmatic CTV in Q4 2025, from more than 7 billion transactions, and 18% for US open programmatic CTV in Q3 2025. Direct and curated deals usually carry less risk.
Sources
SEIA / Wood Mackenzie, Solar Market Insight Q2 2026
SEIA, solar and storage over 90% of new power in Q1
Wood Mackenzie, US solar Q3 2026 outlook
EnergySage, 22nd marketplace report
EnergySage, H2 2025 home energy highlights
eCFR, 16 CFR Part 260 (FTC Green Guides)
Nielsen, Q2 2026 Ad Supported Gauge
Premion / Advertiser Perceptions, 2026 CTV/OTT survey
MNTN, small business Performance TV test
MNTN Research, CTV proof-of-outcomes survey
Pixalate, Q4 2025 CTV supply chain report


