



Table of contents
US social commerce sales will cross USD 100 billion for the first time in 2026. That growth is real, but it is not free: platform take rates, affiliate commissions and the widening gap between traffic and orders all eat into the return before a social media manager sees it on a dashboard. This page prices the actual budget line, not just the top-line growth number.
Key Takeaways
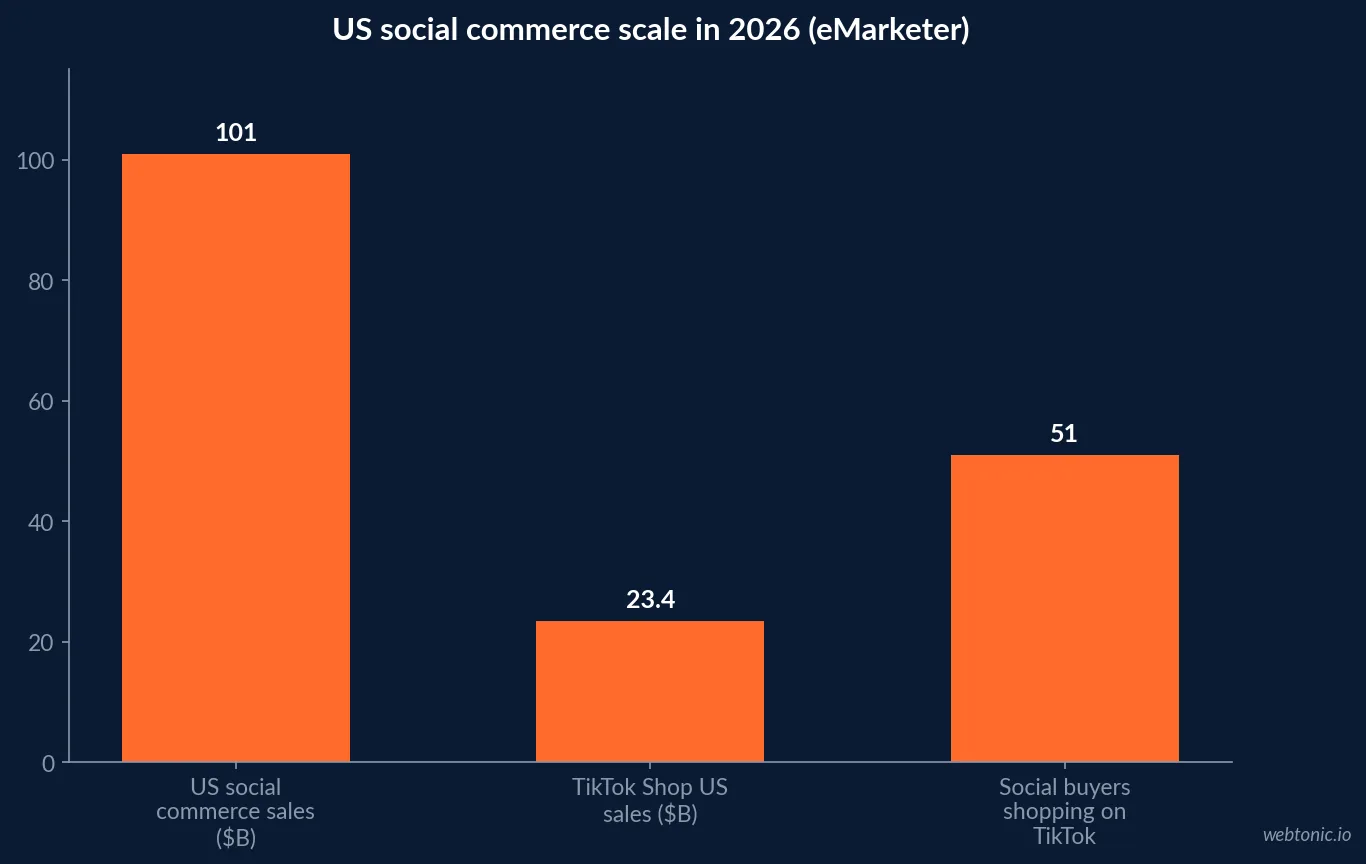
- US social commerce sales reach roughly USD 100.99 billion in 2026.
- That is up about 18% year over year.
- Social commerce is near 7.2% of total US ecommerce.
- The category will add nearly USD 50 billion more over the next three years.
- 51% of US social buyers will shop on TikTok this year.
- TikTok Shop is forecast at USD 23.41 billion in 2026 US sales.
- That surpasses Target's own online sales of USD 21.94 billion.
- TikTok's platform take rate is 6% of a sale.
- Affiliate commissions average 13.1%, ranging 5% to 30%.
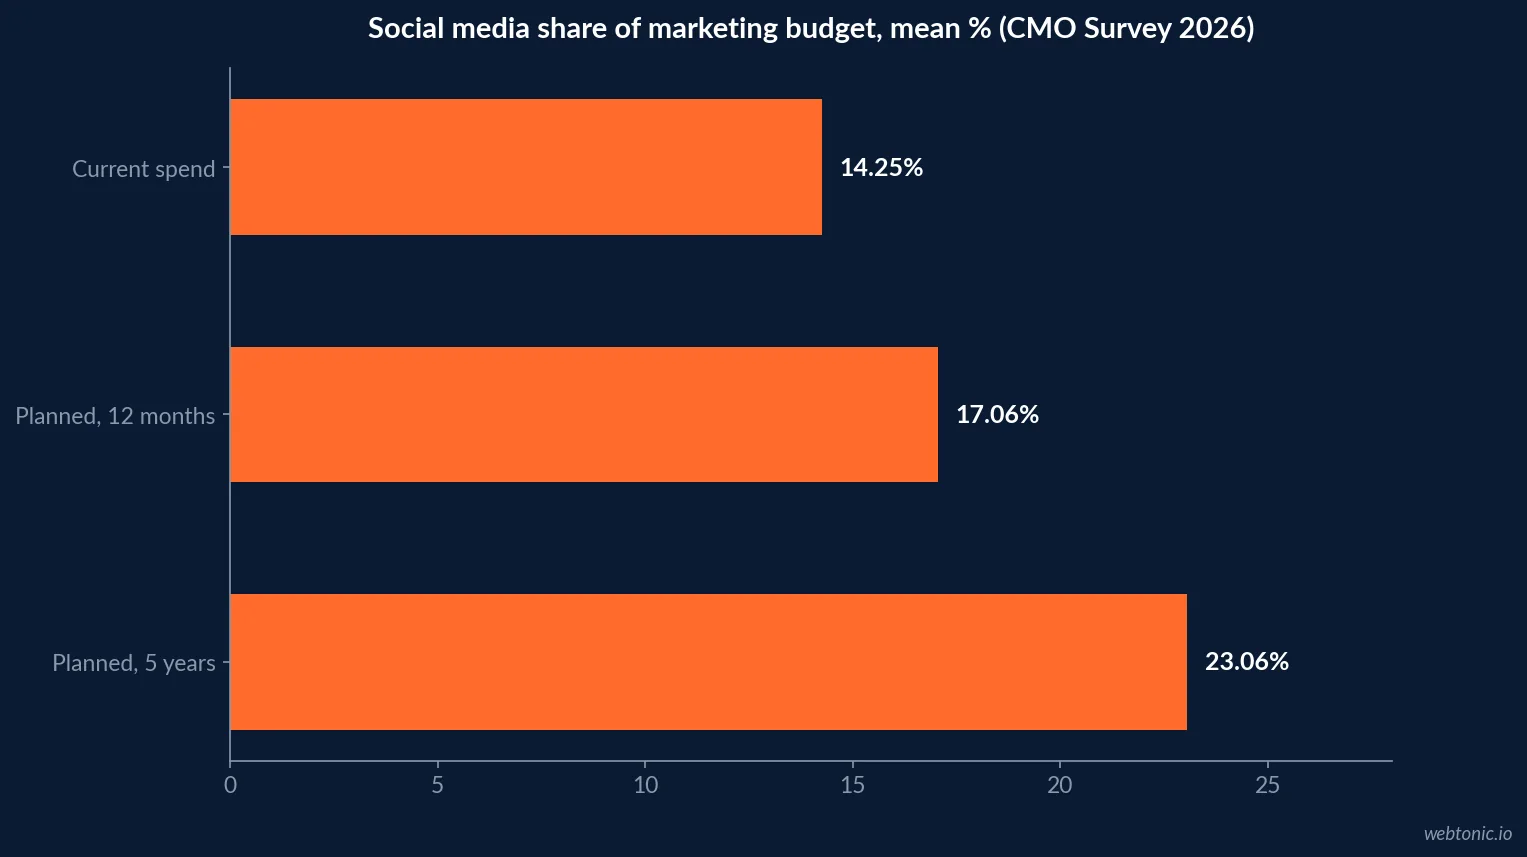
- Social media now averages 14.25% of the marketing budget.
- Marketers plan to raise that to 17.06% within 12 months.
- And to 23.06% within five years.
- 90% of US consumers already use social media.
- 65% use it somewhere in the shopping journey.
- That is up from 48% in 2020.
- US livestream ecommerce is projected near USD 68 billion.
- 2026 US holiday shoppers will spend USD 890 per person on average.
- Global digital traffic grew 18% while orders grew just 1%.
The top-line number a budget should start from
eMarketer's 2026 US Social Commerce Forecast puts US social commerce sales at roughly USD 100.99 billion this year, up about 18% year over year and close to 7.2% of total US ecommerce. eMarketer's follow-up analysis projects annual sales will grow by nearly USD 50 billion more over the next three years, driven by creators and younger shoppers turning discovery into purchase.
That growth is concentrating on specific platforms and formats, not spreading evenly, which is the first thing a budget has to account for before splitting spend by channel.
| Metric (eMarketer 2026) | Figure | What it means for a budget |
|---|---|---|
| US social commerce sales, 2026 | USD ~100.99B | First year past the USD 100B mark |
| Year-over-year growth | ~18% | Faster than total US ecommerce growth |
| Share of total US ecommerce | ~7.2% | Still a minority channel, growing share |
| Projected 3-year growth | +USD ~50B | Budget for expansion, not a plateau |
| US social buyers shopping on TikTok this year | 51% | TikTok is the platform to prioritize |
What it actually costs to sell through TikTok Shop
eMarketer's TikTok Shop analysis forecasts USD 23.41 billion in US retail ecommerce sales for TikTok Shop in 2026 - enough to surpass Target's own online sales of USD 21.94 billion. The platform's take rate is 6% per the TikTok Shop Seller Centre's own fee policy documentation, but that is not the full cost: affiliate commissions that sellers set to drive creator traffic typically run 5% to 30%, averaging 13.1%, on top of sampling, fulfillment and the elevated return rates that come with impulse-driven buying.
A social media manager pricing a TikTok Shop budget line should model total platform cost closer to 15-25% of gross sales once commission and returns are included, not the 6% headline referral fee alone.
| Cost layer (TikTok Shop) | Typical range | Source |
|---|---|---|
| Platform referral fee | 6% of sale | TikTok Shop Seller Centre policy |
| Affiliate/creator commission | 5-30%, avg 13.1% | eMarketer TikTok Shop analysis |
| Fulfillment, sampling, returns | Variable, elevated vs. web | eMarketer TikTok Shop analysis |
| Modeled all-in platform cost | ~15-25% of gross sales | Sum of the above |
How much of the marketing budget should be social
The CMO Survey's 2026 topline report, based on 163 marketing leaders, finds current social media spend averaging 14.25% of the marketing budget (median 10%), with marketers planning to raise that to a mean of 17.06% (median 15%) over the next 12 months and to 23.06% (median 20%) over five years. Social shopping content should draw from that same growing pool rather than compete against it as a separate initiative, since the same post now often carries both the awareness message and the checkout link.
| Time horizon (CMO Survey 2026) | Mean % of budget | Median % of budget |
|---|---|---|
| Current social media spend | 14.25% | 10% |
| Planned in next 12 months | 17.06% | 15% |
| Planned over next 5 years | 23.06% | 20% |
Why shoppers actually buy inside the feed
Coresight Research found in its US survey work that 90% of US consumers use social media and 65% use it somewhere in the shopping process - discovering, researching or buying - up 8 percentage points from 48% in March 2020. Coresight projects the US livestreaming ecommerce market will reach roughly USD 68 billion, the fastest-growing but still smallest slice of the category.
That adoption curve argues for treating livestream and shoppable video as an emerging test line, not the default format, until a specific catalog category proves it converts.
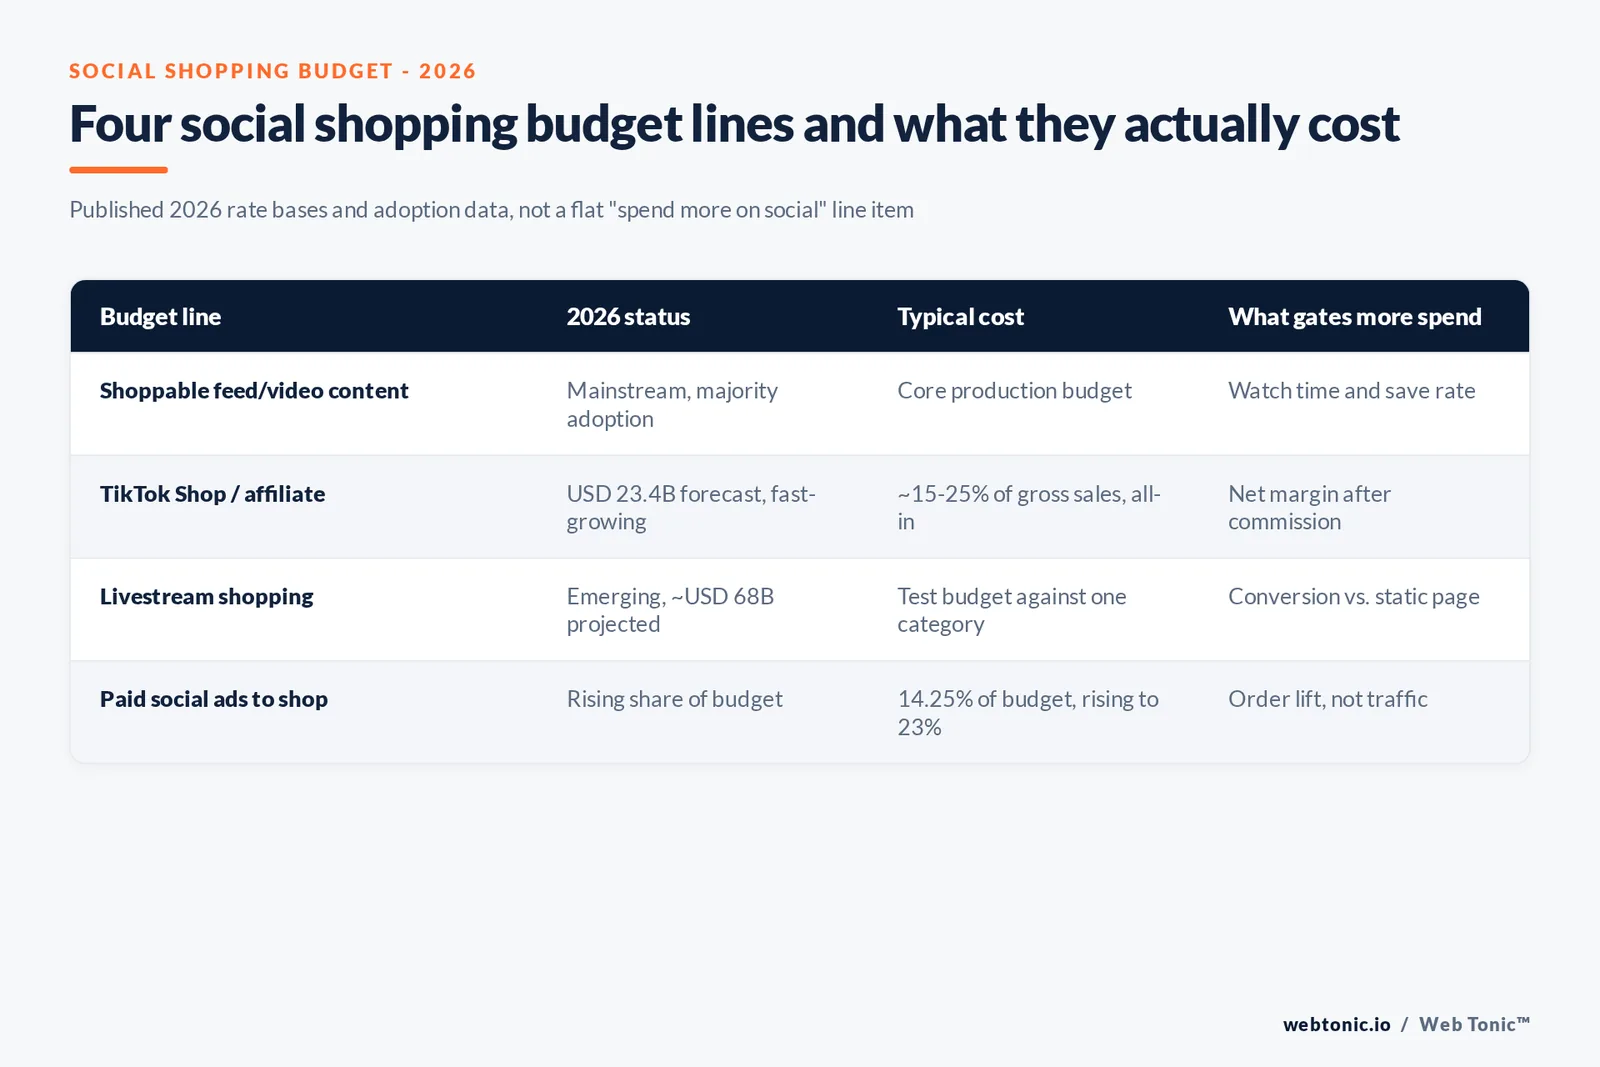
| Format | 2026 status | Budget guidance |
|---|---|---|
| Shoppable feed/video posts | Mainstream, majority adoption | Core budget, ongoing production |
| TikTok Shop / affiliate | Fast-growing, 6%+ take rate | Model take rate before scaling spend |
| Livestream shopping | Emerging, ~USD 68B projected | Test against one category first |
| Paid social ads to shop | Rising share of budget | Track against order lift, not traffic |
The traffic-to-order gap a budget has to plan for
Salesforce's 2026 holiday retail data found global digital traffic grew 18% in a recent quarter while order volume rose just 1%, with mobile now carrying roughly three-quarters of online browsing. More social reach does not automatically convert to more baskets. NRF forecasts total 2026 US retail sales growing 4.4% to USD 5.6 trillion, and its holiday data shows shoppers budgeting an average USD 890 per person, a ceiling social content competes for rather than expands.
The budget implication: pair any increase in social content spend with a parallel line for checkout and page-speed fixes, or the extra traffic simply stalls before the order confirms. Web Tonic's own performance creative practice treats that pairing as non-negotiable in any social shopping plan.
Why creator-made content is pulling the budget
Deloitte's 2026 Digital Media Trends survey found 32% of consumers now say social media content is more relevant to them than traditional media content, and 33% say they feel a stronger personal connection to social media creators than to TV personalities or actors. That is the demand-side reason social shopping content increasingly looks like creator video rather than a studio product shot, and it is also why the eMarketer TikTok Shop analysis above treats affiliate commission - the fee that pays creators - as a structural cost of the channel, not an optional add-on.
| Creator-relevance signal (Deloitte 2026) | Figure |
|---|---|
| Say social content is more relevant than traditional media | 32% |
| Feel a stronger connection to creators than TV personalities | 33% |
How much of the budget AI is starting to absorb
The CMO Survey's 2026 highlights report found AI use in marketing has more than tripled since 2022, and companies now project AI will account for more than half of all marketing activities within three years. The same survey found companies are spending almost 60% of their growth budgets on market-penetration strategies - selling more of existing products to existing customers - rather than new-customer acquisition, a defensive posture that competes directly with new social shopping spend for the same dollars.
A social shopping budget proposal in 2026 has to compete against that inward-facing default, which is why pairing the ask with a retention or loyalty angle - not pure new-customer reach - tends to clear approval faster. Our growth marketing practice frames social shopping tests this way by default, and a short scoping call is usually enough to map which existing-customer segment to test it against first.
| Marketing budget context (CMO Survey 2026) | Figure |
|---|---|
| Growth in AI use in marketing since 2022 | >3x |
| Projected AI share of marketing activities, 3-year horizon | >50% |
| Share of growth budget on market penetration (existing customers) | ~60% |
| Marketing training budget, current | 3.8% of spend |
Holiday concentration risk in a social shopping budget
Social shopping budgets do not spread evenly across the year, and neither does retail overall. NRF's 2025 winter holiday data recorded 80.3 million in-store and 85.7 million online shoppers on Black Friday alone, with 75.9 million online shoppers on Cyber Monday and average per-person holiday spend of USD 890. NRF's own 2026 forecast projects total US retail sales growing 4.4% to USD 5.6 trillion for the year. A social shopping budget that front-loads content and ad spend into that five-day window, rather than spreading it evenly, is following where the transaction volume already concentrates.
The affiliate commission structure behind that volume is also moving. eMarketer's TikTok Shop analysis notes average affiliate commissions rose to 13.1% from 12.3% the prior year, per Momentum Works data, as TikTok consolidates ad and shopping campaigns into its automated GMV Max tool - a signal that the cost of creator-driven distribution is still climbing, not settling.
Frequently Asked Questions
How much will US shoppers spend on social commerce in 2026?
eMarketer forecasts roughly USD 100.99 billion in US social commerce sales in 2026, up about 18% year over year and near 7.2% of total US ecommerce. That is the first year the category has crossed USD 100 billion, and eMarketer projects it will add close to another USD 50 billion over the following three years.
What percentage of a marketing budget should go to social media?
The CMO Survey's 2026 topline data, from 163 marketing leaders, puts current social media spend at a mean of 14.25% of the marketing budget (median 10%), rising to a mean of 17.06% (median 15%) planned for the next 12 months and 23.06% (median 20%) over five years. Social shopping specifically should be budgeted as a growing slice of that line, not a separate pool, since the same content increasingly carries both the awareness and the checkout function.
What does TikTok Shop actually take from a sale?
eMarketer's TikTok Shop analysis reports a platform take rate of 6% on top of affiliate commissions that typically run 5% to 30% and average 13.1%, once sampling, fulfillment and elevated return rates from impulse buying are added. A seller budgeting a social shopping line should model total platform cost closer to 15-25% of gross sales, not the headline 6% referral fee alone.
Is livestream shopping worth budgeting for yet?
It is the fastest-growing but still smallest format. Coresight Research's 2026 projections put US livestreaming ecommerce on track for roughly USD 68 billion, built on a base where 90% of US consumers already use social media and 65% use it somewhere in the shopping journey, up from 48% in 2020. Budget it as a test line against a specific catalog category before shifting core content budget toward it.
Does more social traffic actually mean more orders?
Not automatically. Salesforce's 2026 holiday retail data found global digital traffic grew 18% in a recent quarter while order volume rose just 1%, with mobile now carrying three-quarters of online browsing. Budget for conversion-path fixes - checkout friction, page speed, payment options - alongside any increase in social content spend, or the extra traffic simply will not convert.
Sources
eMarketer - US Social Commerce Forecast 2026
eMarketer - The Next Era of Social Commerce
eMarketer - FAQ on TikTok Shop
TikTok Shop Seller Centre - Platform Commission Fee policy
The CMO Survey - 2026 Topline Report
Coresight Research - Social Commerce Success
National Retail Federation - 2026 forecasts
Salesforce - 2026 Holiday Retail Predictions
Deloitte - 2026 Digital Media Trends


