



Table of contents
Social captured USD 117.7 billion of US digital ad revenue in 2025, 40.0% of the total and the fastest-growing category IAB tracks. This page ranks the networks by revenue, growth and unit cost so a media buyer spanning platforms has one reference instead of five separate benchmark pages, each built by a different vendor with a different methodology and a different reason to make its own platform look strongest.
Key Takeaways
- Social ad revenue reached USD 117.7 billion in 2025.
- That is 40.0% of all US digital ad revenue, the largest category.
- Social grew 32.6% year over year, the fastest of any category tracked.
- Total US digital ad revenue hit USD 294.6 billion in 2025.
- Search ad revenue reached USD 114.2 billion, close behind social.
- Display advertising grew just 9.8%, the slowest of the five categories.
- Meta's Q2 2026 ad revenue alone was USD 59.4 billion, up 27%.
- US social network ad spend will exceed USD 121 billion in 2026.
- Social will claim more than 30% of all ad spend by 2027.
- LinkedIn's CPM runs USD 25 to USD 45, the highest of the mainstream networks.
- TikTok's CPM runs USD 4 to USD 10, among the lowest.
- Google Search's CPC of USD 5.42 is still the benchmark buyers compare against.
- TikTok Shop generated USD 50.3 billion in GMV in the first half of 2026.
- Commerce media revenue grew 18.0% to USD 63.4 billion in 2025.
- Programmatic advertising rose 20.5% to USD 162.4 billion.
The category, ranked against the rest of digital
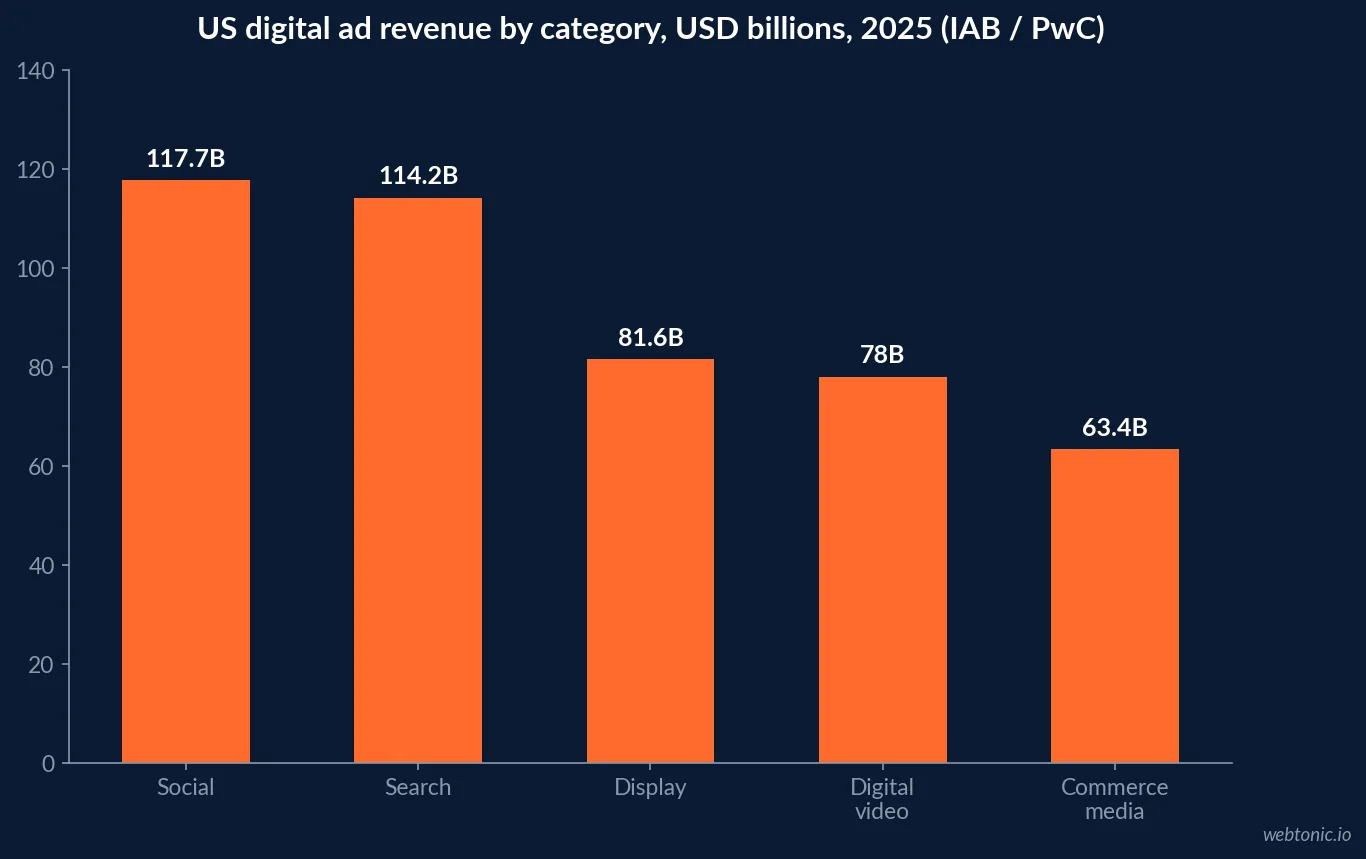
IAB's 2025 Internet Advertising Revenue Report, produced with PwC, puts total US digital ad revenue at USD 294.6 billion, up 13.9% year over year. Social leads every category at USD 117.7 billion (40.0%), ahead of search at USD 114.2 billion (38.8%), display at USD 81.6 billion (27.7%), digital video at USD 78.0 billion (26.5%) and commerce media at USD 63.4 billion (21.5%).
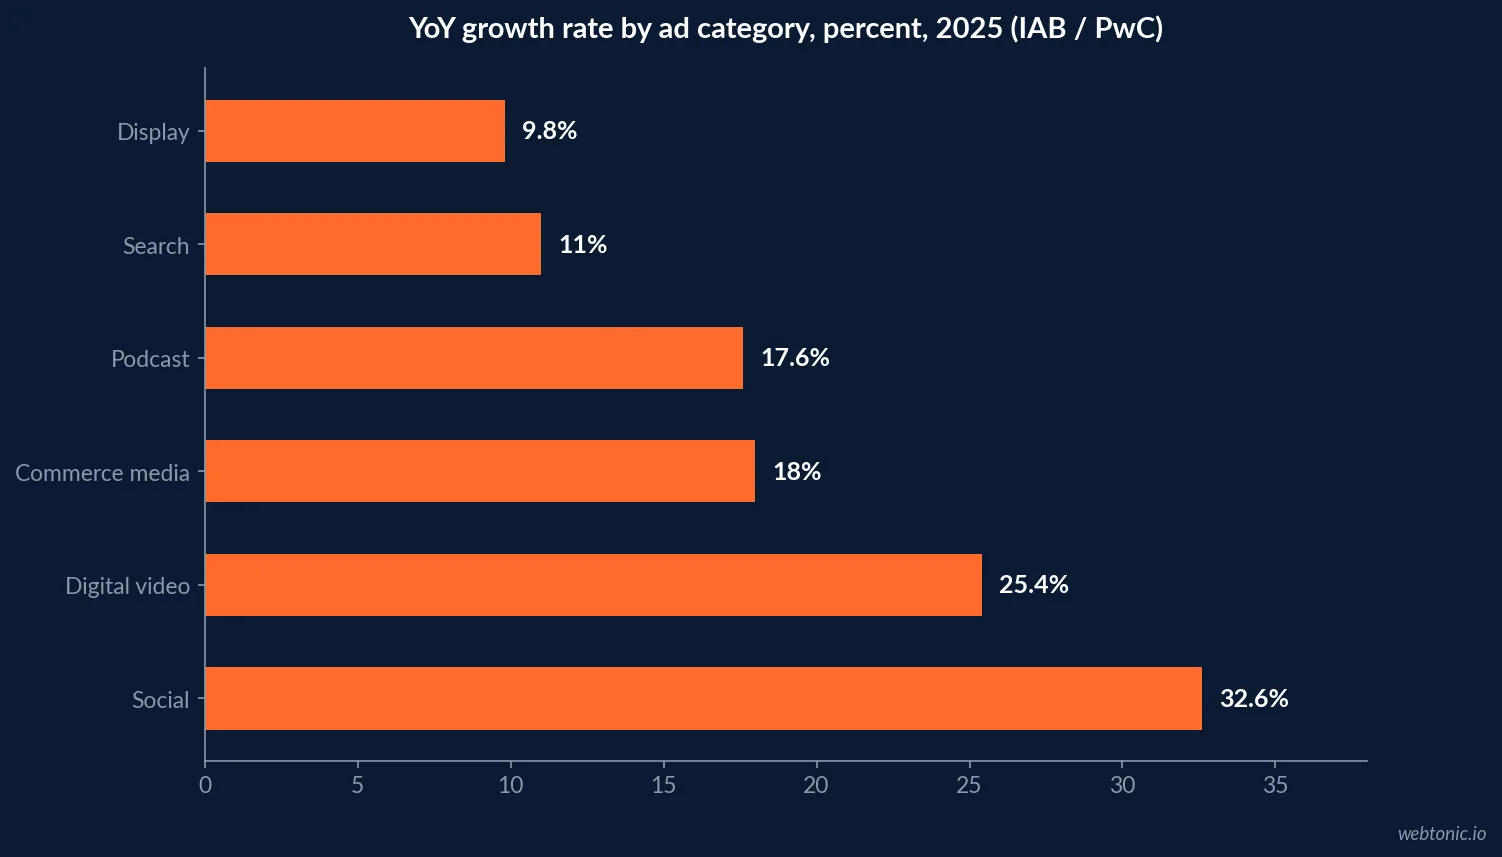
Social's growth rate is what separates it from the rest of the ranking: at 32.6% year over year, it grew more than three times faster than display's 9.8%.
| Ad category (2025) | Revenue | YoY growth | Share of total |
|---|---|---|---|
| Social | USD 117.7B | 32.6% | 40.0% |
| Search | USD 114.2B | 11.0% | 38.8% |
| Display | USD 81.6B | 9.8% | 27.7% |
| Digital video | USD 78.0B | 25.4% | 26.5% |
| Commerce media | USD 63.4B | 18.0% | 21.5% |
| Podcast | USD 2.9B | 17.6% | 1.0% |
Growth rate tells a different story than revenue size
Ranked by dollars, social barely edges out search. Ranked by growth, the gap widens sharply: social's 32.6% year-over-year increase outpaces digital video's 25.4%, commerce media's 18.0%, search's 11.0% and display's 9.8% by a wide margin. Programmatic advertising overall, which spans several of these categories, rose 20.5% to USD 162.4 billion.
A category growing three times faster than the slowest-moving format in the same report is the argument for treating social as the growth engine of a 2026 media plan, not a fixed line alongside the rest.
| Category | YoY growth rate | Rank by growth |
|---|---|---|
| Social | 32.6% | 1st |
| Digital video | 25.4% | 2nd |
| Commerce media | 18.0% | 3rd |
| Podcast | 17.6% | 4th |
| Search | 11.0% | 5th |
| Display | 9.8% | 6th |
Where the revenue actually concentrates
Meta remains the single largest company inside the social category. Its own Q2 2026 results reported Family of Apps ad revenue of USD 59.4 billion for the quarter alone, up 27% year over year - more than half of the entire category's full-year 2025 total, in three months. eMarketer's H2 2026 forecast names Meta and TikTok specifically as the two platforms driving continued spending growth into the rest of the category.
For a buyer weighing where to concentrate a first dollar, the revenue concentration alone argues for starting with Meta and TikTok before spreading budget across smaller networks.
| Company / platform | 2026 ad revenue signal | YoY change | Source |
|---|---|---|---|
| Meta (Family of Apps) | USD 59.4B in Q2 2026 alone | +27% | Meta Q2 2026 results |
| Full social category, 2025 | USD 117.7B for the year | +32.6% | IAB/PwC |
| US social spend, 2026 forecast | USD 121B+ | Continued growth | EMARKETER |
Unit cost by network
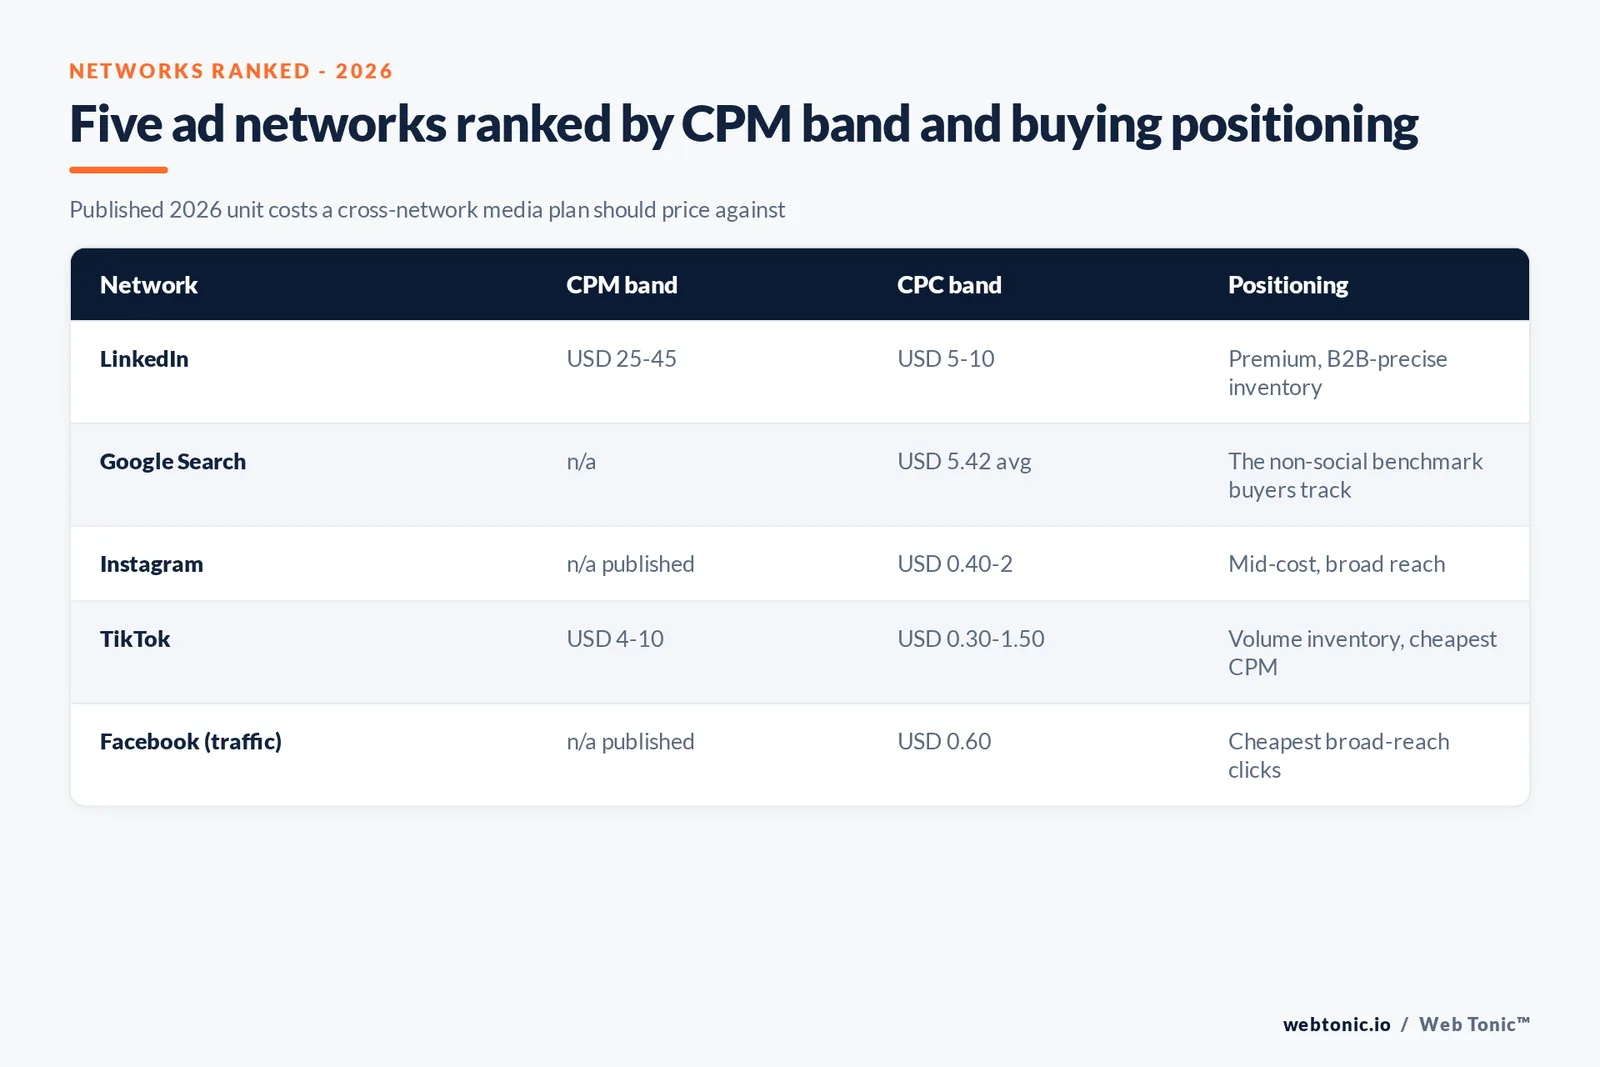
WordStream's 2026 online advertising cost guide lays out the unit economics buyers actually plan against: LinkedIn CPM of USD 25 to USD 45 and CPC of USD 5 to USD 10, TikTok CPM of USD 4 to USD 10 with CPC of USD 0.30 to USD 1.50, Instagram CPC of USD 0.40 to USD 2, and Facebook traffic CPC around USD 0.60 per WordStream's 2026 Facebook Ads Benchmarks. Google Search, the non-social comparison point most buyers already track, averages USD 5.42 CPC.
Networks earning the highest CPM are pricing scarcity and audience precision (LinkedIn's B2B base); networks with the lowest CPM are pricing volume (TikTok's short-form feed).
| Network | CPM range | CPC range | Positioning |
|---|---|---|---|
| USD 25 - 45 | USD 5 - 10 | Premium, B2B-precise inventory | |
| Google Search (comparison) | n/a | USD 5.42 avg | The non-social benchmark buyers track |
| n/a published | USD 0.40 - 2 | Mid-cost, broad reach | |
| TikTok | USD 4 - 10 | USD 0.30 - 1.50 | Volume inventory, cheapest CPM |
| Facebook (traffic) | n/a published | USD 0.60 | Cheapest broad-reach clicks |
Commerce is starting to blur the ad-revenue line
TikTok Shop's global gross merchandise value reached an estimated USD 50.3 billion in the first half of 2026 alone, up 92% year over year, per Momentum Works data reported by Tubefilter. That figure sits outside the IAB's advertising revenue line entirely - it is commerce, not media spend - but it draws on the same in-feed inventory and increasingly the same budget conversation as paid social.
IAB's own commerce media category, growing 18.0% to USD 63.4 billion, is the formal accounting of that shift; TikTok Shop's GMV is the informal, faster-moving edge of it.
Building a cross-network media plan from these numbers
Start with the two networks proven to concentrate the most revenue and growth - Meta and TikTok - then layer in LinkedIn for B2B precision where the higher CPM is justified by audience quality. Price each network against its own published CPM or CPC band rather than a blended average, since the five-times spread between TikTok and LinkedIn CPMs means a single blended number hides more than it reveals.
Our performance creative practice builds that network-by-network split from a client's own funnel data, and our guide to evaluating a paid social partner covers what to check before handing a network's budget to an outside team.
Programmatic: the plumbing behind most of these numbers
Most of the revenue in this ranking now moves through automated buying rather than direct insertion orders. IAB and PwC's report puts programmatic advertising at USD 162.4 billion in 2025, up 20.5% and gaining USD 27.6 billion in new spend - a figure that spans social, display and video inventory bought through real-time auctions. The report frames this scale as the groundwork for agentic, AI-driven media buying becoming the default rather than the exception across the networks ranked above.
For a buyer, this matters operationally: the CPM and CPC bands in this article are auction outcomes, not rate cards, and they will keep moving with the same automation that produced the 20.5% growth figure.
| Buying mechanism (2025) | Revenue | YoY growth | Source |
|---|---|---|---|
| Programmatic (all formats) | USD 162.4B | 20.5% | IAB / PwC |
| Social (mostly programmatic) | USD 117.7B | 32.6% | IAB / PwC |
| Commerce media | USD 63.4B | 18.0% | IAB / PwC |
Consolidation: fewer companies capture most of the growth
IAB's report notes that the top 10 global media companies continue to hold the majority of internet advertising revenue share, a trend the report attributes to deeper first-party data, integrated commerce ecosystems and end-to-end buying environments that smaller platforms cannot easily replicate. Meta's single-quarter USD 59.4 billion in ad revenue is the clearest illustration inside the social category specifically - a handful of platforms are absorbing most of a market that is nominally described as having dozens of participants.
For a media plan, that consolidation is also a negotiating reality: the largest platforms have the least incentive to compete on price, which is part of why LinkedIn's premium CPM persists despite cheaper alternatives elsewhere in the category.
How the ranking could shift into 2027
eMarketer's forecast that social will claim more than 30% of all ad spend by 2027 assumes the current growth differential holds - social compounding at roughly three times display's rate for another year would widen the gap between the top and bottom of this ranking further still. The report's own framing names AI-driven automation and deeper commerce integration as the two forces most likely to sustain that pace, both of which favour platforms already scaled enough to invest in the infrastructure - reinforcing the consolidation trend already visible in the 2025 numbers.
A media plan built today should assume the CPM and CPC bands above keep drifting in the same direction they moved between 2025 and 2026, and revisit the network mix at least once a quarter rather than locking in a single annual split.
| Forecast signal (2026-2027) | Direction | Source |
|---|---|---|
| Social's share of all ad spend | Rising toward 30%+ | EMARKETER |
| Meta and TikTok ad revenue | Continued above-category growth | EMARKETER |
| Platform revenue concentration | Increasing | IAB / PwC |
Building the plan from this ranking
Use the revenue and growth tables to decide which networks deserve a growing share of next year's budget, and the CPM/CPC table to decide how far each dollar stretches once it is allocated. The two answers are not always the same platform: Meta and TikTok win on growth and volume, while LinkedIn wins on precision for a B2B audience willing to pay a premium CPM for it. A cross-network plan built on this ranking should fund at least the two highest-growth platforms before topping up a specialist network like LinkedIn.
Our paid media team builds that allocation model from a client's own historical performance rather than the published category averages alone.
Frequently Asked Questions
How big is the social network advertising market in 2026?
IAB and PwC's Internet Advertising Revenue Report puts 2025 social ad revenue at USD 117.7 billion, 40.0% of all US digital ad revenue and the largest single category. eMarketer's H2 2026 forecast projects US advertisers will spend more than USD 121 billion on social networks in 2026 alone, and expects social to claim more than USD 3 of every USD 10 spent on advertising by 2027.
Which network generates the most ad revenue?
Meta remains the largest single company inside the category. Meta's own Q2 2026 results reported USD 59.4 billion in Family of Apps ad revenue for the quarter alone, up 27% year over year - a single quarter larger than most competing networks' full-year figures.
Is CPM or CPC the better way to compare networks?
CPM suits awareness buys and CPC suits performance buys, and the two rank networks differently. On WordStream's 2026 data, LinkedIn has the highest CPM at USD 25 to USD 45 but a mid-range CPC; TikTok has one of the lowest CPMs, in the USD 4 to USD 10 range, reflecting cheaper but higher-volume inventory. Buy on whichever metric matches the campaign's actual objective.
How fast is social ad spend still growing compared with other formats?
Faster than every other category IAB tracks. Social grew 32.6% year over year in 2025 against 25.4% for digital video, 18.0% for commerce media, 11.0% for search and 9.8% for display - the widest gap recorded since the report started separating these categories.
Does commerce spending inside social networks count separately?
Increasingly, yes. TikTok Shop alone generated an estimated USD 50.3 billion in global gross merchandise value in the first half of 2026, according to Momentum Works data - a figure tracked separately from the platform's advertising revenue line, and one that is starting to blur where media spend ends and commerce spend begins.
Sources
IAB / PwC - 2025 Internet Advertising Revenue Report
EMARKETER - US Social Network Ad Spending, H2 2026
Meta - Meta Reports Second Quarter 2026 Results
WordStream - The comprehensive guide to online advertising costs, 2026
Tubefilter - TikTok Shop GMV data from Momentum Works, 2026


