Table of contents

Social ad revenue reached USD 117.7 billion in 2025, a 32.6% jump that made it the single largest category of digital advertising. That is the market a social media manager is budgeting into this year, and the number to defend against a finance team is rarely a flat percentage - it is a blend of what similar firms spend and what a click actually costs on the platforms in the plan.
Key Takeaways
- Social ad revenue hit USD 117.7 billion in 2025.
- That is 40.0% of all digital ad revenue, the largest category.
- Social grew 32.6% year over year, adding USD 29.0 billion.
- Total digital ad revenue reached USD 294.6 billion in 2025.
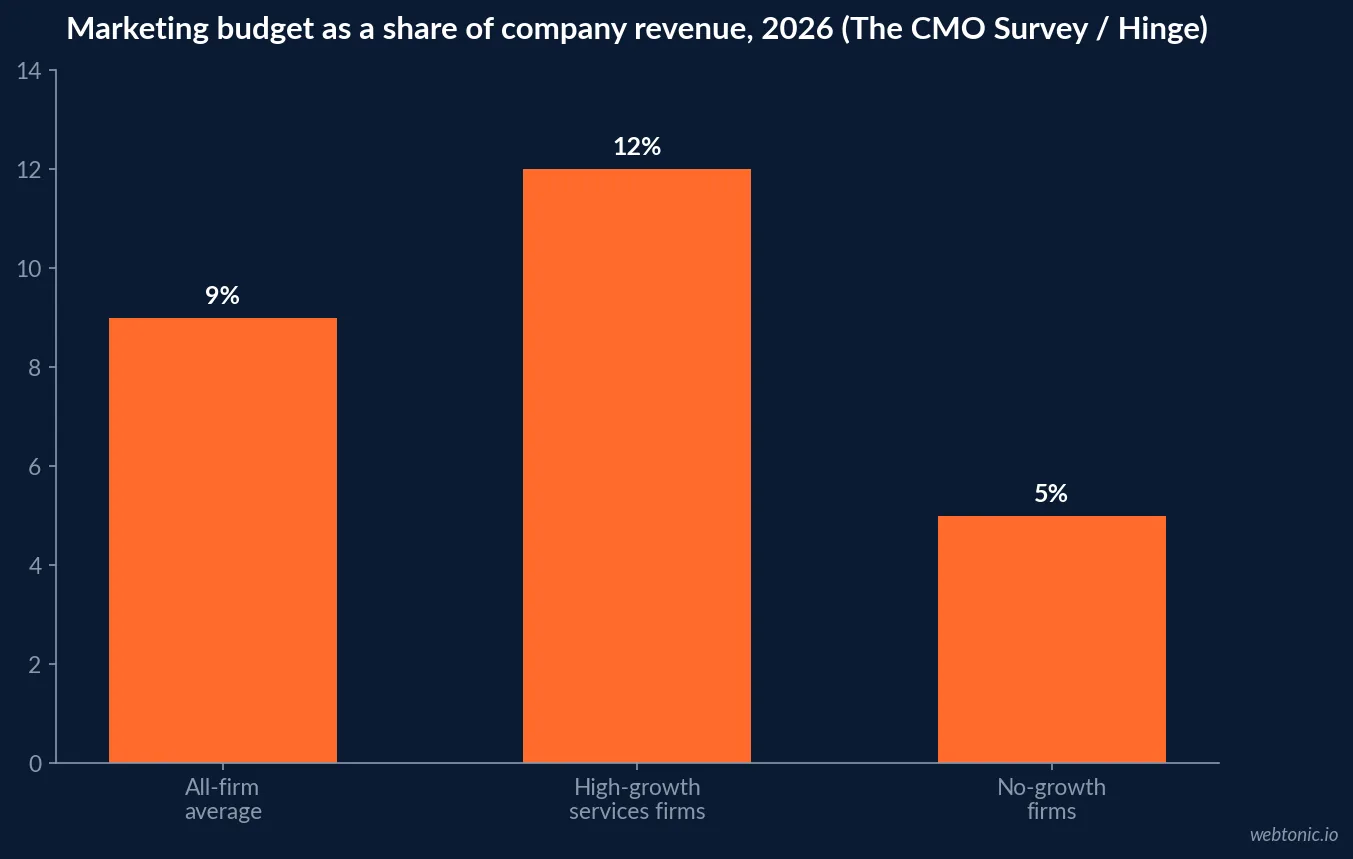
- Marketing budgets sit at 9.0% of company revenue on average.
- High-growth services firms spend 12.0% of revenue on marketing.
- No-growth firms spend just 5.0% of revenue on marketing.
- Overall marketing spend growth is only 1.7% year over year.
- Marketing headcount growth is down 50% year over year.
- Facebook traffic clicks average USD 0.60, down 14.29% year over year.
- Facebook lead clicks average USD 1.80, three times the traffic rate.
- Facebook cost per lead sits at USD 27.39.
- TikTok clicks run USD 0.30 to USD 1.50.
- Instagram clicks run USD 0.40 to USD 2.
- LinkedIn clicks run USD 5 to USD 10, the most expensive mainstream platform.
- US social network ad spending will pass USD 121 billion in 2026.
- Social will claim more than USD 3 of every USD 10 in ad spend by 2027.
The market a social budget sits inside
Start with the category, not the platform. IAB's 2025 Internet Advertising Revenue Report, produced with PwC, puts total US digital ad revenue at USD 294.6 billion for 2025, up 13.9% year over year. Social took USD 117.7 billion of that, 40.0% of total digital ad revenue and the single largest category ahead of search at USD 114.2 billion (38.8%).
A manager asking for budget can point to that share directly: social is not a discretionary add-on line anymore, it is the category the rest of digital advertising is measured against.
| Ad category (2025, IAB/PwC) | Revenue | YoY growth | Share of digital ad revenue |
|---|---|---|---|
| Social | USD 117.7B | 32.6% | 40.0% |
| Search | USD 114.2B | 11.0% | 38.8% |
| Display | USD 81.6B | 9.8% | 27.7% |
| Digital video | USD 78.0B | 25.4% | 26.5% |
| Commerce media | USD 63.4B | 18.0% | 21.5% |
The budget envelope the ad line has to fit inside
Category growth does not mean the whole marketing budget is growing. The CMO Survey 2026 puts marketing spend at 9.0% of company revenue and 9.6% of firm budgets, with overall spend growth of only 1.7% and marketing headcount growth down 50% year on year. Hinge's 2026 High Growth Study shows the gap by outcome: high-growth professional services firms spend 12.0% of revenue on marketing against just 5.0% for firms with no growth.
That means a bigger paid social line in most 2026 plans is funded by cutting something else, not by a fresh allocation - so the case for the spend has to compete against other channels on the same flat budget.
| Budget benchmark (2026) | Figure | Source | What it means for a social budget |
|---|---|---|---|
| All-firm marketing spend | 9.0% of revenue | The CMO Survey | The starting envelope |
| High-growth firms' spend | 12.0% of revenue | Hinge 2026 | The upside case worth arguing |
| No-growth firms' spend | 5.0% of revenue | Hinge 2026 | The floor a cut budget lands on |
| Marketing spend growth | 1.7% year over year | The CMO Survey | Little new money is arriving |
| Marketing headcount growth | Down 50% year over year | The CMO Survey | Paid media covers gaps in headcount |
What a click actually costs, platform by platform
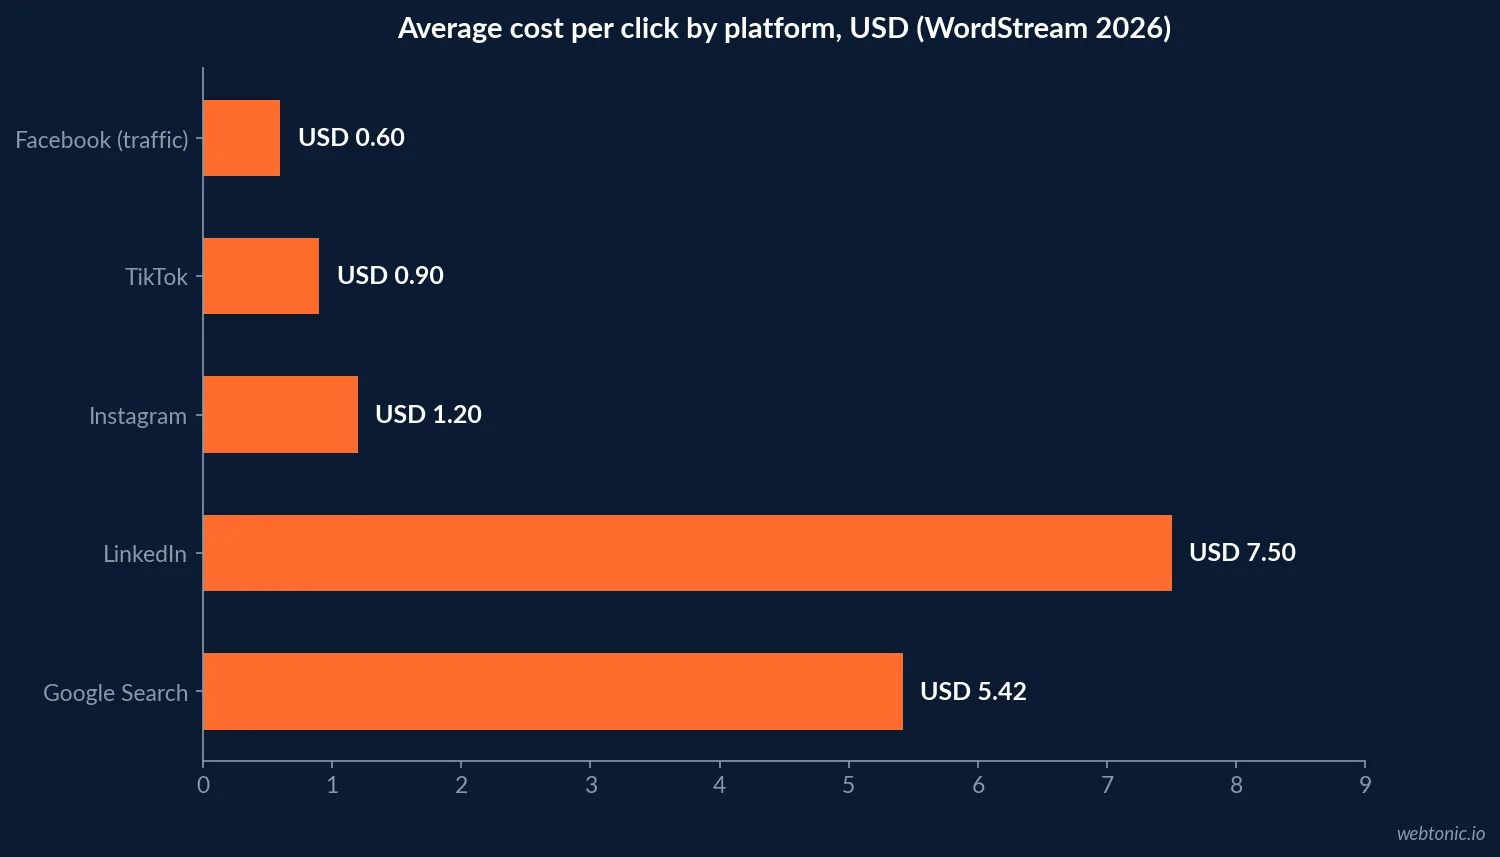
Once the envelope is set, the platform mix decides how far it stretches. WordStream's 2026 online advertising cost guide puts Facebook ads CPC at USD 0.70 on the older baseline and Facebook ads CPL at USD 27.66, Instagram CPC between USD 0.40 and USD 2, TikTok CPC between USD 0.30 and USD 1.50 with CPV between USD 0.01 and USD 0.07, and LinkedIn CPC between USD 5 and USD 10 with CPM between USD 25 and USD 45.
Google Search sits above all of them at USD 5.42 average CPC, which is the number most finance teams already anchor to - use it to show that even LinkedIn's premium rate is cheaper than the search line already in the budget.
| Platform | Typical CPC | Other unit cost | Best budget use |
|---|---|---|---|
| Google Search | USD 5.42 | CPL USD 66.69 | Bottom-funnel intent, not a social line |
| USD 5 - 10 | CPM USD 25 - 45 | B2B awareness and lead capture | |
| USD 0.40 - 2 | CPE USD 0.03 - 0.08 | Mid-funnel engagement and retargeting | |
| Facebook (traffic) | USD 0.60 | CPL USD 27.39 | Cheapest broad-reach testing |
| TikTok | USD 0.30 - 1.50 | CPV USD 0.01 - 0.07 | Volume awareness and creative testing |
The number a fresher benchmark just moved
WordStream's 2026 Facebook Ads Benchmarks, drawn from roughly 1,800 US campaigns and reported by PPC Land, updates the picture further: median traffic-campaign click-through rate is now 1.93%, up 12.87% year over year, while median cost per click fell to USD 0.60, down 14.29% from USD 0.70. Lead campaigns moved less: median click-through rate 2.70%, cost per click USD 1.80, and cost per lead essentially flat at USD 27.39 against USD 27.66 a year earlier.
A lead-objective click on the same platform costs roughly three times a traffic-objective click, because the auction is pricing a form fill rather than a visit - budget the two goals as separate line items, not one blended average.
Where the growth is still coming from
eMarketer's H2 2026 forecast projects US advertisers will spend more than USD 121 billion on social network ads in 2026, driven especially by Meta and TikTok, and expects social networks to claim more than USD 3 of every USD 10 spent on advertising of any kind by 2027. That is not a niche channel's growth curve - it is the channel most of the incremental ad economy is routing through.
For a manager, that forecast is the strongest argument for protecting the social line even in a flat overall budget: the category is absorbing share from other media, not just growing alongside them.
| Forecast (2026-2027) | Figure | Source | Budget implication |
|---|---|---|---|
| US social ad spend, 2026 | USD 121B+ | eMarketer | The category keeps growing |
| Social share of all ad spend, 2027 | >30% | eMarketer | Reallocation, not just growth |
| Social ad revenue, 2025 | USD 117.7B | IAB/PwC | Already the largest digital category |
| Digital video, 2025 | USD 78.0B | IAB/PwC | The nearest format competing for budget |
Sizing the number without a template
A defensible 2026 social ad budget starts from the revenue envelope The CMO Survey publishes, not a rule-of-thumb percentage borrowed from a blog post. Take the firm's marketing budget as a share of revenue, decide what portion of that should route to paid social against the other channels already funded, and then price the platform mix using the CPC and CPL data above rather than a single vendor's number.
Our performance creative team builds that platform mix from a client's own auction data once the envelope is set, so the plan is priced against real cost per result rather than a published median.
Testing budget versus scaling budget
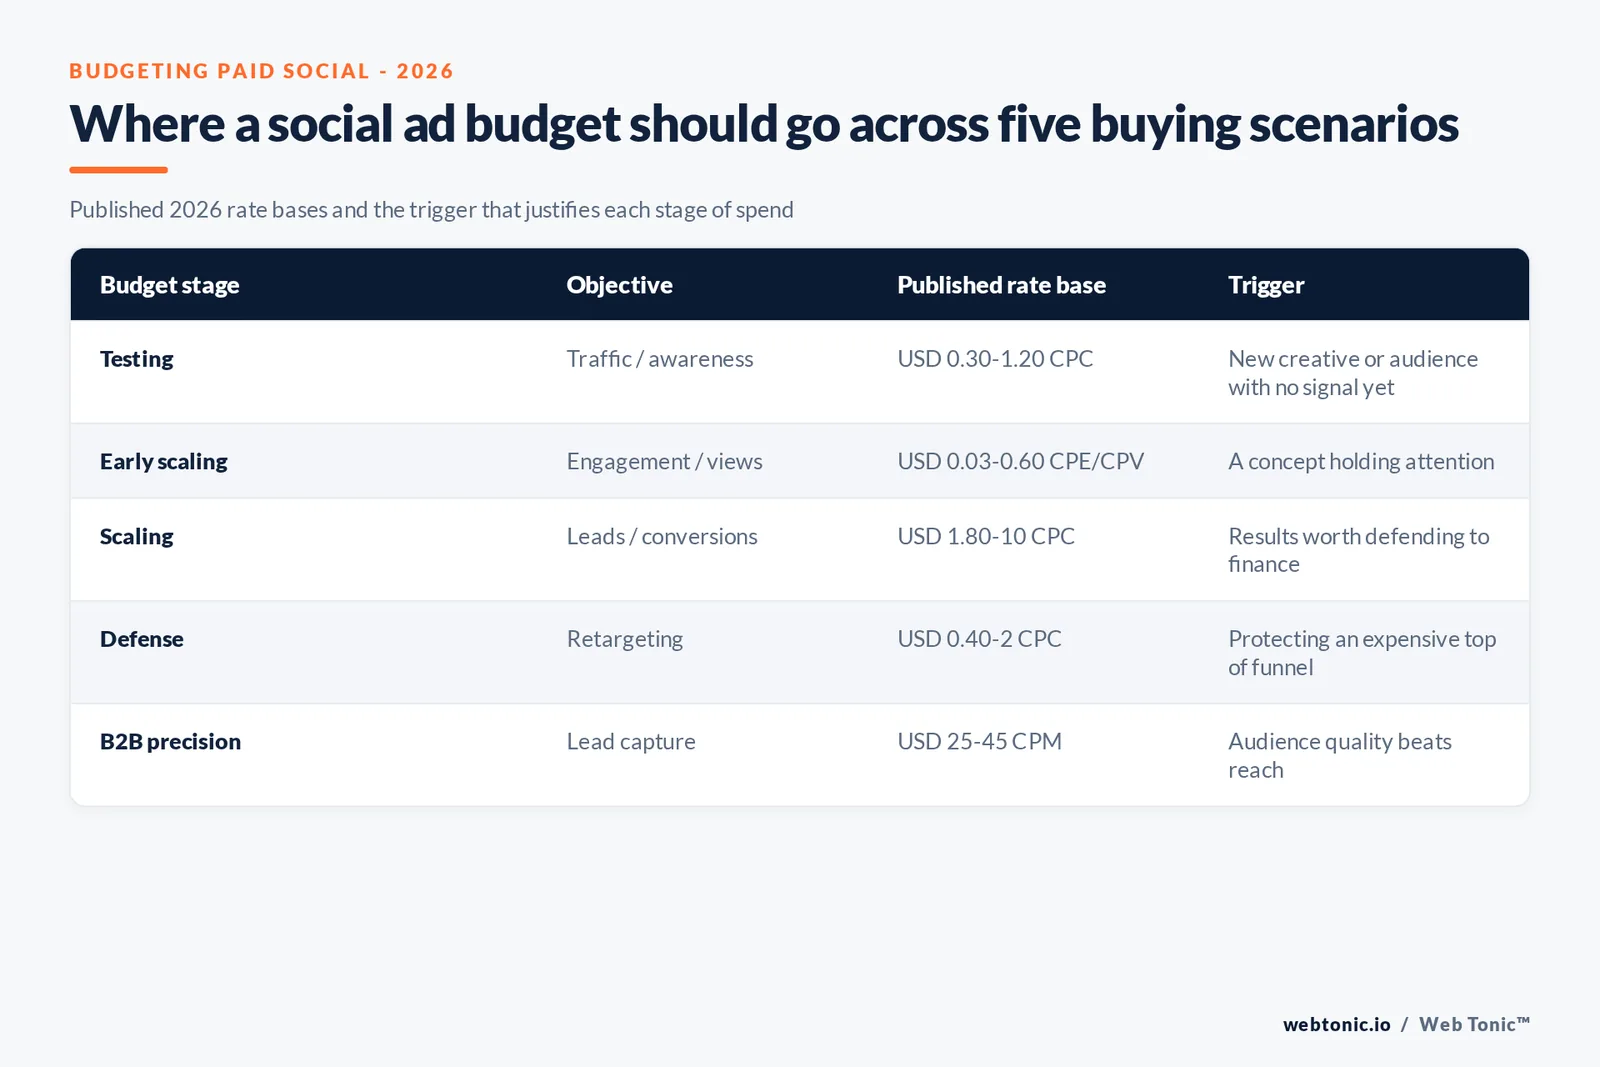
Keep the two separate. A testing budget buys the cheapest available clicks - Facebook traffic at USD 0.60 or TikTok at the low end of its USD 0.30 to USD 1.50 range - to find the creative and audience combinations worth scaling. A scaling budget then follows the lead-objective or conversion-objective cost, which on Facebook runs roughly three times higher. Budgeting both at the same rate under-funds testing or over-funds a channel that has not proven itself yet.
Our Facebook ads cost breakdown goes deeper on splitting a Meta budget by objective if paid social is concentrated on that platform.
| Budget stage | Recommended objective | Typical CPC range | What it buys |
|---|---|---|---|
| Testing | Traffic / awareness | USD 0.30 - 1.20 | Creative and audience signal, cheap |
| Early scaling | Engagement / video views | USD 0.03 - 0.60 | Proof a concept holds attention |
| Scaling | Leads / conversions | USD 1.80 - 10 | Results a finance team will fund again |
| Defense | Retargeting | USD 0.40 - 2 | Protects the cost of the top of the funnel |
What to bring to the budget conversation
Three numbers travel well into a finance review: the category's 40.0% share of digital ad revenue, the firm's own marketing spend as a share of revenue against The CMO Survey's 9.0% benchmark, and the CPC range for the platforms actually in the media plan. Together they turn a request for "more budget" into a request sized against a market that grew USD 29.0 billion in a single year.
If the plan also spans search, our Google Ads pricing guide gives the comparable numbers on that side of the budget, and talking to us gets the platform mix priced against a client's own account data rather than published medians.
Seasonality: when the budget has to stretch furthest
A flat monthly number rarely survives contact with the calendar. WordStream's benchmark work consistently shows click costs rising in the fourth quarter as retail and holiday advertisers bid up the same inventory a year-round social manager also needs. Reserve a contingency inside the annual number - even a modest 15-20% uplift for Q4 - rather than spreading the budget evenly across twelve months and running out of runway in November.
The category-level growth data reinforces the same point: with social ad revenue growing 32.6% a year, the same nominal monthly budget buys fewer impressions than it did twelve months earlier, even before a seasonal spike.
| Planning input | Recommendation | Why it matters |
|---|---|---|
| Annual contingency | 15-20% held back for Q4 | Auction prices rise with retail demand |
| Rebasing frequency | Quarterly, against fresh CPC data | Category grew 32.6% in a single year |
| Platform diversification | At least two platforms funded | No single platform absorbs a cut cleanly |
Frequently Asked Questions
What share of the marketing budget should go to paid social in 2026?
There is no single correct number, but the published anchors bracket it. The CMO Survey 2026 puts total marketing spend at 9.0% of company revenue, and IAB/PwC data shows social already capturing 40.0% of digital ad revenue - the largest single category. A social media manager building a paid line from scratch can reasonably start in the 3-4% of revenue range and adjust against the CPC data for the platforms actually in the media plan.
Why did social ad spend grow faster than every other digital category in 2025?
IAB/PwC's Internet Advertising Revenue Report attributes the 32.6% year-over-year jump to three forces: the scaling creator economy, deeper commerce integration inside the feed, and better targeting and attribution. Social added USD 29.0 billion in a single year, more new dollars than any other category recorded.
Which platform gives a manager the cheapest click to test a new budget?
On the data compiled by WordStream, Facebook traffic-objective clicks average USD 0.60 and TikTok clicks run USD 0.30 to USD 1.50, both well under Google Search's USD 5.42 and LinkedIn's USD 5 to USD 10. Cheap clicks are the right tool for testing creative and audiences, not for judging a channel's ultimate return.
Should a lead-generation budget be sized differently than a traffic budget?
Yes, and the gap is large on the same platform. WordStream's 2026 Facebook Ads Benchmarks put the median lead-objective cost per click at USD 1.80 against USD 0.60 for traffic, because the auction is pricing a form fill rather than a visit. Budget for a lead campaign at three times the per-click rate of a traffic campaign on the same platform.
Is marketing budget as a share of revenue still growing?
Not by much. The CMO Survey 2026 reports overall marketing spend growth of only 1.7% and marketing headcount growth down 50% year over year, which means most of the money for a bigger social line has to be reallocated from somewhere else in the plan, not added fresh.
Sources
IAB / PwC - 2025 Internet Advertising Revenue Report
The CMO Survey - Highlights and Insights Report 2026
Hinge Marketing - 2026 High Growth Study
WordStream - The comprehensive guide to online advertising costs, 2026
PPC Land - WordStream's 2026 Facebook Ads Benchmarks
EMARKETER - US Social Network Ad Spending, H2 2026