Table of contents
US social advertising revenue hit USD 117.7 billion in 2025, up 32.6% year over year - more than double the growth rate of digital advertising overall. Inside that number, the real 2026 story isn't that social ads are growing again; it's which platform is actually capturing the incremental dollar, and the answer is shifting.
Key Takeaways
- US social media ad revenue reached USD 117.7 billion in 2025, up 32.6% YoY.
- That's a USD 29.0 billion increase in a single year.
- Total US digital ad revenue grew only 13.9% over the same period.
- eMarketer forecasts US social network ad spend above USD 121 billion in 2026.
- Social will claim roughly 32% of US digital ad spending in 2026.
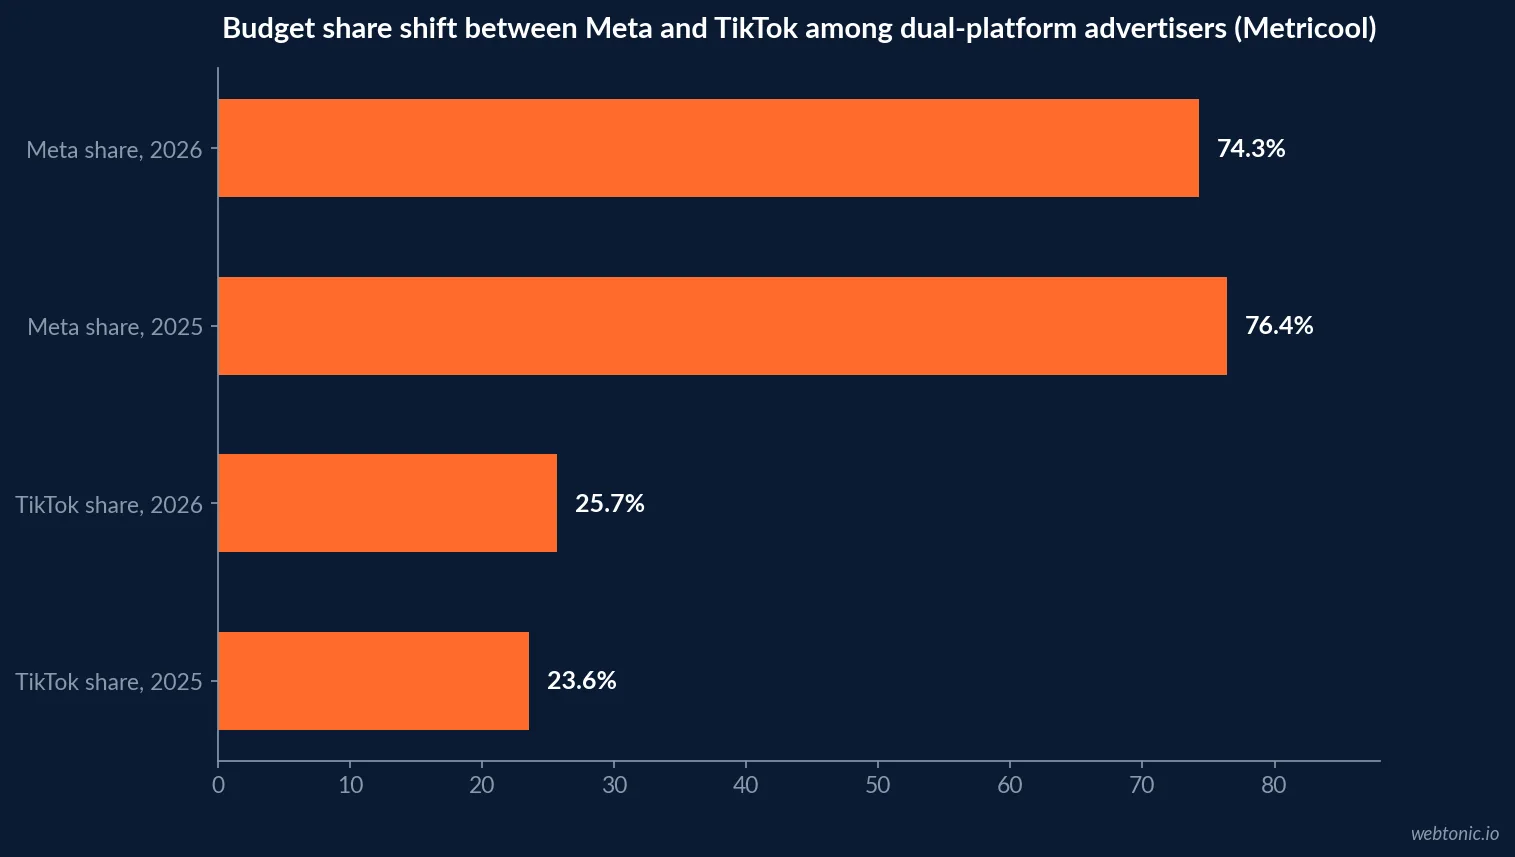
- TikTok's share of combined Meta+TikTok spend rose to 25.7%, from 23.6%.
- Meta's share of that combined spend fell to 74.3%, from 76.4%.
- Among tiny advertisers (under USD 100/mo), TikTok now takes 44% of spend.
- Average Meta campaign spend rose 47%, from USD 489.53 to USD 718.45.
- Average TikTok campaign spend rose only about 4%.
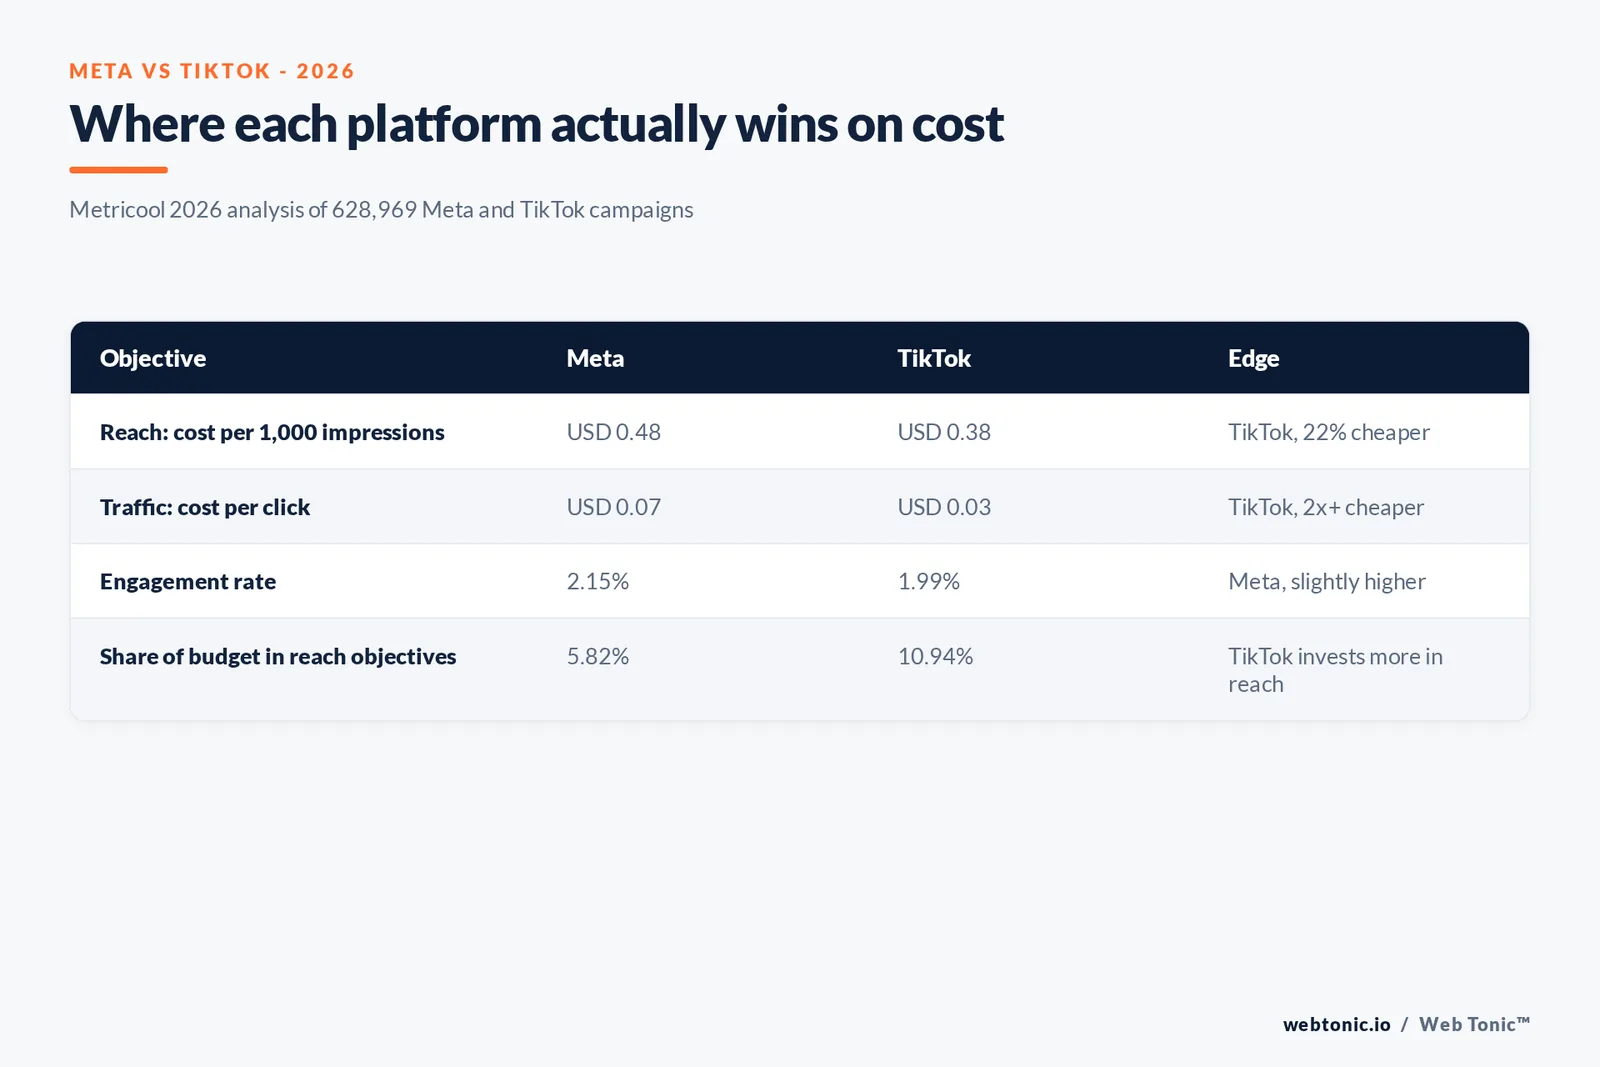
- TikTok's CPM runs 22% lower than Meta's, USD 0.38 versus USD 0.48.
- Meta's cost per click is more than double TikTok's, USD 0.07 versus USD 0.03.
- TikTok traffic campaigns generated roughly 8x more clicks in the same analysis.
- 91% of advertisers analyzed run ads on Meta alone; only 5% run TikTok alone.
- Brands put 10.94% of TikTok spend into reach objectives, versus 5.82% on Meta.
The headline number, and what actually drove it
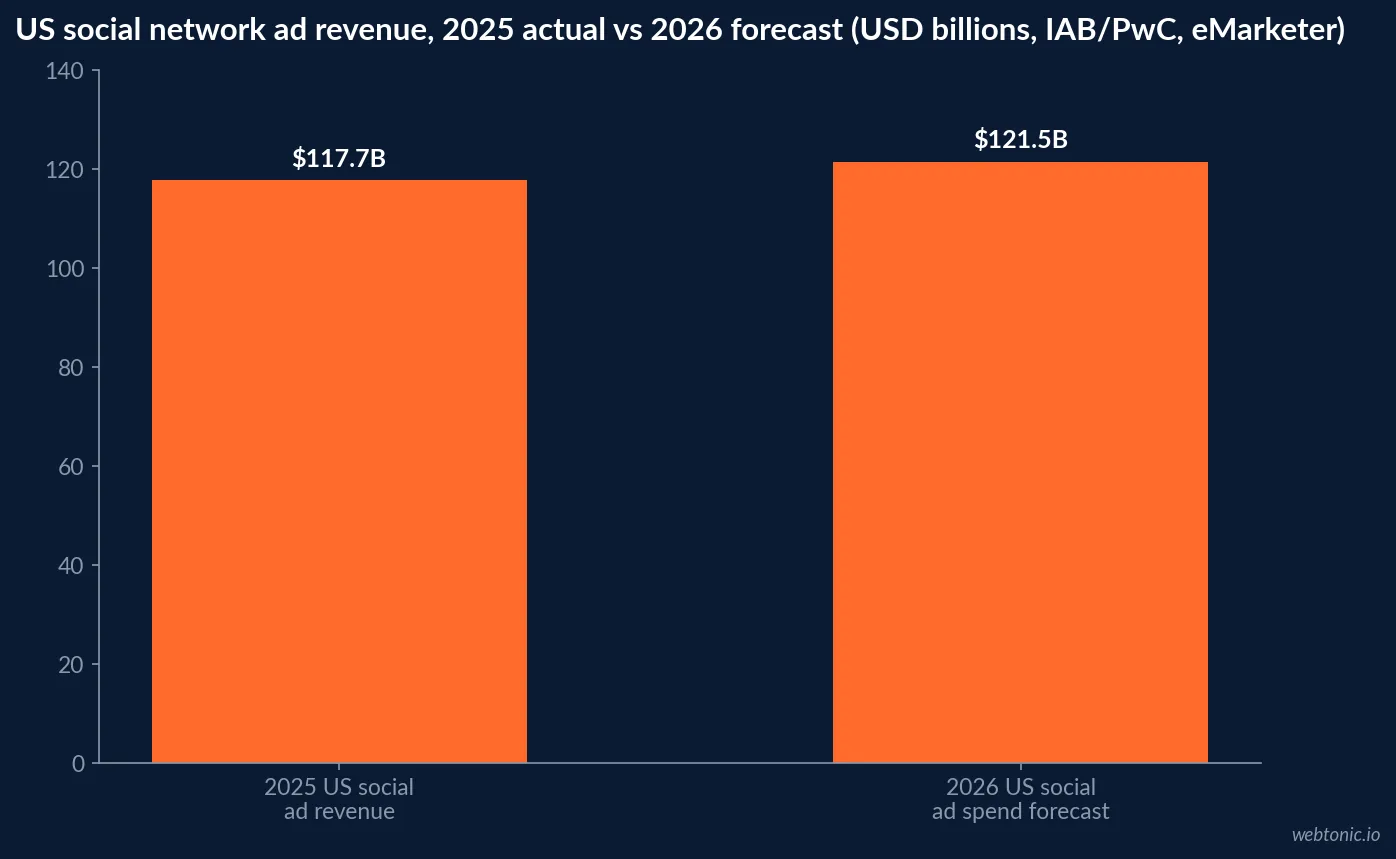
The IAB/PwC Internet Advertising Revenue Report, the industry's longest-running benchmark, measured US social media advertising revenue at USD 117.7 billion for full-year 2025 - a USD 29.0 billion increase, or 32.6% growth. That's more than double the 13.9% growth rate for total US digital advertising, which reached USD 294.6 billion in the same period. The report attributes the acceleration to election-adjacent spending carrying over from 2024, the continued rise of creator partnerships, and AI-driven improvements in personalization and ad optimization.
2026 social ad spend at a glance
| Metric (US, 2025-2026) | Figure | Source |
|---|---|---|
| Social media ad revenue, FY2025 | USD 117.7 billion | IAB/PwC |
| YoY growth in social ad revenue | 32.6% | IAB/PwC |
| Total digital ad revenue, FY2025 | USD 294.6 billion | IAB/PwC |
| Total digital ad revenue growth | 13.9% | IAB/PwC |
| US social network ad spend forecast, 2026 | Over USD 121 billion | eMarketer |
| Social's share of US digital ad spend, 2026 | ~32% | eMarketer |
eMarketer's forecast: social keeps taking share
eMarketer's H2 2026 US Social Network Ad Spending report forecasts advertisers will spend over USD 121 billion on US social networks in 2026, claiming close to 32% of total US digital ad spending - and eMarketer expects that share to keep climbing to 32.6% in 2027 even as time spent on social plateaus. The takeaway: social platforms are extracting more ad revenue per minute of attention, not just riding growth in usage.
Inside the platform split: Meta vs. TikTok
Metricool's 2026 analysis of 44,355 advertisers running 628,969 Meta and TikTok campaigns, worth more than USD 471 million in spend, found Meta still dominant overall - 91% of advertisers analyzed run ads on Meta alone, versus 5% on TikTok alone and 4% using both. But among accounts running both platforms, the budget split is moving toward TikTok: its share of combined spend rose from 23.6% in 2025 to 25.7% in 2026, while Meta's share slipped from 76.4% to 74.3%. The shift is sharpest at the bottom of the market: among "tiny" advertisers spending under USD 100 a month on both platforms, TikTok now takes 44% of that budget against Meta's 56%.
| Platform split (accounts running both) | 2025 | 2026 | Direction |
|---|---|---|---|
| TikTok share of combined spend | 23.6% | 25.7% | Up |
| Meta share of combined spend | 76.4% | 74.3% | Down |
| TikTok share among tiny advertisers (<$100/mo) | n/a | 44% | Above overall average |
| Meta share among tiny advertisers | n/a | 56% | Below overall average |
Average spend per campaign is climbing, faster on Meta
Advertisers are also putting more money behind each individual campaign. Average spend per Meta campaign climbed 47% year over year, from USD 489.53 to USD 718.45. TikTok's average campaign spend rose too, but only about 4%, from USD 1,262.10 to USD 1,308.97 - TikTok campaigns already carry a larger base spend, so the percentage gain looks smaller even though the absolute number stays higher than Meta's.
| Average spend per campaign | 2025 | 2026 | YoY change |
|---|---|---|---|
| Meta | USD 489.53 | USD 718.45 | +47% |
| TikTok | USD 1,262.10 | USD 1,308.97 | +4% |
Cost efficiency splits by objective, not by platform overall
Neither platform is simply "cheaper." For reach, TikTok's cost per thousand impressions runs 22% lower than Meta's - USD 0.38 against USD 0.48 - and advertisers put more budget behind TikTok reach campaigns on average (USD 853.15 versus USD 493.65 on Meta), getting more than double the impressions back. Brands route 10.94% of their TikTok spend into reach objectives, almost double the 5.82% share Meta awareness campaigns get.
The pattern flips hard for clicks. Meta's average cost per click, USD 0.07, is more than double TikTok's USD 0.03, and a Meta traffic campaign averages 4,594 clicks against 35,493 on TikTok - roughly 8x as many, though TikTok traffic campaigns also start from a bigger budget (USD 949.83 against USD 304.03). For pure engagement, Meta edges ahead at 2.15% versus TikTok's 1.99%, though TikTok still generates more total interactions per dollar spent because of its larger reach.
| Objective | Meta | TikTok | Where the edge sits |
|---|---|---|---|
| Reach: CPM | USD 0.48 | USD 0.38 | TikTok, 22% cheaper |
| Reach: avg. impressions per campaign | ~1.0M | ~2.2M | TikTok |
| Traffic: cost per click | USD 0.07 | USD 0.03 | TikTok, more than 2x cheaper |
| Traffic: avg. clicks per campaign | 4,594 | 35,493 | TikTok, ~8x more |
| Engagement rate | 2.15% | 1.99% | Meta, slightly higher rate |
Zoom out: Meta is closing in on Google, and that changes the social math
The Meta-vs-TikTok split sits inside a bigger 2026 shift. eMarketer's April 2026 forecast projects Meta will overtake Google in total digital ad revenue for the first time ever this year - USD 243.46 billion for Meta against USD 239.54 billion for Google, worldwide. Meta's share of global ad spend is forecast to hit 26.8%, edging past Google's 26.4%, while Amazon holds 9.0% and rising. Together, the three now represent 62.3% of worldwide digital ad spending. A social budget riding on Meta in 2026 is riding the platform that just became the single largest ad seller on earth, not a challenger anymore.
| Worldwide digital ad revenue, 2026 forecast | Figure | Share of global spend |
|---|---|---|
| Meta | USD 243.46 billion | 26.8% |
| USD 239.54 billion | 26.4% | |
| Amazon | USD 82.07 billion | 9.0% |
| Combined (Meta + Google + Amazon) | n/a | 62.3% |
B2B budgets are making a different bet: LinkedIn
Not every social budget is chasing Meta or TikTok. Dreamdata's 2026 LinkedIn Ads Benchmarks Report, built on more than 66 million tracked sessions and 3.5 million customer journeys across its B2B customer base, found LinkedIn now commands 41% of total B2B ad budgets, up 2 points year over year, and delivers a 121% return on ad spend at the company-influence level - ahead of Google Search's 67% and Meta's 51% in the same B2B dataset. LinkedIn's cost per click is higher in isolation (EUR 5.98 versus Meta's EUR 1.60), but at the company level the cost per company influenced actually fell to EUR 70.11 from EUR 154 the prior year, well below Meta's EUR 128.70.
The lesson for any social budget split: the "which platform is cheaper" question only has an answer once you specify B2C reach, B2B revenue influence, or raw click volume - they point to three different platforms.
| B2B channel (Dreamdata, 2026) | Share of B2B ad budget | ROAS at company level |
|---|---|---|
| 41% | 121% | |
| Google Search | Not the largest single line | 67% |
| Meta | Not the largest single line | 51% |
The global backdrop: social spend is set to cross USD 300 billion
WARC Media, the ad-industry data firm, forecasts worldwide social ad expenditure will exceed USD 300 billion in 2026, after reaching USD 286.2 billion in 2025, up 12.3% year on year. WARC's broader December 2025 global ad forecast found Alphabet, Amazon and Meta together absorbing the vast majority of incremental worldwide ad spend through 2027, with their combined share rising to 58.0% of the global market in 2026 - a reminder that even a growing social pie is concentrating in fewer hands.
One platform outside that trio is worth watching on its own: Reddit's official Q2 2026 earnings release reported total revenue of USD 805 million, up 61% year over year, with ad revenue specifically climbing 64% to USD 762 million - its eighth consecutive quarter of over 60% revenue growth, driven by weekly active users crossing 514.6 million, up 24% year over year.
| Platform-level 2026 ad signal | Figure | Source |
|---|---|---|
| Worldwide social ad spend, 2026 forecast | Over USD 300 billion | WARC Media |
| Alphabet + Amazon + Meta share of global ad spend, 2026 | 58.0% | WARC Media |
| Reddit ad revenue, Q2 2026 | USD 762 million (+64% YoY) | Reddit Q2 2026 earnings release |
| Reddit weekly active uniques, Q2 2026 | 514.6 million (+24% YoY) | Reddit Q2 2026 earnings release |
Pinterest: smaller budget line, steady double-digit growth
Pinterest's own Q2 2026 earnings presentation reported revenue of USD 1,180 million, up 18% year over year, with 640 million global monthly active users, up 11% - its twelfth straight quarter of record users. Gen Z is now Pinterest's largest and fastest-growing cohort, representing over half its user base, which matters for advertisers who've written the platform off as an older-skewing channel. It's a smaller ad budget line than Meta or TikTok for most advertisers, but one of the more consistent growth curves in the category.
| Pinterest signal, Q2 2026 | Figure |
|---|---|
| Revenue | USD 1,180 million (+18% YoY) |
| Global monthly active users | 640 million (+11% YoY) |
| Consecutive quarters of record user growth | 12 |
| Share of user base that is Gen Z | Over 50% |
The retail-media adjacent story: Amazon keeps compounding
Amazon isn't a social network, but it's the third leg of the platform advertising story that any social budget is competing against for share of wallet. Amazon's own Q2 2026 earnings release reported advertising services revenue of USD 17.243 billion for the quarter, up 26% year over year - its advertising business is growing faster than most standalone social platforms tracked on this page, and it's doing so from a much larger revenue base already.
| Amazon advertising signal, Q2 2026 | Figure |
|---|---|
| Advertising services revenue, Q2 2026 | USD 17.243 billion |
| YoY growth | 26% |
| Full-year 2025 worldwide ad revenue (eMarketer forecast context) | USD 68.64 billion |
What this means for a 2026 budget split
The data argues against a single-platform bet. Meta remains the default and the deepest audience pool, which is why 91% of advertisers still run it, but the marginal dollar on reach and click volume is currently more efficient on TikTok - a pattern most visible, and most actionable, for advertisers still spending under a few hundred dollars a month. Read our breakdown of what Facebook ads actually cost in 2026 before setting the Meta side of that split, review our performance creative capabilities for building assets that hold up on both feeds, or talk to our team about modeling the mix against your own numbers.
Frequently Asked Questions
How much is spent on social advertising in the US in 2026?
The IAB/PwC Internet Advertising Revenue Report measured US social media advertising revenue at USD 117.7 billion for full-year 2025, up USD 29.0 billion, or 32.6%, year over year. eMarketer's separate forecast puts 2026 US social network ad spending above USD 121 billion, at roughly 32% of total US digital ad spending.
Is budget actually shifting from Meta to TikTok in 2026?
Among the accounts Metricool analyzed that run both platforms, TikTok's share of combined Meta+TikTok spend rose from 23.6% in 2025 to 25.7% in 2026, while Meta's share slipped from 76.4% to 74.3%. The shift is sharper among the smallest advertisers: accounts spending under USD 100 a month now put 44% of that budget into TikTok against 56% into Meta.
Which platform is cheaper to advertise on right now?
On a pure reach basis, TikTok's cost per thousand impressions runs 22% lower than Meta's, USD 0.38 against USD 0.48, per Metricool's 2026 analysis of 628,969 campaigns. On clicks, the pattern reverses sharply: Meta's average cost per click is USD 0.07 against TikTok's USD 0.03, and TikTok traffic campaigns generated roughly eight times more clicks per dollar in the same dataset.
Is average ad spend per campaign rising or falling?
Rising, and far faster on Meta. Average spend per Meta campaign climbed 47% year over year, from USD 489.53 to USD 718.45, according to Metricool. TikTok's average campaign spend also rose, but only about 4%, from USD 1,262.10 to USD 1,308.97 - TikTok campaigns already start from a larger base.
What share of the total US digital ad market does social now represent?
Social media advertising reached USD 117.7 billion of the USD 294.6 billion total US digital ad market in 2025, per the IAB/PwC report - just under 40% of all digital ad spend, and one of the fastest-growing formats the report tracks at 32.6% YoY, ahead of total digital ad growth of 13.9%.
Sources
IAB / PwC - Internet Advertising Revenue Report, Full-Year 2025
eMarketer - US Social Network Ad Spending H2 2026
Metricool - Social Media Advertising Trends 2026
eMarketer - Meta to Surpass Google in Digital Ad Revenues for First Time Ever
Dreamdata - 2026 LinkedIn Ads Benchmarks Report
WARC Media - The Big Picture: Social Media 2025
Reddit, Inc. - Q2 2026 Earnings Press Release
Pinterest, Inc. - Q2 2026 Earnings Presentation
Amazon.com, Inc. - Q2 2026 Earnings Release