Table of contents
Median cost-per-click for recruitment ads climbed to USD 0.92 in 2026, even as the labor market cooled — the opposite of what basic supply and demand would predict. This page tracks the full hiring funnel cost, from the first click to a completed hire, against Appcast's and SHRM's named 2026 benchmark data.
Key Takeaways
- Median cost-per-click reached USD 0.92 in 2026, up despite softer hiring demand.
- Median cost-per-application is USD 19.32, also trending upward through 2025.
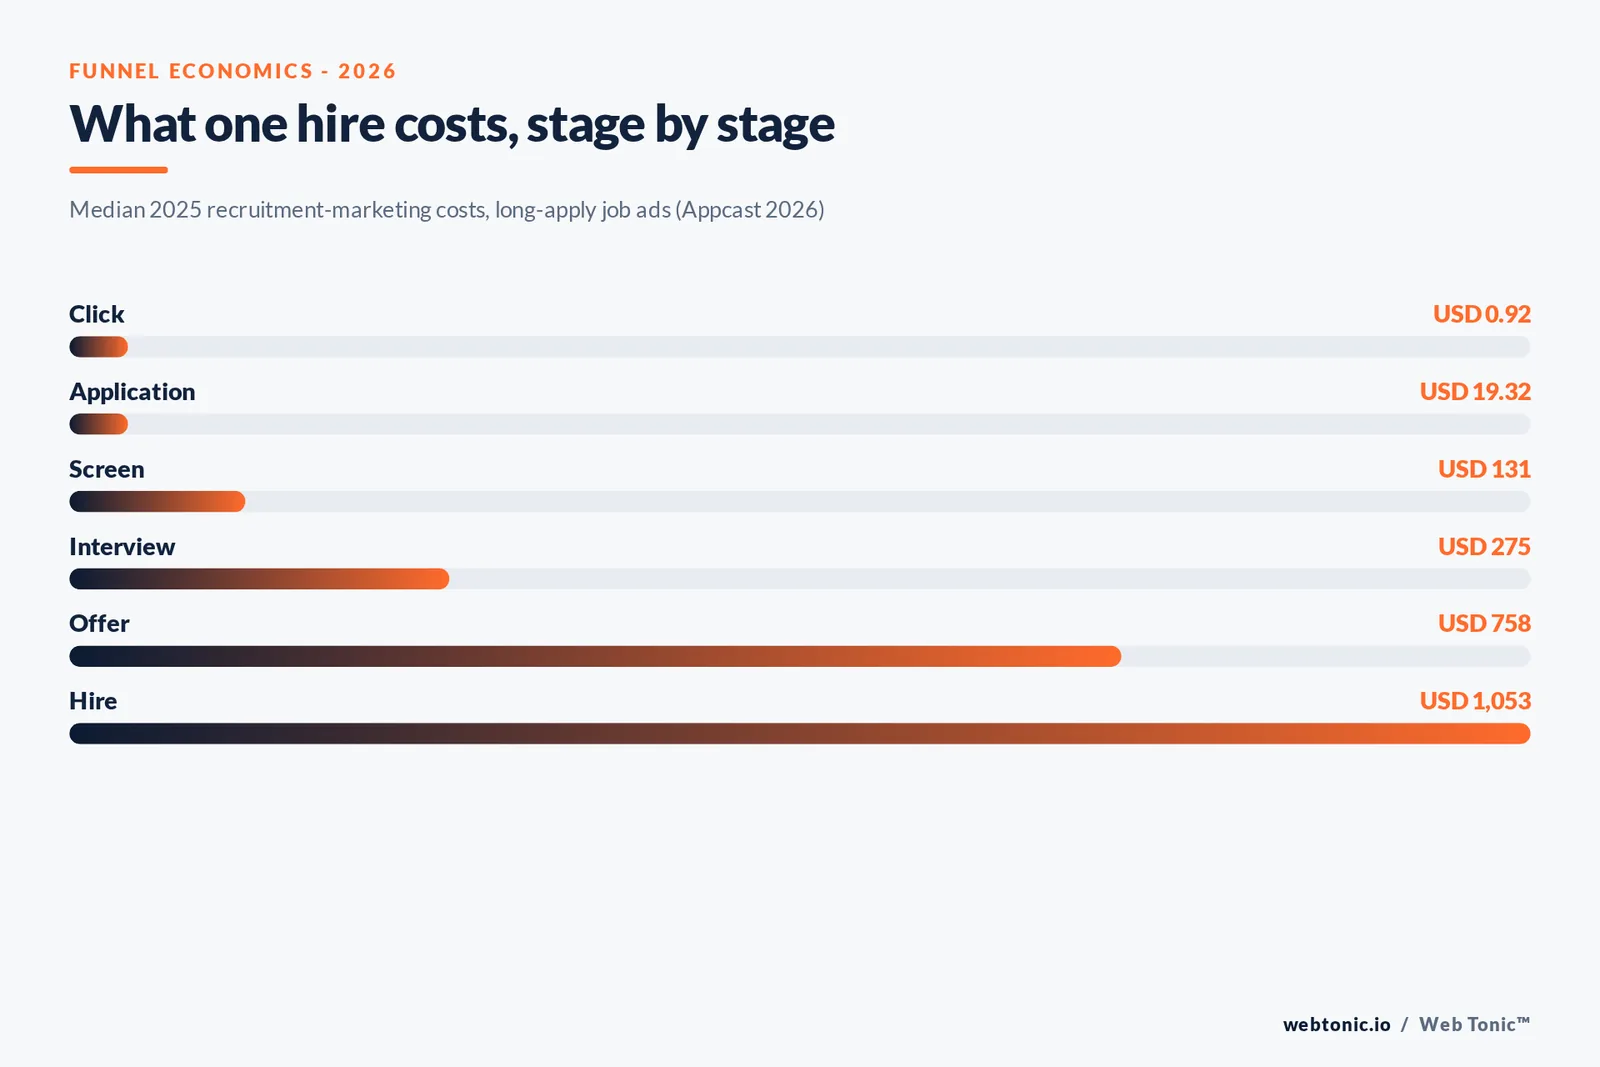
- Median cost-per-hire sits at USD 1,053 across the full funnel.
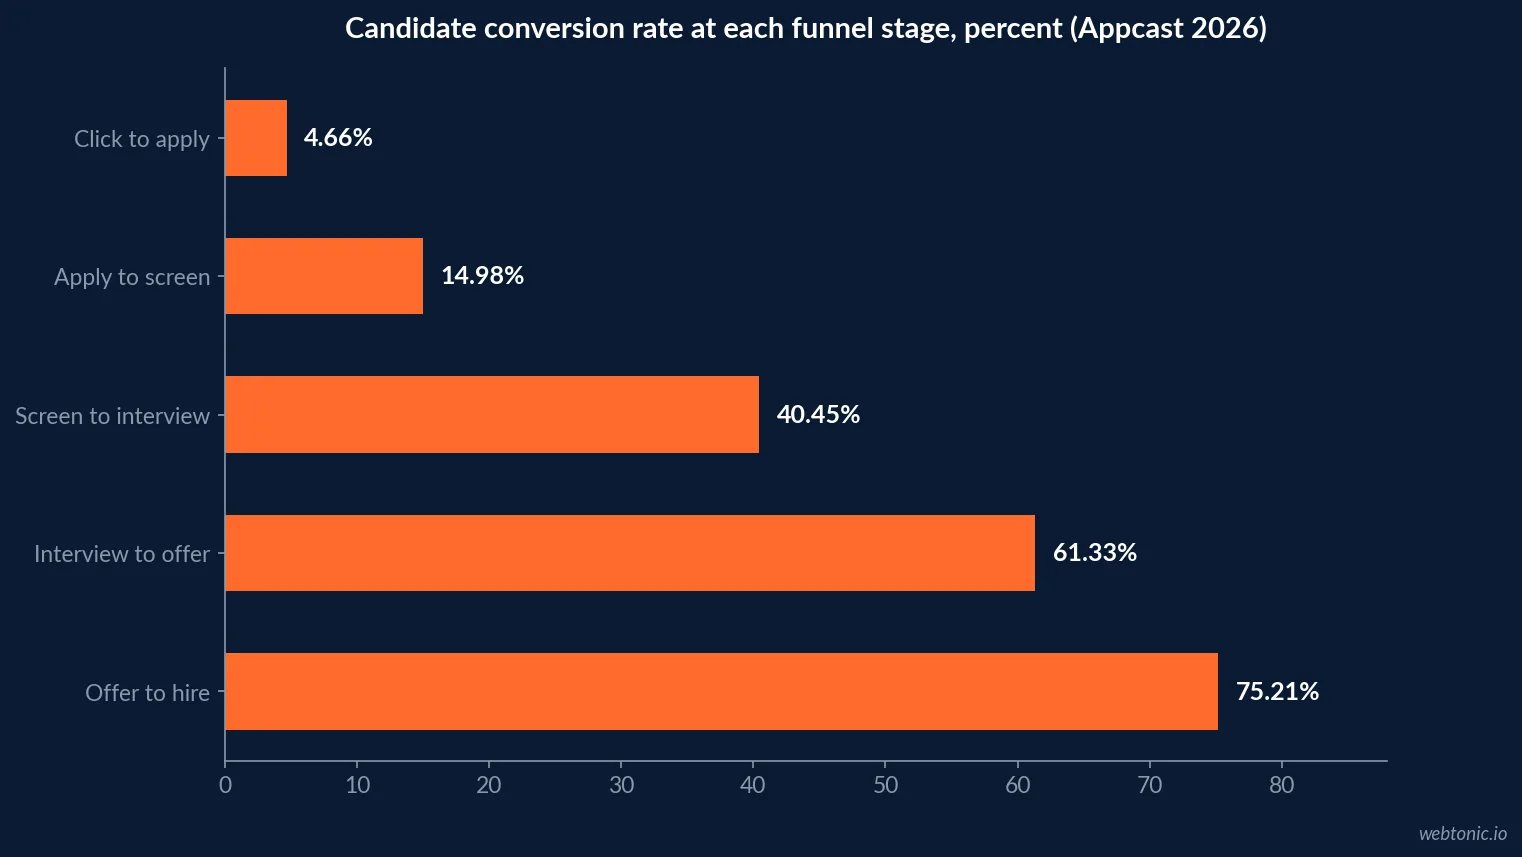
- Only 4.66% of clicks convert to an application, the steepest funnel drop-off.
- 75.21% of offers convert to a completed hire, the funnel's strongest stage.
- Appcast's 2026 analysis covers nearly 1,200 US employers and 302 million clicks.
- The 2025 US unemployment rate peaked at 4.6%, the softest labor market since 2009 outside the pandemic.
- Median time-to-fill fell to 39 calendar days for nonexecutive roles.
- 97% of nonexecutive roles are now filled externally, up from 93% in 2025.
- Extra-large organisations saw a 67% jump in requisitions per recruiter.
- 93% of recruiters plan to increase AI use in 2026.
- 59% of recruiters say AI already surfaces candidates they'd have missed.
- Over 2 in 3 organisations struggled to fill open roles in 2026.
- The wage premium for job-hopping has nearly disappeared in the 2026 data.
- LinkedIn's Hiring Assistant early adopters see a 69% InMail acceptance lift.
The funnel, stage by stage
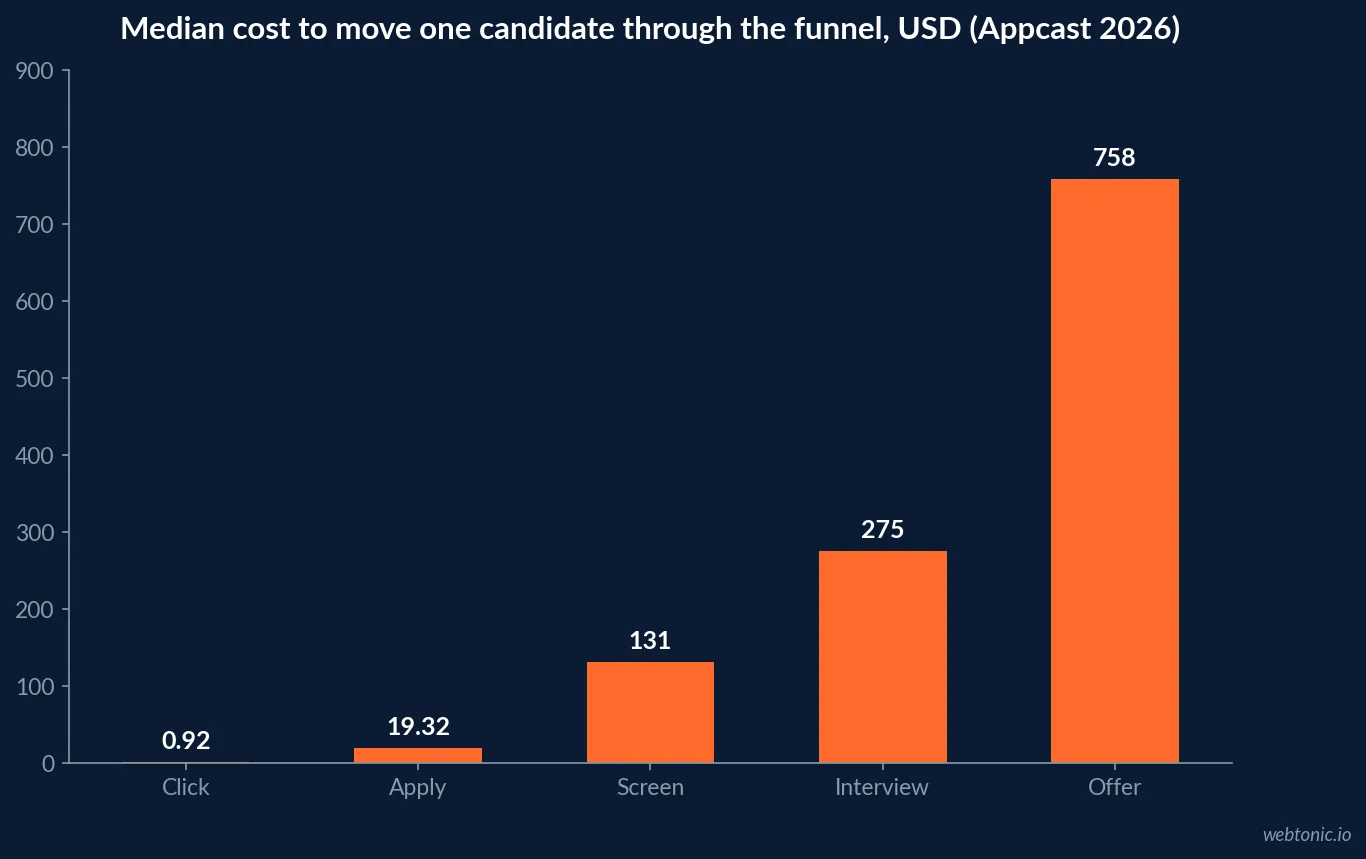
Appcast's 10th annual Recruitment Marketing Benchmark Report, analysing nearly 1,200 US employers and over 302 million clicks from 2025 job-ad data, is the first edition to publish full down-funnel disposition costs rather than just top-of-funnel click and apply metrics. The median 2025 costs it reports: USD 0.83 per click, USD 19.20 per application, USD 131 to reach screening, USD 275 to reach interview, USD 758 to reach offer, and USD 1,053 for a completed hire. The three-month moving average through into 2026 nudges the click and application medians to USD 0.92 and USD 19.32 respectively.
| Funnel stage | Median cost (2025-26) | Conversion rate to next stage | Source |
|---|---|---|---|
| Click | USD 0.83-0.92 | 4.66% convert to apply | Appcast 2026 Benchmark Report |
| Application | USD 19.20-19.32 | 14.98% convert to screen | Appcast 2026 Benchmark Report |
| Screen | USD 131 | 40.45% convert to interview | Appcast 2026 Benchmark Report |
| Interview | USD 275 | 61.33% convert to offer | Appcast 2026 Benchmark Report |
| Offer | USD 758 | 75.21% convert to hire | Appcast 2026 Benchmark Report |
| Hire | USD 1,053 | — | Appcast 2026 Benchmark Report |
Why costs rose while the labor market cooled
The counterintuitive part of the 2026 data is that costs climbed as hiring slowed. Appcast's report notes that job growth stepped down to its slowest pace since 2009 outside the pandemic shock, with unemployment hitting 4.6% in the fall of 2025 — a "low-hire, low-fire" environment where fewer people quit and fewer employers add headcount. Normally that combination should push CPC and CPA down as competition for candidates eases. Instead, Appcast attributes the rise mainly to how job boards and media platforms have shifted their business models toward paid distribution, meaning employers now pay more simply to stay visible, independent of candidate supply. The wage premium for job-switching has also nearly evaporated, per the Atlanta Fed data Appcast cites, removing another lever that used to pull recruiting costs down in a soft market.
| Labor market signal (2025-26) | Figure | Source | Effect on recruitment cost |
|---|---|---|---|
| Peak US unemployment, fall 2025 | 4.6% | BLS via Appcast 2026 report | Should ease costs; did not |
| Monthly job growth pace | Slowest since 2009 (ex-pandemic) | BLS via Appcast 2026 report | Confirms a genuinely soft market |
| Wage premium for job-switching | Nearly zero | Atlanta Fed via Appcast 2026 report | Removes a historic cost-easing lever |
| Driver Appcast cites for rising CPC/CPA | Shift to paid job-board distribution | Appcast 2026 report | Structural, not demand-driven |
What SHRM's employer-side data adds
SHRM's 2026 Recruiting Executives Benchmarking report, drawn from data on more than 4,600 organisations, found median time-to-fill for nonexecutive roles improved to 39 calendar days even as executive cost-per-hire rose substantially. The share of nonexecutive roles filled externally, rather than through internal mobility, ticked up to 97% from 93% the year before. Extra-large organisations reported a 67% jump in requisitions handled per recruiter, and SHRM notes that over two in three organisations still struggled to fill open positions in 2026 despite the softer overall labor market.
Read alongside Appcast's funnel data, the picture is one team doing more with the same headcount while paying a rising per-candidate rate — exactly the pressure that pushes recruitment marketing budgets to justify themselves on down-funnel quality, not just applicant volume.
| SHRM 2026 benchmark | Figure | Change vs. 2025 | Source |
|---|---|---|---|
| Median time-to-fill, nonexecutive | 39 calendar days | Improved | SHRM Recruiting Benchmarking 2026 |
| Nonexecutive roles filled externally | 97% | Up from 93% | SHRM Recruiting Benchmarking 2026 |
| Requisitions per recruiter, extra-large orgs | +67% | Increase | SHRM Recruiting Benchmarking 2026 |
| Orgs struggling to fill open roles | Over 2 in 3 | Persistent challenge | SHRM Recruiting Benchmarking 2026 |
The AI variable
LinkedIn's January 2026 research found 93% of recruiters plan to increase their use of AI this year, and 59% already say it is helping them surface candidates with skills they would not otherwise have found. On the tooling side, LinkedIn reports early adopters of its Hiring Assistant agent save 4-plus hours per role, review 62% fewer profiles, and see a 69% improvement in InMail acceptance rates. What the Appcast cost data makes clear, though, is that none of this has yet pushed acquisition costs down industry-wide — AI is changing recruiter workflow before it shows up in the funnel economics this page tracks.
That gap is where a recruitment marketing budget should focus next: efficiency gains inside the recruiter's workflow are real, but they have not yet been passed through to lower cost-per-click or cost-per-hire. Our growth marketing team builds the funnel instrumentation that shows whether a given AI tool is actually moving those numbers for a specific employer brand, our data and analytics practice ties that funnel data back to the applicant tracking system, and our agency overview covers how the two teams work together on a talent-acquisition account. Reach out to size a recruitment marketing program against these benchmarks.
Programmatic buying is changing where the budget goes
Part of the reason CPC and CPA keep climbing while conversion stays uneven is that the buying mechanism itself is shifting. DirectEmployers Association's 2026 analysis puts the programmatic job advertising platform market at roughly USD 2.3 billion in 2025, growing to USD 5.7 billion by 2031 at about 16% annually, and reports that employers who switch from flat-fee postings to programmatic, performance-based buying typically see cost-per-application fall by 25 to 50% compared to traditional job-board postings. Mordor Intelligence's separate 2026 sizing puts the current market at USD 2.71 billion, growing to USD 5.70 billion by 2031, with North America the largest region and Asia-Pacific the fastest-growing.
That is a meaningful gap against the flat-fee posting model still used by many mid-sized employers, and it is the most direct lever available to counter the CPC and CPA increases documented above.
| Programmatic job advertising fact (2026) | Figure | Source | Relevance |
|---|---|---|---|
| Market size, 2025 | ~USD 2.3-2.7 billion | DirectEmployers / Mordor Intelligence | Still a minority of total recruitment ad spend |
| Market size, 2031 forecast | USD 5.7 billion | DirectEmployers / Mordor Intelligence | More than doubling in six years |
| Annual growth rate | ~16% | Mordor Intelligence | Outpacing overall recruitment marketing spend growth |
| Typical cost-per-application reduction | 25-50% | DirectEmployers Association | Direct counter to Appcast's rising CPA trend |
Cost varies enormously by geography
National medians hide a huge range. Appcast's 2026 report found Vermont, an older and rural state with unemployment at 2.6%, posts an apply rate of just 3.4%, while California, younger and more urban with unemployment at 5.5%, posts a 5.0% apply rate — more available workers means more applications, which pulls cost-per-application down. The Southeast is the market to watch: CPA has risen across the Carolinas, Georgia and neighbouring states as population growth and data-centre investment pull in new job openings, narrowing the historic cost gap with the Northeast.
For the first time, the 2026 report also published international benchmarks converted to US dollars, finding roughly a tenfold difference across markets — from USD 7.93 in the Philippines to over USD 46 in Austria — and that several European markets, including the UK, actually saw cost-per-application fall year over year as their labor markets cooled, the opposite of the US trend.
| Geographic recruitment-cost fact (2026) | Figure | Source | Note |
|---|---|---|---|
| Vermont apply rate | 3.4% | Appcast 2026 Benchmark Report | Older, rural state, 2.6% unemployment |
| California apply rate | 5.0% | Appcast 2026 Benchmark Report | Younger, urban state, 5.5% unemployment |
| Cost-per-application range across countries | ~10x spread | Appcast 2026 Benchmark Report | USD 7.93 (Philippines) to USD 46+ (Austria) |
| Southeast US CPA trend | Rising toward Northeast levels | Appcast 2026 Benchmark Report | Population and data-centre growth pulling up demand |
| UK cost-per-application trend | Falling YoY | Appcast 2026 Benchmark Report | Cooling labor market easing costs, unlike the US |
Frequently Asked Questions
Why did recruitment costs rise in 2026 even though hiring slowed?
Appcast's 2026 Recruitment Marketing Benchmark Report calls this out directly: normally, a softer labor market with more job seekers should push cost-per-click and cost-per-application down, but both climbed steadily through 2025 into 2026. The report attributes it mainly to how job boards and media platforms have shifted toward paid distribution models, which raises the baseline cost of visibility regardless of candidate supply. Healthcare and specialised roles still command a genuine competitive premium on top of that structural shift.
What does it cost to move a candidate through the full hiring funnel in 2026?
Appcast's median 2025 figures, published in its 2026 report, are: USD 0.83 per click, USD 19.20 per application, USD 131 to reach the screening stage, USD 275 to reach interview, USD 758 to reach offer, and USD 1,053 for a completed hire. Conversion rates drop sharply at the top of the funnel — only 4.66% of clicks convert to an application — then rise steadily, with 75.21% of offers converting to a hire.
How long does it take to fill a role in 2026?
SHRM's 2026 Recruiting Executives Benchmarking data, drawn from over 4,600 organisations, found the median time-to-fill for nonexecutive positions fell to 39 calendar days, an improvement on the prior year, while cost-per-hire for executive positions rose substantially. Extra-large organisations saw a 67% increase in requisitions per recruiter in 2026, meaning individual recruiters are covering more roles even as fill times improve.
Is AI actually changing recruitment marketing outcomes in 2026?
According to LinkedIn's January 2026 research, 93% of recruiters plan to increase their use of AI in 2026, and 59% say it is already helping them find candidates with skills they would not otherwise have surfaced. On the employer side, LinkedIn's Hiring Assistant tool reports early adopters saving 4-plus hours per role and a 69% improvement in InMail acceptance rates, though the broader Appcast cost data shows AI adoption has not yet translated into lower acquisition costs industry-wide.
What percentage of nonexecutive roles get filled externally versus internally in 2026?
SHRM's 2026 benchmarking found the median share of nonexecutive positions filled externally rose slightly to 97%, up from 93% in 2025, meaning internal mobility is covering a smaller share of open roles than the year before. That shift raises the stakes on external recruitment marketing spend, since a larger proportion of every open req now depends on the paid funnel this page benchmarks.
Sources
Appcast — 2026 Recruitment Marketing Benchmark Report
SHRM — 2026 Recruiting Executives Benchmarking: Attracting Critical Talent
LinkedIn — 2026 Talent Research: Nearly 80% of People Feel Unprepared to Find a Job
DirectEmployers Association — Why Programmatic Job Advertising Is Growing
Mordor Intelligence — Programmatic Job Advertising Platform Market, 2026