



Table of contents
Short answer: Use the 2026 evidence to frame a test, not to copy a universal benchmark. The statistics below separate measured outcomes from survey opinions and put investment decisions in context.
Key Takeaways
- 84% opt-in was reported by SimpleTexting; EZ Texting reported 86% in a separate 2025 survey.
- 53% cited texting too often as an opt-out reason in SimpleTexting’s survey.
- Ecommerce platform benchmarks depend on flows, samples and attribution definitions.
- Protect permission and list health as part of the budget.
Benchmarks at a glance
| SMS indicator | Finding | Source / year | Unit |
|---|---|---|---|
| Consumer opt-in | 84% | SimpleTexting · 2025 | 1,000 US consumers |
| Consumer opt-in | 86% | EZ Texting · 2025 | 1,074 qualified US participants |
| Promotional-text response | 59% | EZ Texting · 2025 | Survey response |
| Texts too often cited for opt-out | 53% | SimpleTexting · 2025 | Reported reason |
| Business plans to increase SMS budget | 67% | SimpleTexting · 2025 | Intent for that year |
Consumer permission is the asset
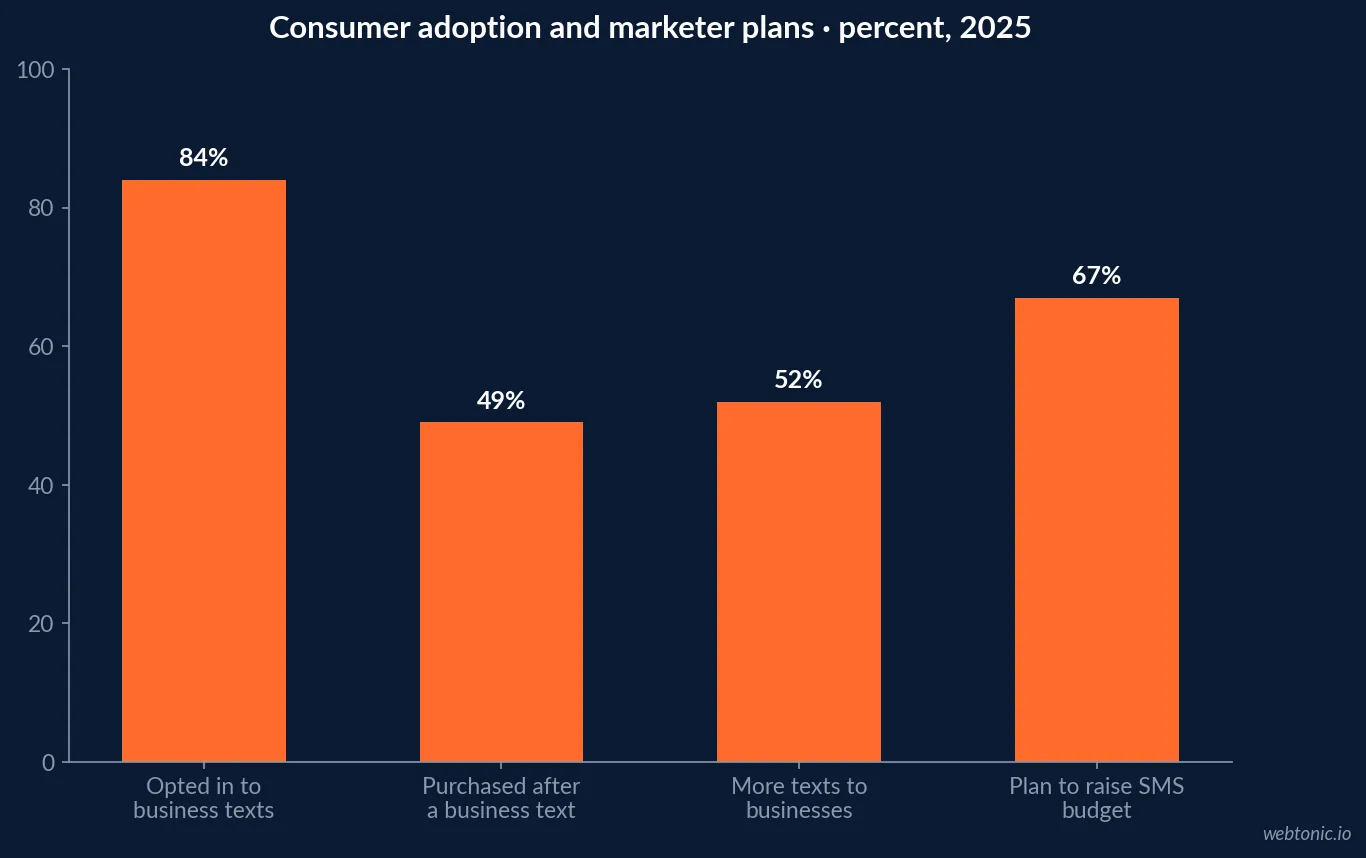
The strongest consumer signal in the 2025 survey evidence is not a claim that every text gets read or clicked: it is that many consumers have opted into business messages and that excessive or irrelevant contact can push them away. SimpleTexting surveyed 1,000 US consumers and 400 business owners and marketing managers in December 2024. It reported 84% of consumers opted in to receive business texts, up from 79% the prior year, and 52% received messages from four or more businesses. EZ Texting surveyed 1,074 qualified participants in November 2024 and reported 86% opted into text marketing. These separate results point to broad usage, but they should not be combined into an exact market-wide figure. Keep a source record for every subscription, honor the stated purpose and make opting out straightforward. Consent is not a list-size trophy; it is permission to deliver value.
Research source: SimpleTexting, 2025 SMS Marketing Report
How much appetite is there for business texts?
The 2025 SimpleTexting report says 84% of consumers were opted in to business texts and 55% of surveyed businesses reported opt-in growth over the prior year. It also reported 67% of businesses planned to increase SMS budgets in 2025. These are retrospective survey results and reported intent, not realized budget growth in 2026. EZ Texting separately reported 52% of respondents were sending more messages to businesses than in its prior survey year, and 59% responded to promotional texts. Differences in panel, question wording and respondent mix matter. Use these findings as evidence that both consumer interaction and marketer interest remain substantial, then examine your own subscriber list, complaint rate and incremental margin. Do not extrapolate an intention to spend into proof that the channel will work for every product or audience.
Research source: EZ Texting, 2025 Consumer Texting Behavior Report
Read the relevant comparison below alongside the section above; definitions and populations matter.
| Question | Response | Study | Caveat |
|---|---|---|---|
| Opted in to business texts | 84% | SimpleTexting 2025 | Consumer survey |
| Opted in to text marketing | 86% | EZ Texting 2025 | Separate sample / instrument |
| Receive texts from 4+ businesses | 52% | SimpleTexting 2025 | Subscriber exposure |
| Respond to promotional texts | 59% | EZ Texting 2025 | Not a click-through rate |
| Purchase after a business text | Nearly half | EZ Texting 2025 | Self-reported purchase |
The fatigue signal is a budgeting signal
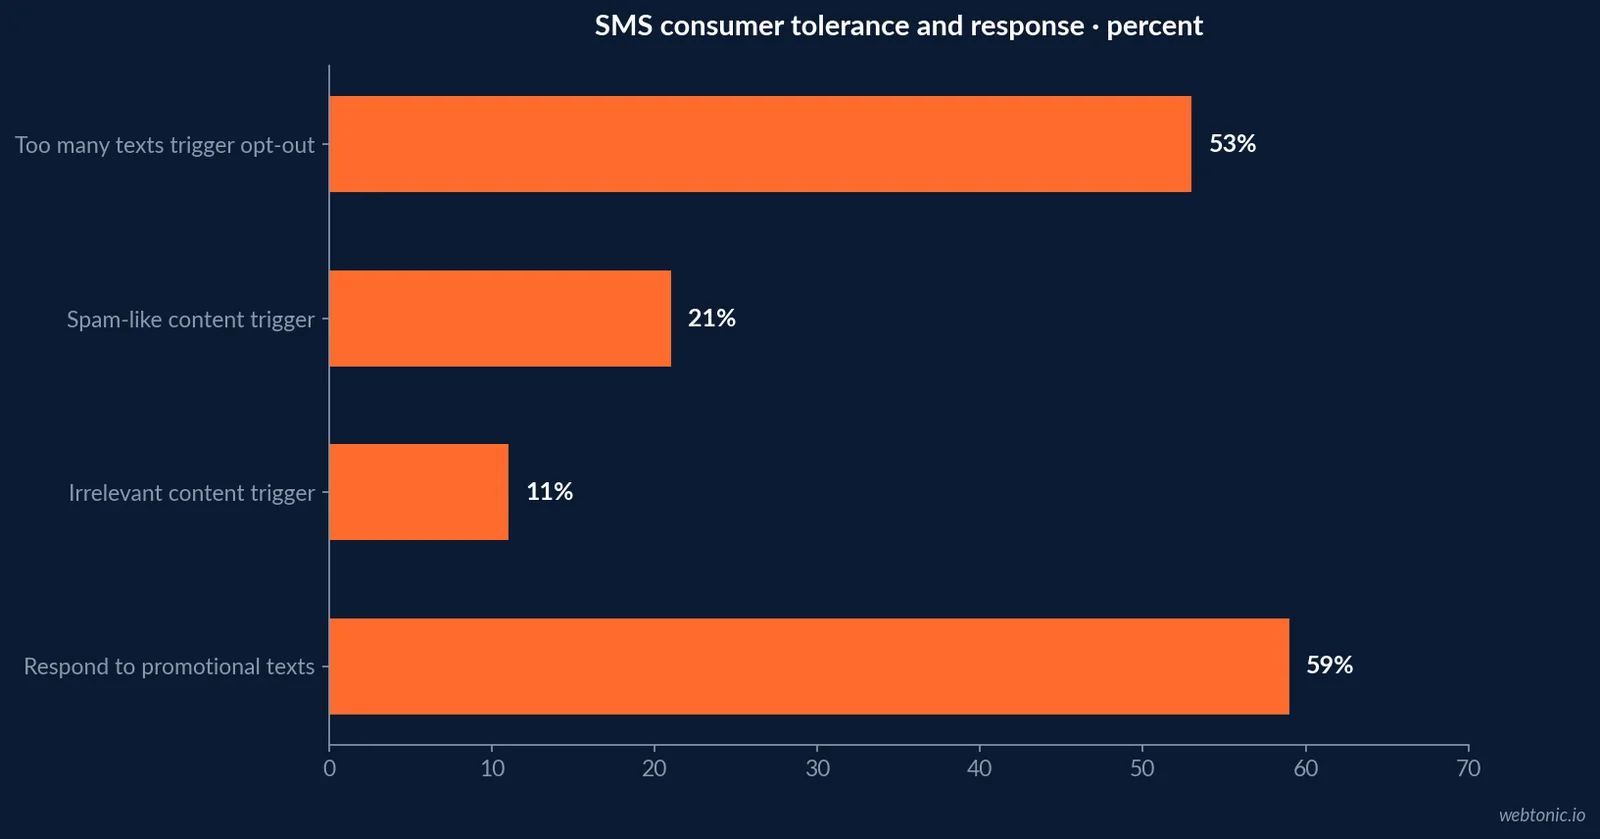
In SimpleTexting’s 2025 survey, 53% cited texting too often as the leading reason to opt out; 21% pointed to spam-like content and 11% to irrelevant messaging. The question records reported reasons, not the proportion of subscribers who actually opted out. Textmagic’s 2025 survey of 1,800 US adults also examined trust, timing and responsiveness, underlining that service expectations are part of the business-text experience. These are reported attitudes, not a measured universal churn curve. Still, the evidence gives operators a clear design constraint: message volume without relevance consumes permission. Budget should cover preference capture, segmentation, campaign QA and reply handling, not just sends. Build a frequency policy across SMS and email so that multiple teams do not over-contact the same person. Review opt-outs and complaints by campaign, cohort and audience. When a promotion fails, avoid responding by sending it again more often. Improve offer, audience fit or timing first.
Research source: Textmagic, State of Business Texting 2025
SMS performance benchmarks are not interchangeable
Klaviyo’s 2024 ecommerce SMS benchmarks draw on more than 3 billion texts, while Postscript publishes ecommerce performance data based on eligible stores and campaign types. A message campaign, welcome flow, abandoned-cart reminder and back-in-stock notification have different intent and conversion opportunity. Click rate may count clicks only among messages with a link; revenue per recipient depends on attribution window and merchant mix. Do not compare platform dashboards without aligning denominators. SimpleTexting’s survey of business owners reports self-described CTR bands; it is not a platform event log. Its 2025 report said 36% of businesses reported average SMS click-through between 21% and 35%. That survey response is not a universal benchmark to impose on campaign dashboards. Compare by segment, send type, opt-in source and destination. For ecommerce, use the platform’s stated benchmark methodology and interpret it as a reference cohort.
Research source: Klaviyo, 2024 SMS benchmarks
Read the relevant comparison below alongside the section above; definitions and populations matter.
| Reason cited | Share | Source / year | Interpretation |
|---|---|---|---|
| Texting too often | 53% | SimpleTexting · 2025 | Reported opt-out reason |
| Spam-like content | 21% | SimpleTexting · 2025 | Reported opt-out reason |
| Irrelevant content | 11% | SimpleTexting · 2025 | Reported opt-out reason |
| Not opt-out rates | — | Survey question | These are reasons named by respondents |
The 2025 ecommerce data: flows and campaigns
Postscript’s 2025 SMS Marketing Benchmarks provide flow and campaign metrics for ecommerce operators, including popup, post-purchase, welcome and win-back use cases. Those numbers should be used with their published metric definitions and cohort boundaries, not generalized to nonprofit, real estate or B2B messaging. Klaviyo’s 2024 report likewise segments by industry and compares SMS with email for ecommerce brands. When using either, note the year and whether the figure reflects a median, average or percentile. Benchmark a specific flow against a matching flow before changing it. A high-intent back-in-stock message is not a fair control for a broad promotional campaign. Maintain the source and calculation method in your reporting notes, because dashboards and published benchmark tools may update their data. The data supports setting a comparison frame, not promising a guaranteed lift.
Research source: Postscript, 2025 SMS marketing benchmarks
SMS and email: coordinated, not competing
Attentive’s 2025 UK SMS and Email Marketing Report surveyed 2,500 UK shoppers and found 97% of surveyed consumers subscribed to a brand’s SMS also engaged with that brand’s emails. It reports that channel overlap rose from 92% in 2024. This is a UK consumer survey and a self-reported relationship; it does not mean 97% of all email subscribers also join SMS. Attentive also found consumers respond to distinct value exchanges: for example, 43% would share a phone number for free shipping and 42% for a free gift in the reported context. Treat the data as a reminder to make sign-up value clear and coordinate messaging. Use SMS for time-sensitive, concise information when it benefits the recipient; use email where detail and education are more appropriate. Suppress redundant promotions and honour channel preferences. A unified calendar prevents two teams from turning a high-engagement subscriber into an over-messaged one.
Research source: Attentive, 2025 UK SMS and email report
Read the relevant comparison below alongside the section above; definitions and populations matter.
| Benchmark set | Evidence base | Best use | Caution |
|---|---|---|---|
| Klaviyo 2024 | 3B+ ecommerce texts | Industry and flow comparisons | Vendor client cohort |
| Postscript 2024 | Eligible ecommerce shops | Flow / campaign context | 2023 measurement period |
| Postscript 2025 | Platform benchmark report | Current ecommerce comparisons | Use definitions in report |
| SimpleTexting 2025 | Consumer + business surveys | Reported behaviour / intent | Self-reported metrics |
What a 2026 SMS budget should include
A responsible SMS budget includes the platform plan, message segments and carrier fees, subscriber acquisition, consent records, creative and copy, integration, analytics, reply operations, testing and compliance review. Price for expected message volume and high seasonality, not just average month. Ask vendors how they define a billable message, whether failed sends incur fees, and what happens when volume crosses tiers. Include the staff time to monitor inbound replies and handle opt-outs. If a program is ecommerce-led, separate campaign sends from automated flows because economics and intent differ. Reserve a small test budget for offer and cadence experiments. Compare revenue and margin attributed to messaging with a consistent window and include discounts, returns and platform costs. No one source in this research establishes a universal SMS platform price or marketing budget; use vendor quotes for your market, list size and usage.
Research source: SimpleTexting, 2025 SMS Marketing Report
Plan frequency around a real customer promise
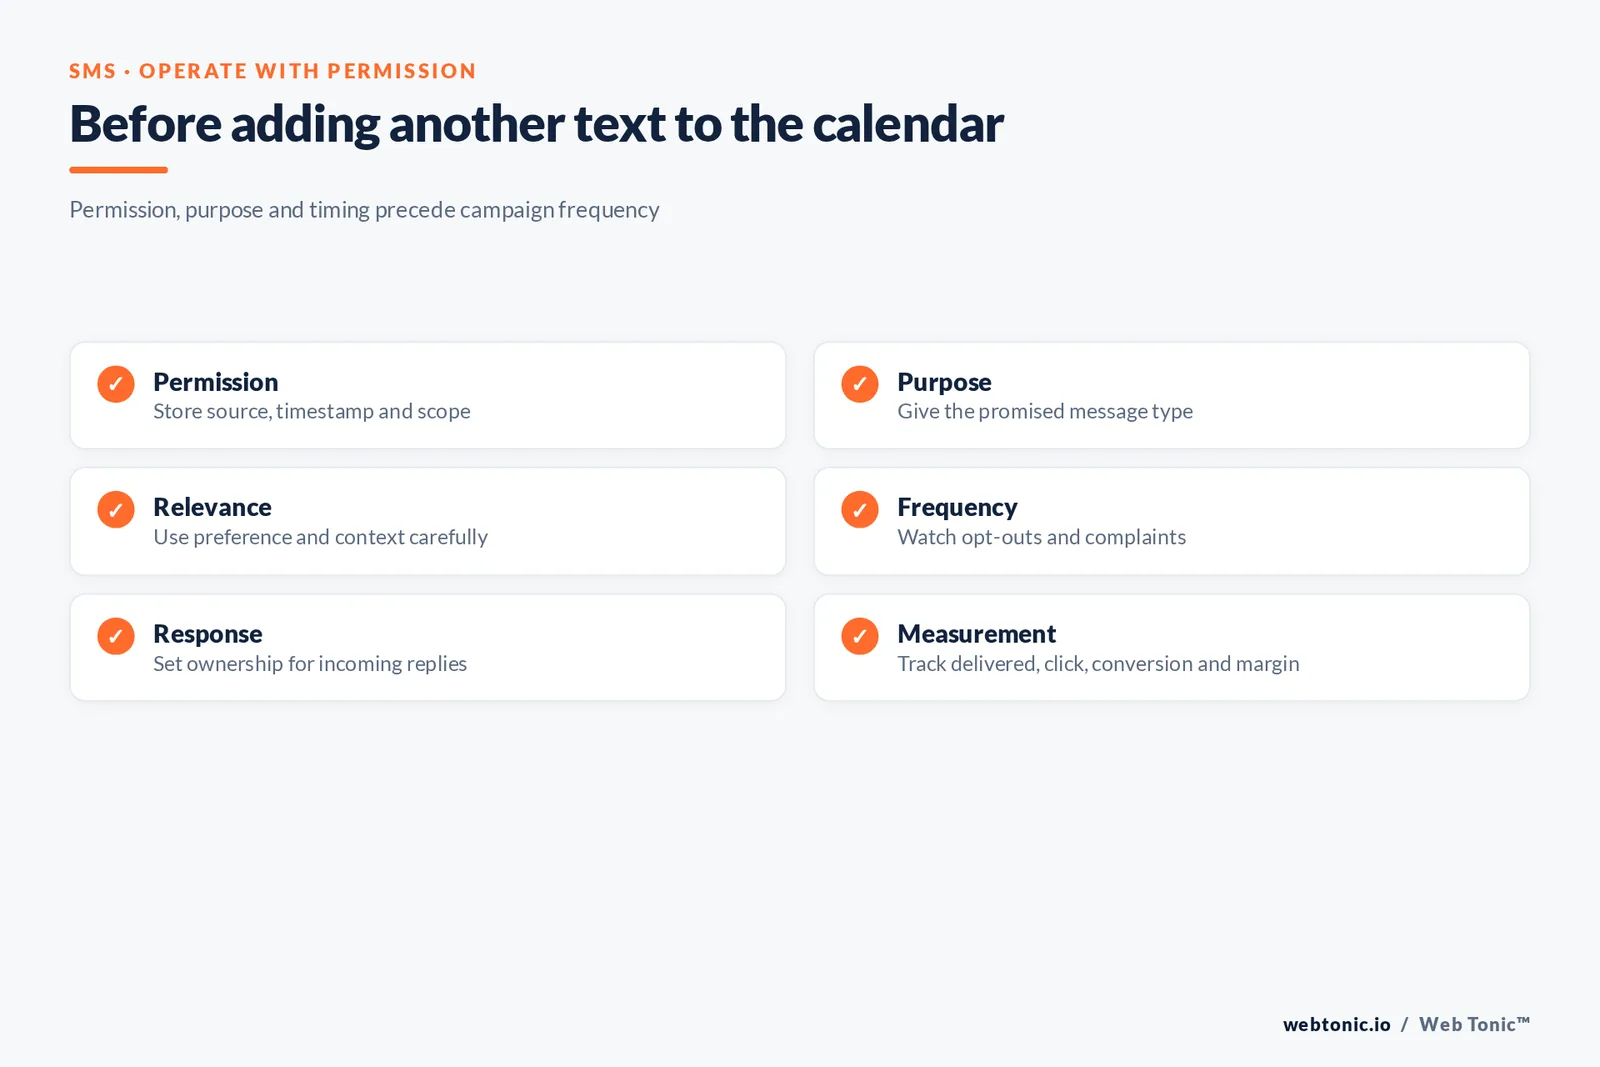
Set frequency by audience preference and service context rather than a generic “texts per week” benchmark. A shipping alert, appointment reminder, product launch and repeated discount may all be delivered through SMS, but recipients may not want the same cadence. State the message type at signup, store consent source and timestamp, and apply suppression across brands, regions and campaign systems as needed. Run a small frequency test with a guardrail for opt-outs and complaints. Use randomized holdouts only when ethically and operationally appropriate; do not withhold essential service communications to create a marketing experiment. Coordinate promotional and transactional streams so a customer is not overwhelmed after an order. Review whether each send provides timely value and whether the destination works on mobile. A quality-focused cadence may mean fewer sends but stronger response and trust.
Research source: CTIA, 2025 Annual Wireless Industry Survey
Read the relevant comparison below alongside the section above; definitions and populations matter.
| Budget line | Include | Check before scale |
|---|---|---|
| Platform and sends | Volume, tiers, carrier fees | Price overage rules |
| Consent and acquisition | Sign-up experience and records | Permission purpose is explicit |
| Integration and analytics | CRM, events and attribution | Events and windows align |
| Operations | Reply coverage, opt-outs, QA | Owner and escalation defined |
| Experiment | Creative and cadence tests | Guardrail for list health |
Interpret industry and regional survey data carefully
SimpleTexting and EZ Texting provide US consumer and business survey evidence. Attentive’s cited 2025 report focuses on UK consumers, while platform benchmark reports generally reflect ecommerce merchants using those tools. CTIA’s 2025 industry survey records US wireless network usage and reports nearly 2.2 trillion texts exchanged in 2024. That includes person-to-person and business messaging and cannot be used to calculate a marketing open rate. Each source has a different unit of analysis: attitudes, business practice, platform events or network traffic. Label the unit, population and year wherever a number appears. Avoid converting network-wide messaging volume into a claim about marketing appetite, or using a single vendor’s customer outcomes as an industry mean. If your business serves a different region, verify local carrier, consent and privacy requirements before applying US-centric practice.
Research source: CTIA, 2025 Annual Wireless Industry Survey
What to watch in the next campaign cycle
A useful dashboard reports delivered messages, clicks where links exist, attributed orders or qualified leads, revenue and contribution margin, opt-outs, complaints, replies and delivery failures. Split by campaign versus flow, audience source and message purpose. Keep attribution windows consistent and consider that a text may assist a purchase without being the last interaction. Track list growth and churn together; net subscriber gain alone can hide an increase in low-quality acquisition. Review frequency and message performance across email and SMS together. Compare actual results to your own baseline before calling a vendor benchmark a win. As new formats evolve, such as richer messaging options, check adoption and device support rather than assuming universal availability. Connect CRM, consent and analytics through a reliable data intelligence foundation. The defining discipline in 2026 remains the same: earn permission, deliver relevance, and measure cost against a clearly defined outcome.
Research source: EZ Texting, 2025 Consumer Texting Behavior Report
Related planning: growth marketing, data intelligence, performance creative, campaign strategy, and talk with Web Tonic.
Useful next steps: growth marketing, data intelligence, performance creative, and contact Web Tonic.
Frequently Asked Questions
How many consumers opt into business text messages?
SimpleTexting’s 2025 survey reported 84% of consumers opted in to receive SMS from businesses. EZ Texting’s separate 2025 Consumer Texting Behavior Report said 86%. The samples and methodology differ, so do not average them as one universal rate.
What makes consumers unsubscribe from SMS marketing?
In SimpleTexting’s 2025 survey, texting too often was the leading cited reason at 53%, followed by spam-like content at 21% and irrelevant content at 11%. These are survey responses, not a measured unsubscribe-rate benchmark.
What is a good SMS marketing click-through rate?
There is no single cross-industry figure in the sources here. Platform benchmarks vary by ecommerce category, message type, audience and how clicks are counted. Compare your own campaigns by objective and use current cohort-specific benchmarks with methodology disclosed.
Should brands increase SMS budgets in 2026?
Only where consent, relevance, operational capacity and incremental economics support it. SimpleTexting found 67% of surveyed businesses planned to increase their 2025 budgets, but stated intent is not proof of return or a 2026 forecast.
How should SMS work with email?
Use each channel for a clear role and preference. Attentive’s 2025 UK survey reported 97% of surveyed SMS subscribers also engaged with brand emails, showing overlap rather than an either-or audience. Coordinate cadence and suppress redundant messages.
Sources
SimpleTexting, 2025 SMS Marketing Report
EZ Texting, 2025 Consumer Texting Behavior Report
Textmagic, State of Business Texting 2025
Klaviyo, 2024 SMS benchmarks
Postscript, 2024 SMS benchmarks
Postscript, 2025 SMS marketing benchmarks
Attentive, 2025 UK SMS and email report
CTIA, 2025 Annual Wireless Industry Survey


