



Table of contents
More than 80% of retail sales still happen inside a physical store, but US retail media spend is closing in on USD 70 billion in 2026 and most of it is not reaching that store. This page benchmarks the 2026 shopper marketing budget against where the sale and the media dollar actually sit.
Key Takeaways
- US retail media ad spend is nearing USD 70 billion in 2026.
- More than 80% of retail sales still happen in physical stores.
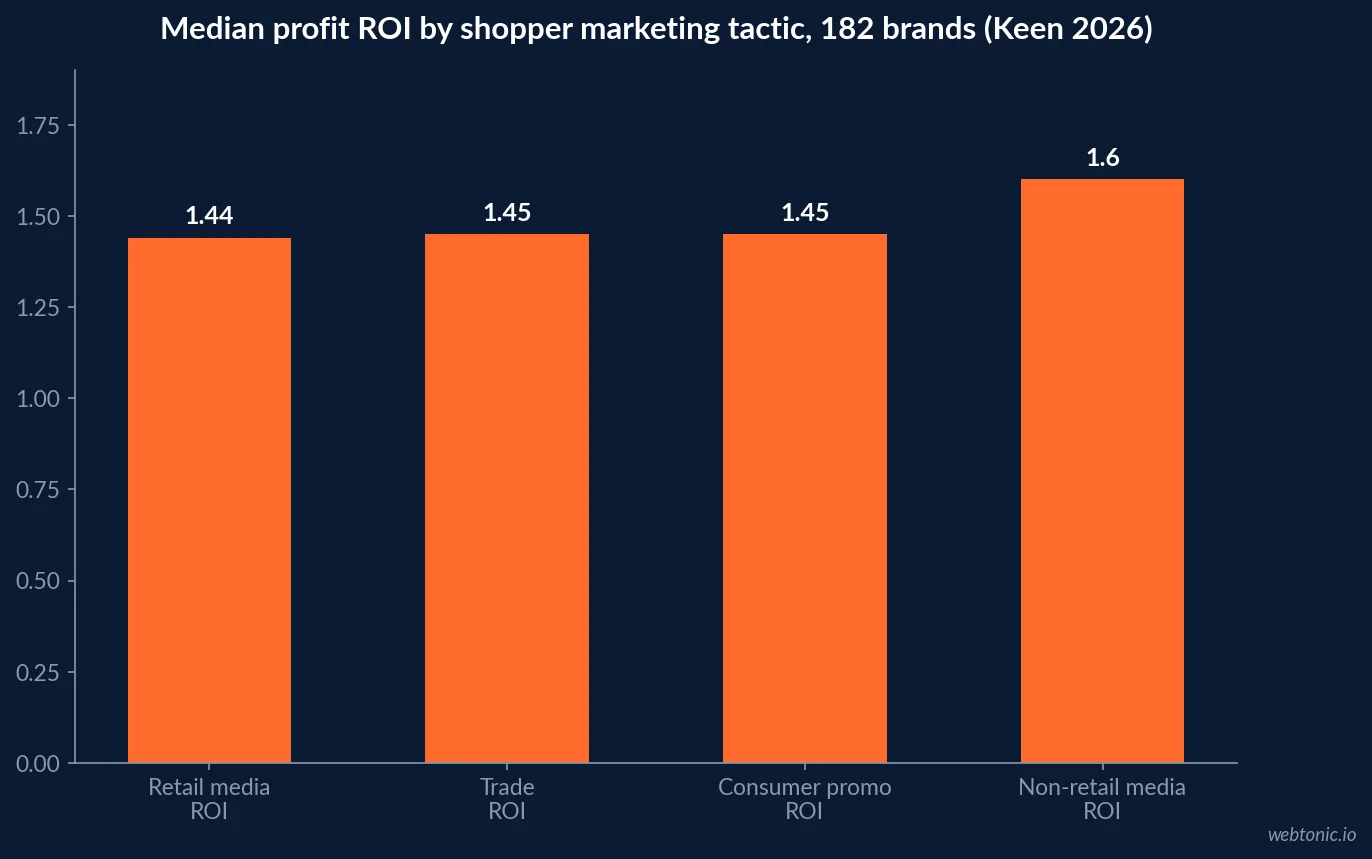
- Retail media's median profit ROI is 1.44, the lowest tactic in a 182-brand benchmark.
- Trade spend returns a median profit ROI of 1.45, edging out retail media.
- Consumer promotion returns 1.45, and non-retail media returns 1.60.
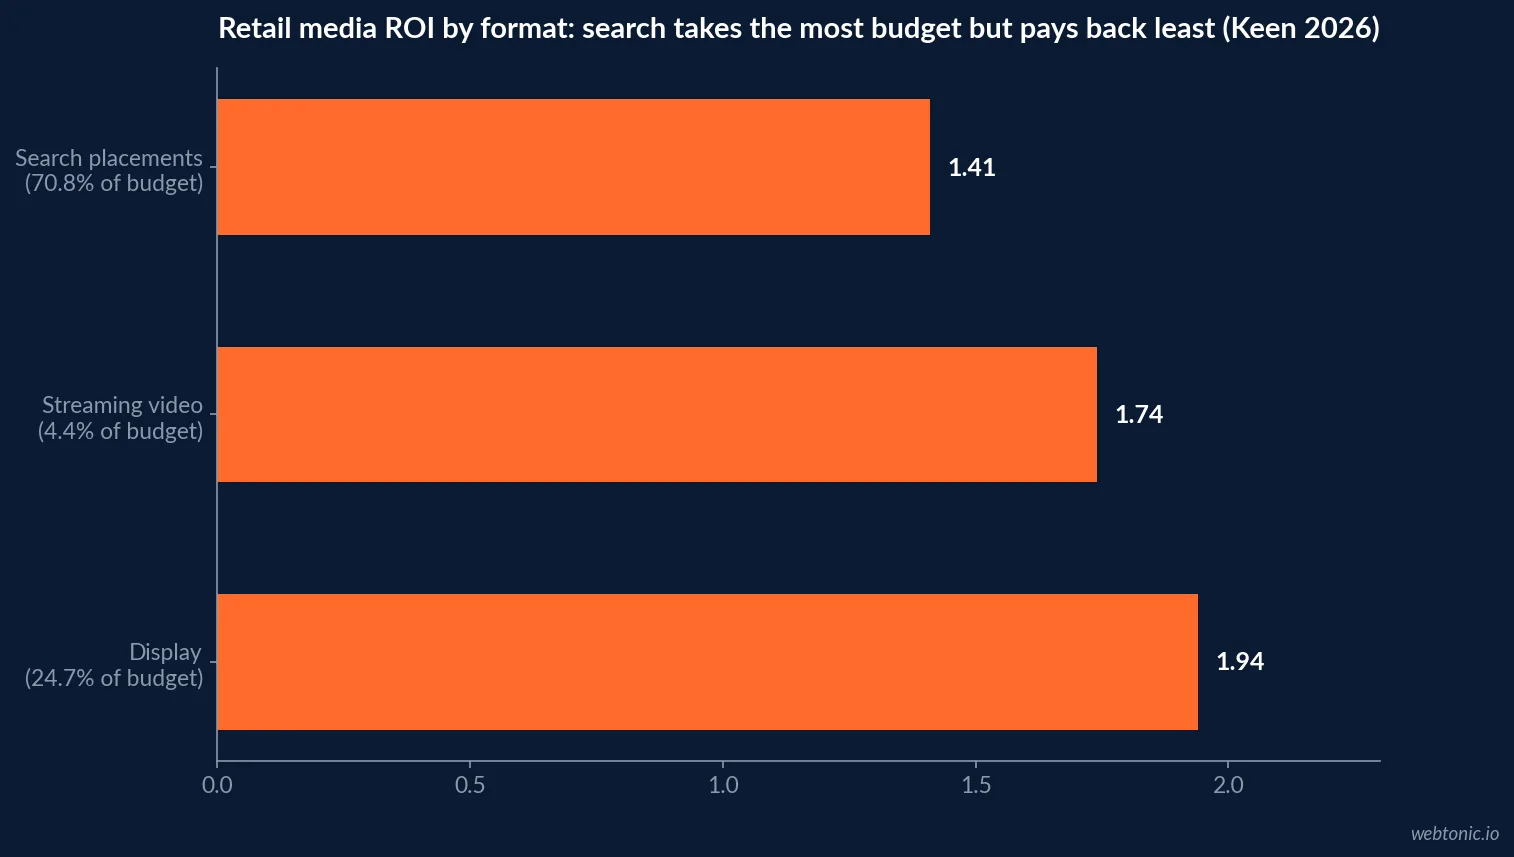
- Search absorbs 70.8% of retail media budget but returns only 1.41 profit ROI.
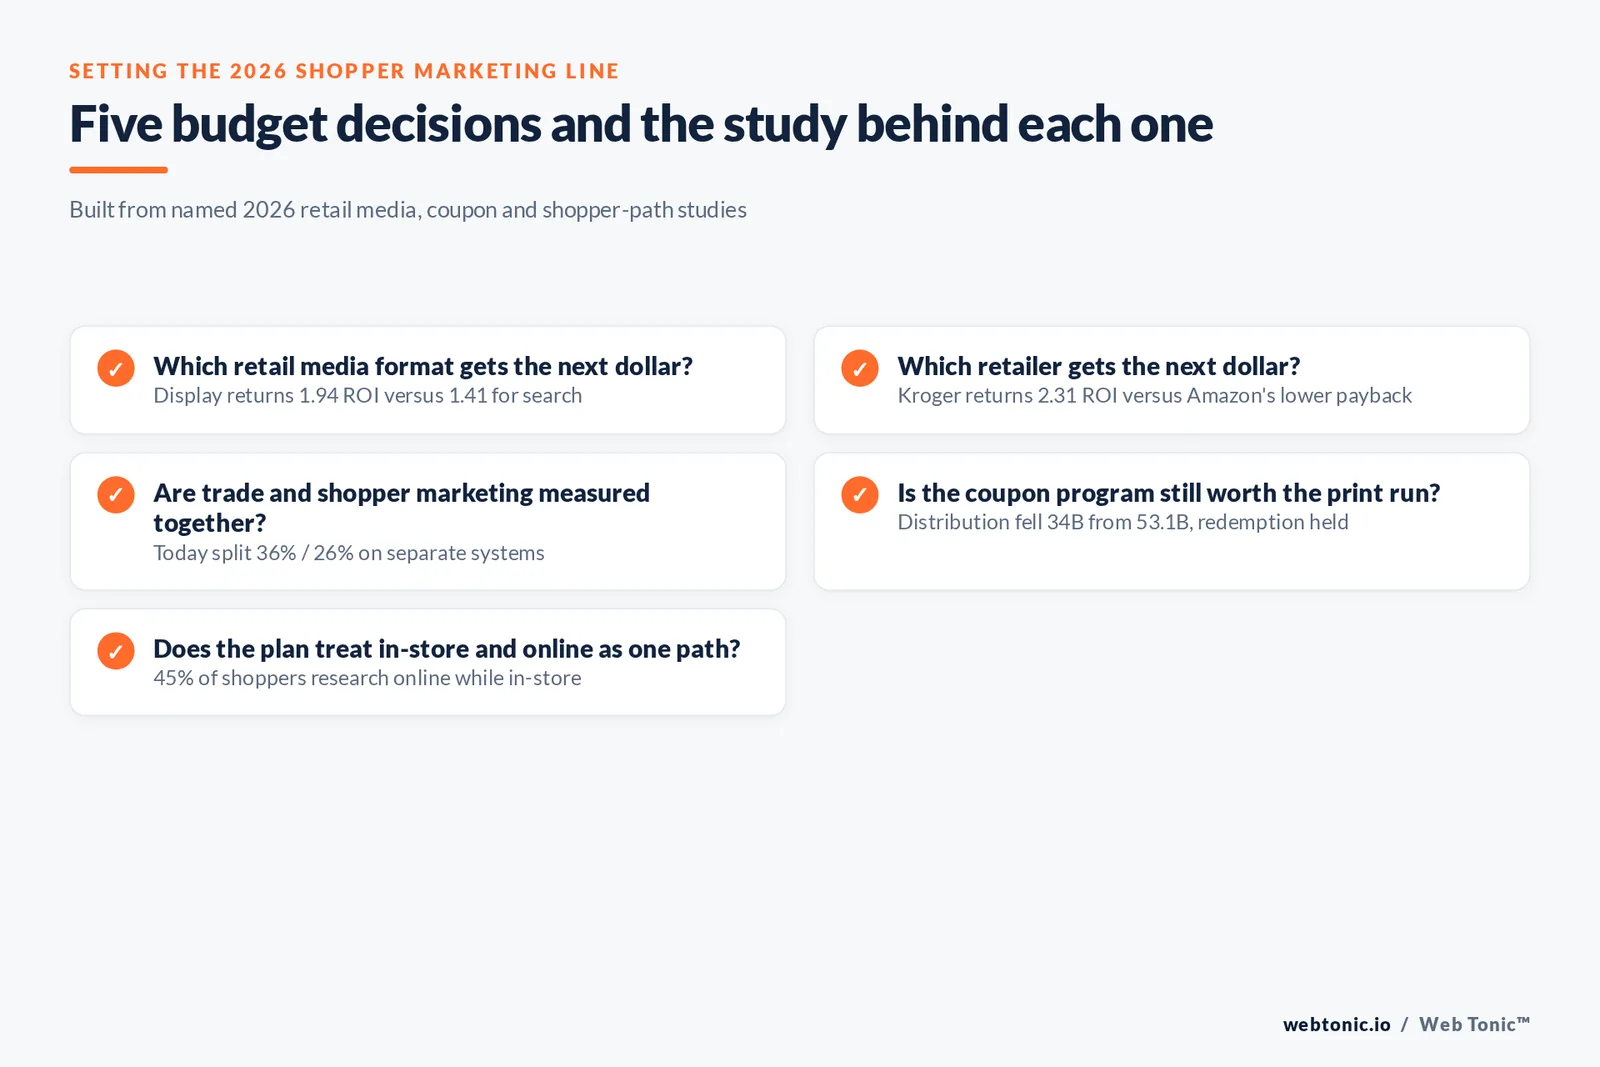
- Display returns 1.94 profit ROI on just 24.7% of retail media budget.
- Amazon captures 48.3% of retail media dollars across the brands measured.
- Kroger and Target deliver higher ROI than Amazon in the same benchmark.
- Coupon distribution fell to 34 billion in 2025, down from 53.1 billion.
- Redemption held closer to flat, 0.81 billion versus 0.87 billion the year before.
- 64% of shoppers use AI tools somewhere in their shopping journey.
- 45% of shoppers research products online while inside a physical store.
- Trade and shopper marketing budgets are split 36% and 26%, measured separately.
- Optimized retail media allocation could support 30%-plus profitable growth against brand plans of roughly 4%.
The gap this budget has to close
Shopper marketing budgets in 2026 are being planned against two numbers that rarely appear on the same slide: where the sale happens, and where the media dollar is spent. Both are measurable, and both point the same direction - toward a mismatch that is now large enough to be a planning input, not a footnote.
| Metric | 2026 figure | Source |
|---|---|---|
| US retail media ad spend | Nearing USD 70 billion | EMARKETER |
| Share of retail sales happening in physical stores | 80%+ | Industry consensus, cited across 2026 retail media coverage |
| Retail media median profit ROI (182 brands) | 1.44 | Keen Retail Media Benchmarks Report |
| Trade spend median profit ROI | 1.45 | Keen Retail Media Benchmarks Report |
| Non-retail media median profit ROI | 1.60 | Keen Retail Media Benchmarks Report |
Inside the retail media budget, the split matters more than the total
Keen's 2026 benchmark, built across 182 brands, found search placements absorb 70.8% of retail media budget yet return a median profit ROI of just 1.41 - the lowest-paying format in the mix. Display, at only 24.7% of budget, returns 1.94, and streaming video, at 4.4% of budget, returns 1.74. Both outperforming formats are growing faster than search but still receive a minority of the dollars.
Retailer concentration compounds the problem: Amazon captures 48.3% of retail media spend across the brands Keen measured, even though Kroger (2.31 ROI) and Target (1.93 ROI) pay back better per dollar in the same dataset. Keen models room for 30%-plus profitable growth in retail media with better allocation, against typical brand plans of only about 4% growth.
| Retail media format | Share of budget | Median profit ROI | Trend |
|---|---|---|---|
| Search (sponsored) | 70.8% | 1.41 | Largest share, lowest-paying format |
| Display | 24.7% | 1.94 | Smaller share, highest-paying format |
| Streaming video | 4.4% | 1.74 | Smallest share, growing fastest |
| Amazon (by retailer) | 48.3% of dollars | Below Kroger/Target | Most concentrated retailer |
| Kroger (by retailer) | n/a in excerpt | 2.31 | Highest-ROI retailer measured |
Trade and shopper marketing are budgeted separately, and that is the operational bug
Retail media spend is commonly split across two internal budget pools - trade at 36% and shopper marketing specifically at 26% - planned and measured on different systems. That split makes it structurally hard to compare a dollar spent through a trade program against a dollar spent on a shopper marketing placement using the same yardstick, which is the same discipline problem our data and analytics practice sees across other channels once MER or blended ROAS gets introduced as a single measurement layer.
What is happening to the promotion budget itself
Inmar's 2026 Promotion Industry Analysis found total coupon distribution fell to 34 billion in 2025, down from 53.1 billion the year prior - a deliberate shift toward smaller, more targeted digital offers rather than mass distribution. Redemption volume held closer to flat, 0.81 billion against 0.87 billion the year before, meaning the offers that remain are converting at a similar rate on far less volume.
That is the promotion-side mirror of the retail media finding above: fewer, better-targeted dollars outperforming a larger undifferentiated spend, both inside and outside the retail media line item.
| Promotion metric | 2025 figure | Prior year | Direction |
|---|---|---|---|
| Total coupon distribution | 34 billion | 53.1 billion | Down, toward precision targeting |
| Total coupon redemption | 0.81 billion | 0.87 billion | Nearly flat despite the volume drop |
| Retail media ad spend (2026) | Nearing USD 70 billion | n/a | Still growing |
The path to purchase the budget actually has to cover
Ryder's 2026 E-Commerce Consumer Study, surveying 1,160 online shoppers, found 64% now use AI tools somewhere in the shopping journey - product search, comparison, or review summaries. Profitero's 2026 Digitally Influenced Shopper Report, covering 5,000 household decision-makers, found 45% of shoppers research products online while physically standing in a store.
A shopper marketing budget that treats in-store and digital as competing channels rather than one continuous path is planning against a shopper who no longer separates the two moments; our performance creative team builds toward that continuous path rather than a single-touchpoint plan.
| Shopper behavior, 2026 | Share | Source |
|---|---|---|
| Use AI tools somewhere in the shopping journey | 64% | Ryder 2026 E-Commerce Consumer Study |
| Research products online while in a physical store | 45% | Profitero 2026 Digitally Influenced Shopper Report |
| Discover brands in physical stores vs. e-commerce | Higher in-store, per multiple 2026 studies | Cross-referenced retail media coverage |
Why the measurement gap is the harder problem than the spend gap
The headline mismatch - physical stores driving most sales while retail media spend concentrates online - gets the attention, but the trade-versus-shopper-marketing measurement split covered above is the harder problem to fix, because it is organizational rather than financial. Two budget owners, reporting on two systems, cannot jointly optimize toward one number even if leadership decides tomorrow to rebalance the dollars. Fixing the split requires a shared measurement layer before it requires a reallocated dollar.
That is also why Keen's finding that brands plan roughly 4% retail media growth while its own model shows room for 30%-plus profitable growth is not really a spend story. It is a measurement story: the brands underspending relative to the model are the ones still running trade and shopper marketing as separate systems that cannot see each other's return.
| Organizational blocker | What it looks like in practice | What fixes it |
|---|---|---|
| Trade vs. shopper marketing split | 36% and 26% of budget, separate systems | One shared profit-ROI measurement layer |
| Retailer-by-retailer silos | Amazon gets 48.3% of spend regardless of ROI rank | Cross-retailer ROI comparison, not share-of-wallet defaults |
| Format defaults | Search gets 70.8% of retail media budget by habit | Marginal-dollar modeling by format, not last year's split |
Setting the 2026 line item
Price the shopper marketing budget against three inputs, not one blended total: the retail-media format mix (favor display and streaming video over search where margin allows), a single measurement system that reconciles trade and shopper marketing rather than reporting them separately, and a promotion strategy that keeps shrinking distribution volume while holding redemption steady. Any 2026 plan built on last year's total spend figure alone is missing all three.
Talk to us if you want your current retail media and trade split modeled against the Keen benchmark above before the next planning cycle.
How the category-level budget mix is actually shifting
MOART's 2026 retail marketing budget allocation analysis puts retail media at roughly 20% to 30% of a typical CPG brand's marketing budget in 2026, up from 15% to 25% in 2025, while traditional advertising continues to decline as a share, especially for brands with younger-skewing shopper bases. Influencer spend holds at roughly 10% to 20%, stable in size but shifting toward verticalized mid-tier creators rather than broad-reach names.
That directional read matches the Keen benchmark above: retail media keeps growing as a share of budget even where its median ROI trails trade and non-retail media, which is exactly the kind of mismatch a 2026 plan should interrogate rather than extrapolate.
| Budget category (CPG brand) | 2026 share of marketing budget | 2025 share | Direction |
|---|---|---|---|
| Retail media | 20%-30% | 15%-25% | Growing |
| Influencer/creator | 10%-20% | Similar range | Stable size, shifting mix |
| Traditional advertising (TV, print) | Declining | Higher | Falling, especially with younger shoppers |
Frequently Asked Questions
What is shopper marketing, and how is it different from retail media?
Shopper marketing is the broader discipline of influencing a purchase decision at or near the point of sale, whether that is a physical shelf, a retailer's app, or a product page. Retail media is one channel inside it - paid placements bought directly from a retailer's own media network. Keen's 2026 benchmark found brands already run those two budgets as separate line items - trade at 36%, shopper marketing at 26% - measured on different systems, which is exactly the planning problem this page addresses.
How big is retail media spend in 2026, and does it match where sales happen?
EMARKETER projects US retail media ad spending will come close to USD 70 billion in 2026. More than 80% of retail sales still happen in physical stores, which is the gap most 2026 shopper marketing plans have not yet closed: media budgets have moved to digital retail placements faster than the sales mix has.
Does retail media actually pay back better than trade or promotion spend?
Not uniformly. Keen's 2026 benchmark across 182 brands found retail media's median profit ROI at 1.44, the lowest of the tactics it measured, behind trade (1.45), consumer promotion (1.45), and non-retail media (1.60). Within retail media itself, display (1.94 ROI) and streaming video (1.74) outperform search placements (1.41), even though search still absorbs 70.8% of retail media budget.
Are digital coupons still worth budgeting for in 2026?
Volume is down but engagement is up. Inmar's 2026 Promotion Industry Analysis found total coupon distribution fell to 34 billion in 2025 from 53.1 billion the year before, while redemption held closer to flat at 0.81 billion versus 0.87 billion - meaning brands are distributing far fewer, better-targeted offers and getting a similar number of redemptions out of them.
How much does AI change the shopper's actual path to purchase?
Materially, and it now spans in-store too. Ryder's 2026 E-Commerce Consumer Study found 64% of shoppers use AI tools somewhere in their shopping journey, and Profitero's 2026 Digitally Influenced Shopper Report found 45% of shoppers research products online while physically standing in a store. A shopper marketing budget that only covers the in-store moment or only the online moment is missing the one that actually decides the purchase.
Sources
EMARKETER - Retail Media Ad Spending Forecast H1 2026
EMARKETER - US Retail Media Ad Spending Will Near USD 70 Billion in 2026
Keen - Retail Media Benchmarks Report, 2026
Inmar - 2026 Promotion Industry Analysis
Ryder - 2026 E-Commerce Consumer Study
Profitero - 2026 Digitally Influenced Shopper Report
MOART - 2026 Retail Marketing Budget Allocation


