Table of contents
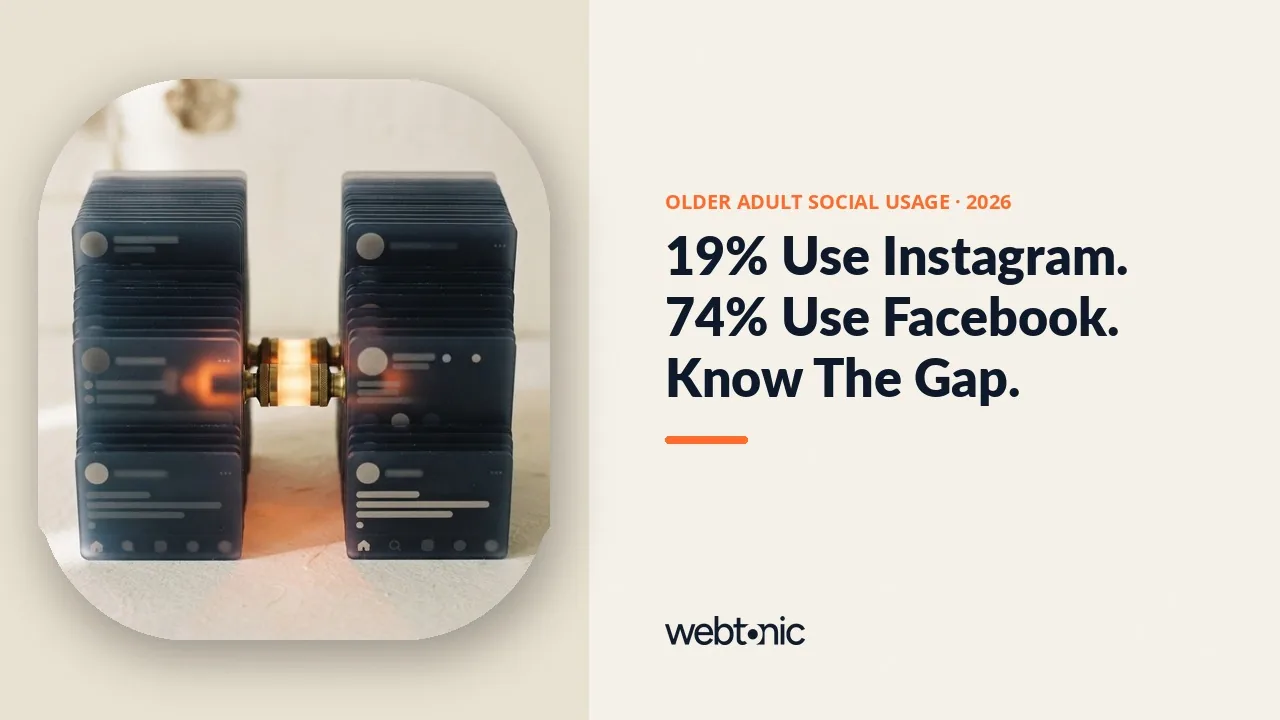
Only 19% of adults 65 and older use Instagram and 12% use TikTok, against 40% and 30% for adults 50 to 64, per Pew Research's 2025 survey. That gap is the single most important fact behind any senior living social media strategy: the platforms marketing teams reach for by default are largely not reaching residents, and the real audience is the adult child researching care on their behalf. This page separates what the data actually supports platform by platform, rather than treating "social media marketing" as one undifferentiated channel with a single expected outcome.
Key Takeaways
- 57% of adults 65+ use Facebook, the highest-reach platform for this age band after YouTube (Pew Research).
- Only 19% of adults 65+ use Instagram, against 40% of adults 50-64 (Pew Research).
- Only 12% of adults 65+ use TikTok, against 30% of adults 50-64 (Pew Research).
- 64% of adults 65+ use YouTube, their single highest-reach platform (Pew Research).
- 74% of adults 50-64 use Facebook, the platform most likely to reach the actual buyer (Pew Research).
- 59 million family caregivers of adults are the real audience behind most senior living social content (AARP).
- $70.81 average cost per lead on assisted living Facebook and Instagram campaigns (LocaliQ).
- 1.90% click-through rate on the same subcategory, the highest of any LocaliQ healthcare vertical.
- 90% senior housing occupancy crossed in July 2026, raising the stakes on every social touchpoint (NIC MAP).
- 95% of senior living employees would stay in a role that felt meaningful, relevant to workforce-recruitment content (Argentum).
- 41,465 assisted living communities compete for attention in the same feed (AHCA/NCAL).
The usage gap, by platform and age band
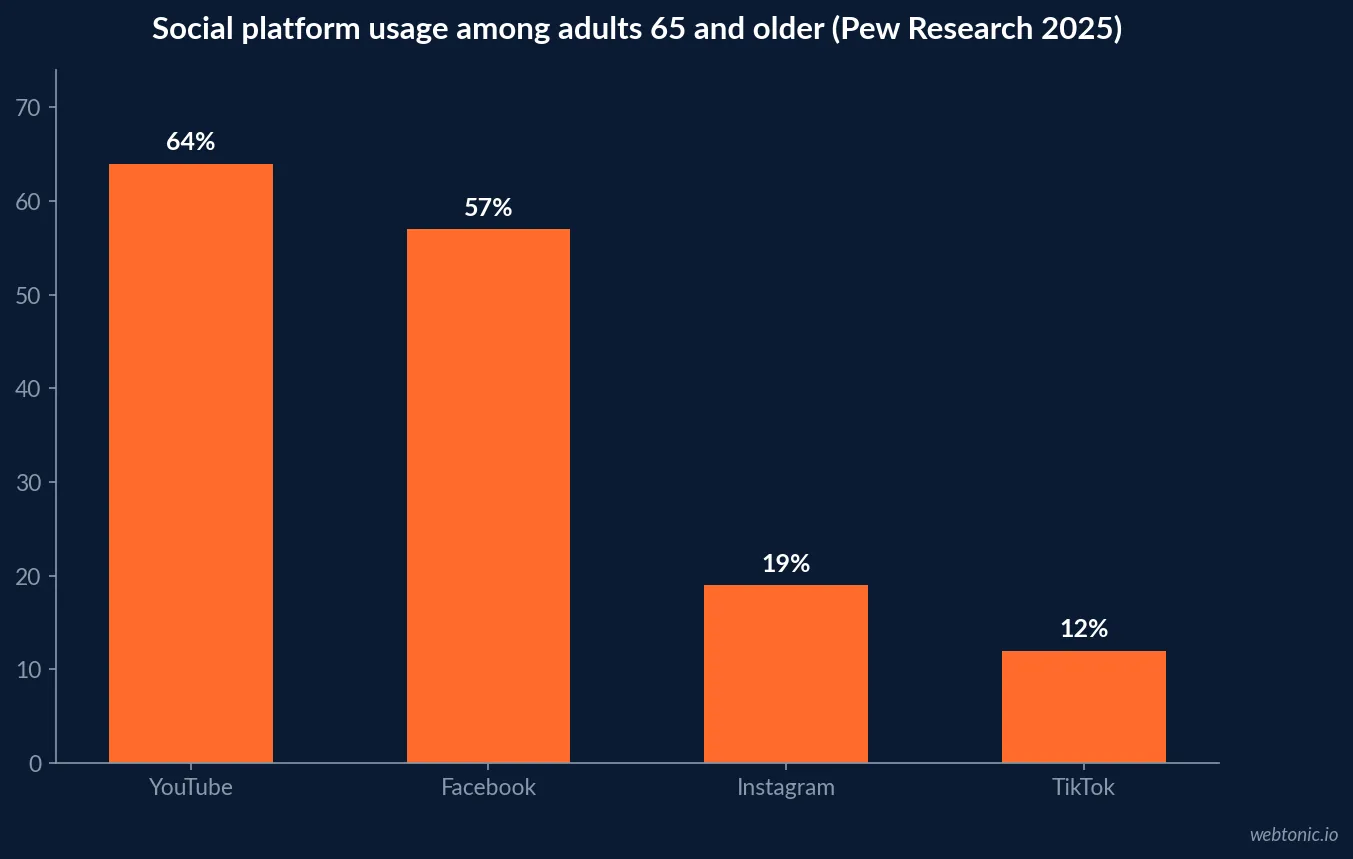
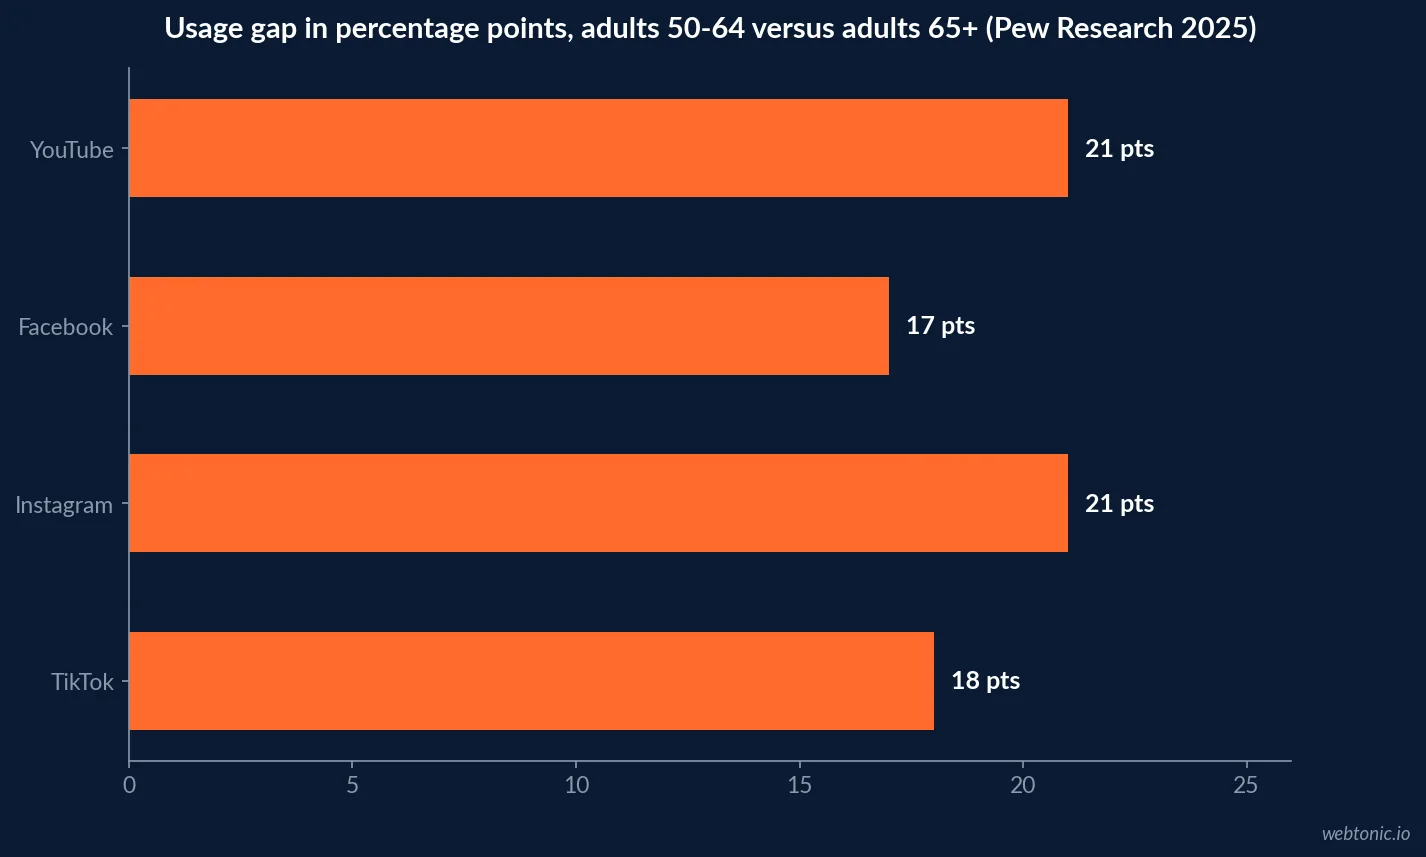
Pew Research Center's 2025 Social Media Fact Sheet, based on a nationally representative survey of 5,022 U.S. adults conducted February to June 2025, breaks platform usage out by age. The gap between adults 65 and older and adults 50 to 64 - the band most likely to include an adult child researching senior living - is wide on every platform except YouTube and Facebook, and largest on the visually-driven platforms most social teams default to.
| Platform (Pew Research 2025) | Adults 50-64 | Adults 65+ | Gap |
|---|---|---|---|
| YouTube | 85% | 64% | 21 pts |
| 74% | 57% | 17 pts | |
| 40% | 19% | 21 pts | |
| TikTok | 30% | 12% | 18 pts |
| 30% | 20% | 10 pts | |
| X (formerly Twitter) | 16% | 10% | 6 pts |
Why Facebook and YouTube carry the organic strategy
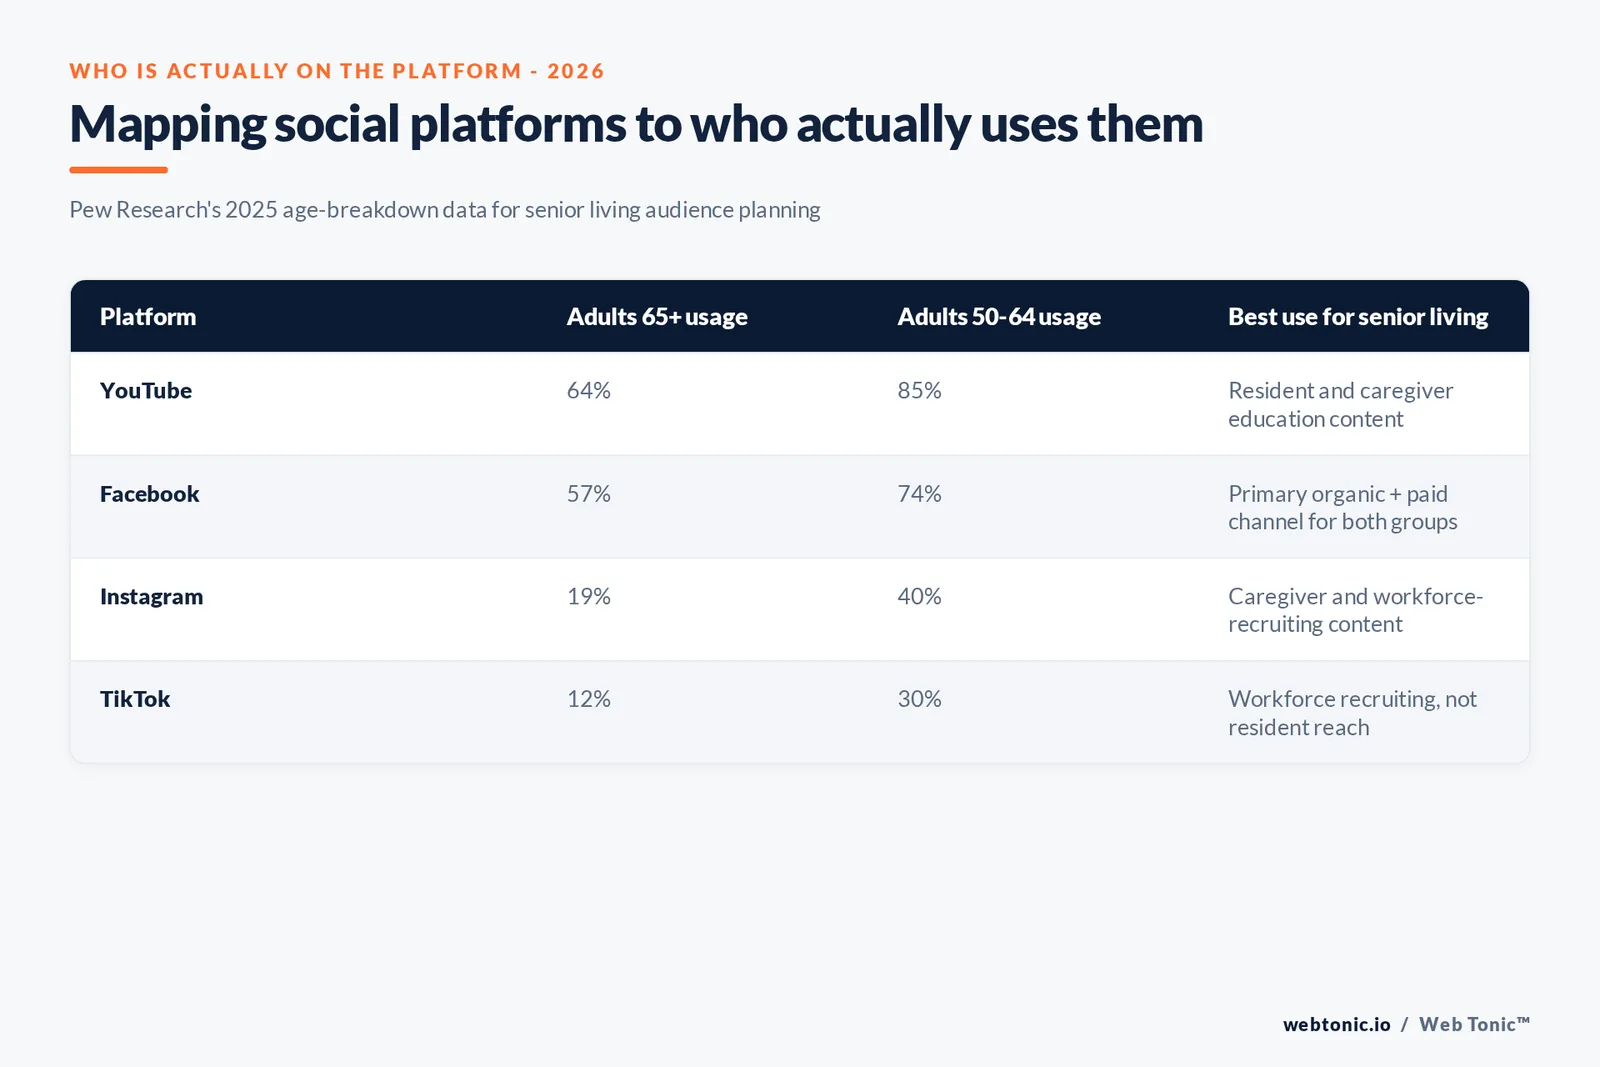
Facebook and YouTube are the only two platforms in Pew's data where the 65-plus band clears 50% usage, which makes them the only channels where organic content has a realistic chance of reaching a current or prospective resident directly, rather than only the family researching on their behalf. Even there, usage sits meaningfully below the 50-to-64 band's own numbers, so content built primarily for the resident still reaches fewer people than content built for the caregiver searching for them.
| Platform | Adults 65+ usage | Adults 50-64 usage | Reach gap |
|---|---|---|---|
| YouTube | 64% | 85% | 21 pts |
| 57% | 74% | 17 pts |
The demand growth behind the audience
Both audiences are growing at once. U.S. Census Bureau projections put the share of the U.S. population 65 and older rising from 18.9% in 2025 to 23.4% by 2060, which grows the residents-and-prospects side of the audience over time even as their current social usage stays comparatively low. Meanwhile the 50-to-64 caregiver band that supplies most of today's clicks and shares is itself aging into the 65-plus bracket over the same period, which argues for building organic content habits now on Facebook and YouTube rather than assuming the current usage gap is permanent. A community that builds a genuine Facebook following of engaged families today keeps that relationship as those families age, rather than starting from zero once the current 50-to-64 cohort becomes the 65-plus one this data describes.
| Demand signal | Figure | Source |
|---|---|---|
| U.S. population 65 and older, 2025 | 18.9% | U.S. Census Bureau |
| Projected 65-and-older share by 2060 | 23.4% | U.S. Census Bureau |
| Family caregivers of adults, current | 59 million | AARP, 2026 update |
The real audience: adult children and caregivers
The practical implication is that most senior living social content is being read, shared and acted on by someone other than the person who would move in. AARP's Valuing the Invaluable 2026 update counts 59 million family caregivers of adults in the U.S., contributing an estimated 49.5 billion hours of unpaid care in 2024. That population sits squarely inside the 50-to-64 band where Facebook, Instagram and TikTok usage all run meaningfully higher than among people 65 and older - exactly the group a senior living page's organic content and paid social should be built to reach.
| Audience fact | Figure | Source |
|---|---|---|
| Family caregivers of adults, U.S. | 59 million | AARP, 2026 update |
| Unpaid caregiving hours provided in 2024 | 49.5 billion | AARP, 2026 update |
| Average value per caregiving hour | $20.41 | AARP, 2026 update |
| Adults who are family caregivers overall | ~1 in 4 | AARP Caregiving in the US 2025 |
What paid social costs for this audience
When organic reach is not enough, LocaliQ's own healthcare advertising benchmarks put the Assisted Living, Elder & Home Care Services subcategory at a $70.81 average cost per lead and a 1.90% click-through rate on Facebook and Instagram lead campaigns - the highest CTR of any of the sixteen healthcare subcategories LocaliQ tracks, though it remains a healthcare-wide vertical figure rather than a senior-living-only study, and it bundles home care agencies alongside residential communities.
| Metric (LocaliQ, Assisted Living subcategory) | Social ads | Search ads |
|---|---|---|
| Average CTR | 1.90% | 6.35% |
| Average CPC | $1.00 | $6.30 |
| Average cost per lead | $70.81 | $74.44 |
| Average monthly spend | $626 | $1,250 |
How this compares to the all-industry paid social baseline
Read against a cross-industry baseline, assisted living's social numbers are unusual in a good way. WordStream's 2026 benchmarks, drawn from a much larger, mostly search-focused dataset across 23 industries, are not directly comparable metric-for-metric with LocaliQ's social figures, but they confirm the general pattern: a $70.81 cost per lead and 1.90% click-through rate sit within a normal range for a considered, infrequent-purchase category, neither a bargain nor an outlier compared to what health-adjacent verticals typically see across paid channels broadly.
| Reference point | Figure | Source | Comparability note |
|---|---|---|---|
| Assisted living social CPL | $70.81 | LocaliQ, healthcare vertical | Own healthcare-vertical dataset |
| All-industry average CPL, search | $66.69 | WordStream 2026 | Cross-industry, search only, labeled as such |
Why competitive density raises the bar on content quality
The audience gap would matter less if the market were thin, but it is not. AHCA/NCAL's 2026 fast facts count 41,465 assisted living communities nationwide, and NIC MAP data shows senior housing occupancy crossing 90% across the 31 Primary Markets in July 2026. A tight, competitive feed for a shrinking pool of open units means generic "come tour our beautiful community" content is competing against thousands of near-identical posts; specific, verifiable content - a named amenity, a real resident story with consent, an actual cost figure - carries more weight in that environment than volume alone. That density argument applies with even more force to paid social, where every impression is bought rather than earned, and a generic creative running against 41,465 nearby alternatives buys attention at a steeper discount than content built around a specific, checkable claim.
Where workforce content fits
Social media for senior living is not only a resident-acquisition channel. Argentum and Activated Insights' 2026 Perceptions of Careers in Senior Living report, drawing on nearly 200 senior living professionals, found that 95% would stay in a role where they felt their work made a difference. Culture and workforce content aimed at recruiting nurses, aides and caregivers competes in the same TikTok and Instagram feeds where resident-facing content underperforms on reach - making workforce recruiting a legitimate, data-backed reason to maintain a presence on platforms where 65-plus usage is thin.
A platform-by-audience plan
- Facebook and YouTube: organic content aimed at both residents and the 50-64 caregiver band, since both platforms clear majority usage in each group.
- Instagram and TikTok: budget these primarily as caregiver and workforce-recruiting channels, not resident-reach channels, given the 65-plus usage sits at 19% and 12% respectively.
- Paid social lead campaigns: benchmark against LocaliQ's own $70.81 cost-per-lead and 1.90% CTR figures for the assisted living subcategory, not a generic all-industry number.
- Content specificity over volume: with 41,465 competitors and occupancy above 90%, verifiable, specific content earns more attention per post than a higher posting cadence alone.
The same plan should assign a clear owner per platform rather than treating "social media" as one undifferentiated task. A community that hands Facebook, Instagram and TikTok to the same person with the same content calendar is effectively asking one strategy to serve three different audiences with three different usage patterns, which is a common reason engagement plateaus even as posting frequency increases. The practical test is whether a community's own sales counselors would recognize a week's worth of social content as their own voice, rather than a generic template copied across every community in a portfolio without adjusting for the audience each platform actually reaches.
Where this fits with the rest of the funnel
Social sits alongside paid search and email in most senior living funnels; see our data on whether Facebook ads are worth it and our list of Facebook ads agencies for the wider paid social context. A platform audit is the fastest way to check whether your own budget matches where your actual audience spends time.
Frequently Asked Questions
Do older adults actually use social media?
Some do, but far less than younger age bands, and it varies sharply by platform. Pew Research's 2025 survey of 5,022 U.S. adults found 57% of adults 65 and older use Facebook, but only 19% use Instagram and 12% use TikTok. YouTube is the highest-reach platform among this group at 64%. The honest read is that a senior living organic social strategy built around Instagram or TikTok is largely not reaching current residents at all.
Who is the real audience for senior living social media?
Mostly adult children aged roughly 50 to 64, who show meaningfully higher usage across every major platform Pew tracks: 74% use Facebook, 40% use Instagram and 30% use TikTok, against 57%, 19% and 12% respectively for the 65-plus band. AARP's Valuing the Invaluable 2026 update counts 59 million family caregivers of adults, many of whom sit in this exact age range and are the ones actually researching and sharing content about a parent's care options.
What does it cost to reach this audience on paid social?
LocaliQ's own healthcare-vertical benchmarks list the Assisted Living, Elder & Home Care Services subcategory at a $70.81 average cost per lead and a 1.90% click-through rate on Facebook and Instagram lead campaigns - the highest CTR of any healthcare subcategory LocaliQ tracks, though it is a healthcare-wide vertical figure rather than a senior-living-only study.
Should senior living communities use TikTok?
Only 12% of adults 65 and older use TikTok per Pew Research, but 30% of adults 50 to 64 do, so a TikTok presence is realistically a caregiver-recruitment and workforce-recruitment play, or a way to reach younger family members researching on a parent's behalf, not a channel for reaching residents directly. Communities building TikTok content should frame it around that audience explicitly rather than assuming residents are watching.
What social content actually works for senior living, based on the data?
No published study isolates senior living organic social content performance specifically, so the honest answer is to build around the platforms and age bands the data actually supports: Facebook and YouTube content aimed at the 50-to-64 caregiver band, workforce and culture content on any platform to support recruiting (Argentum's 2026 data shows 95% of senior living employees would stay in a role where they felt their work mattered), and paid social budgeted against LocaliQ's own $70.81 cost-per-lead figure rather than a vanity follower-growth goal.
Sources
Pew Research Center - Social Media Fact Sheet, 2025
AARP - Valuing the Invaluable, 2026 update
LocaliQ - Healthcare advertising benchmarks (search, display, social)
WordStream - 2026 Google Ads industry benchmarks
AHCA/NCAL - Assisted Living Facts and Figures, 2026
NIC - Senior housing occupancy trends, 2026
Argentum & Activated Insights - Perceptions of Careers in Senior Living, 2026
U.S. Census Bureau - An Aging World, 2026 projections