Table of contents

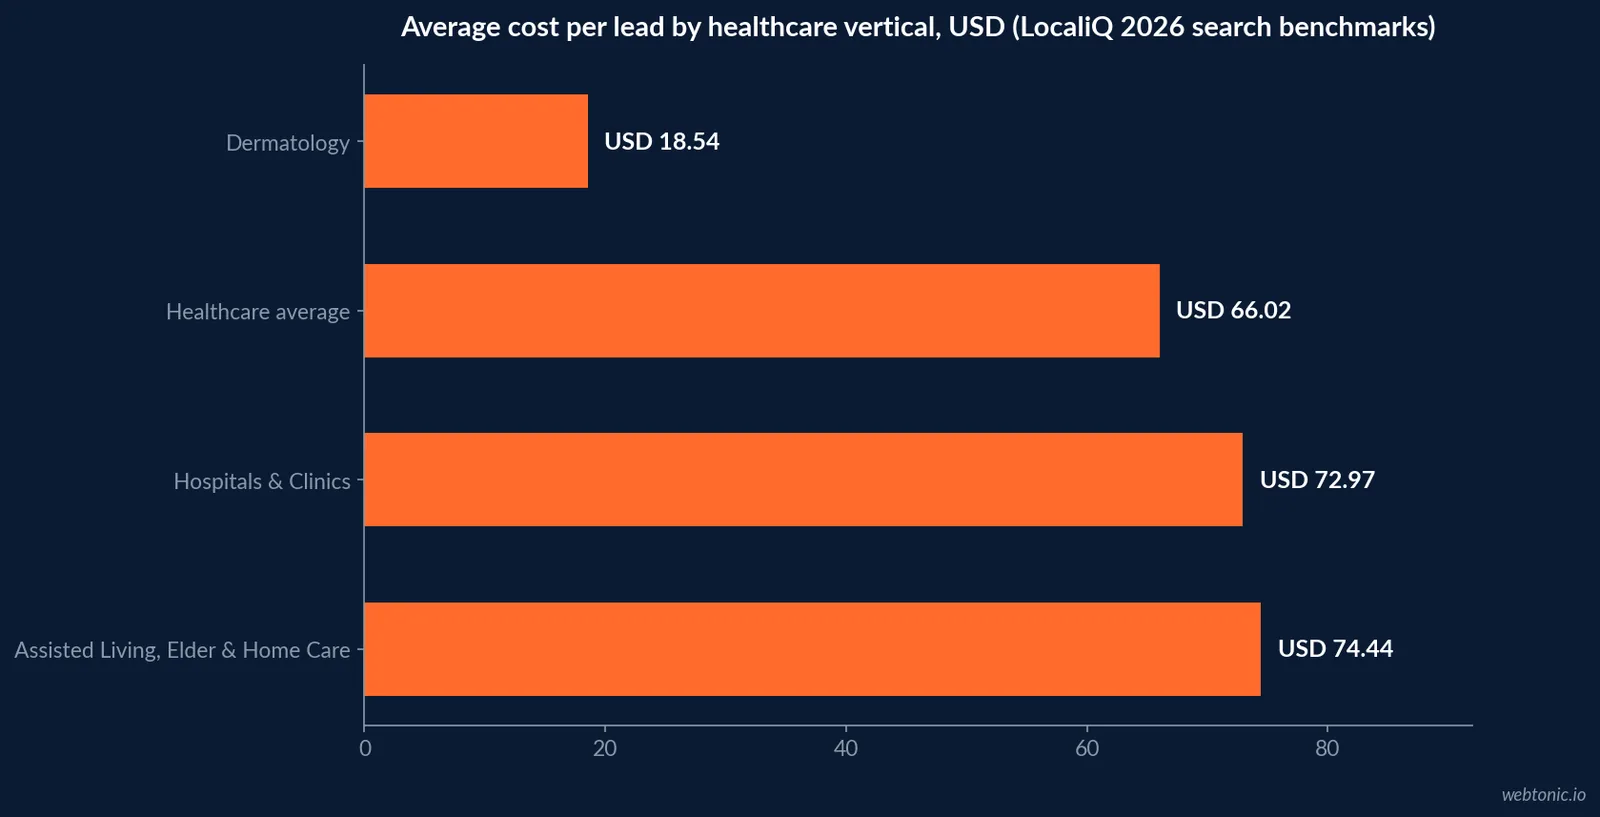
Assisted living Google Ads campaigns average USD 74.44 per lead in 2026, above the USD 66.02 healthcare-wide average, while converting at a lower 5.51% rate. This page isolates the Assisted Living, Elder & Home Care Services vertical from LocaliQ's 2026 healthcare search advertising benchmarks and reads the gaps against occupancy data from NIC and caregiver-behavior data from A Place for Mom.
Key Takeaways
- Assisted living cost per lead averages USD 74.44 in 2026.
- That is above the USD 66.02 healthcare-wide average across 16 specialties.
- Assisted living click-through rate is 6.35%, near the 6.07% healthcare average.
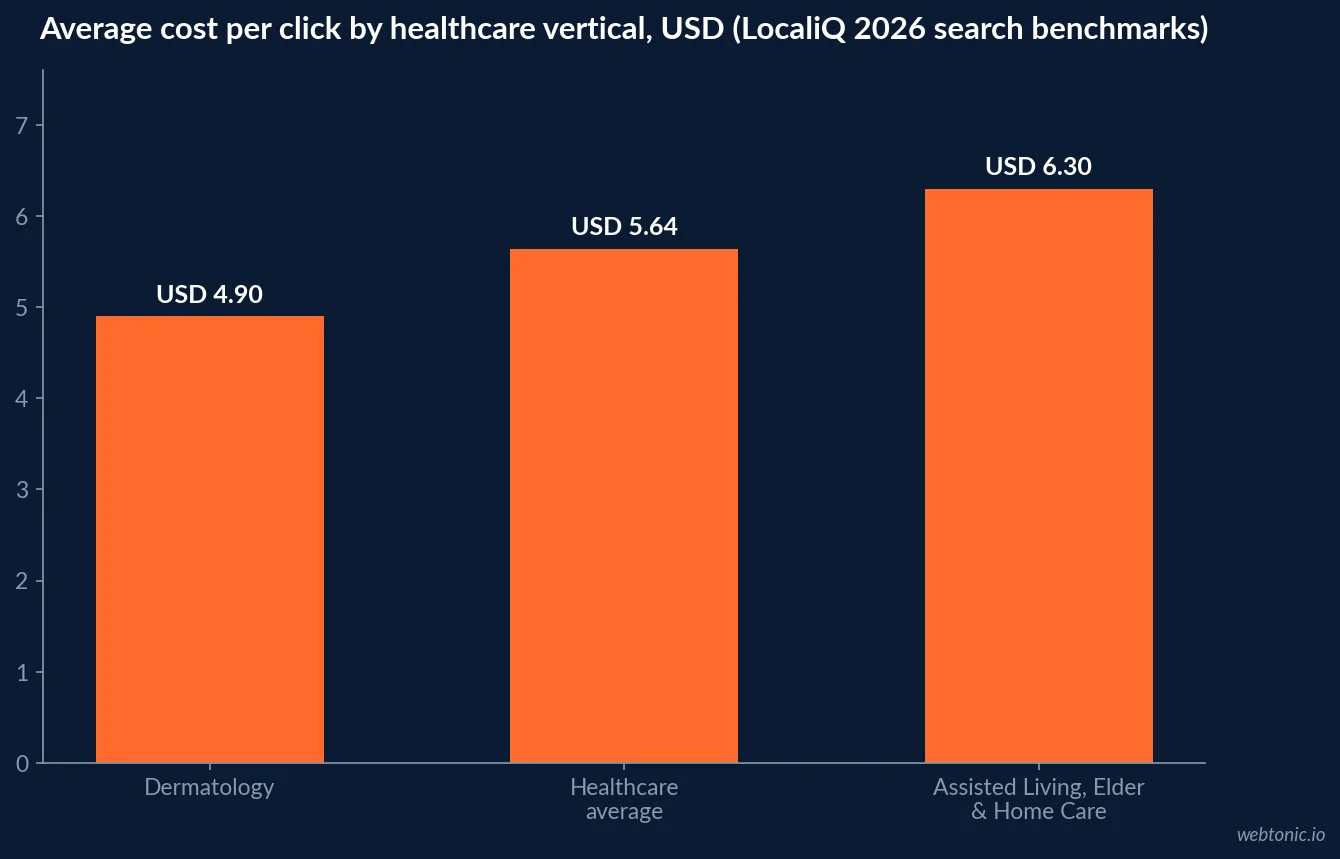
- Assisted living cost per click is USD 6.30, above the USD 5.64 healthcare average.
- Assisted living conversion rate is 5.51%, below the 8.09% healthcare average.
- Assisted living CPC rose 32% year over year, one of the largest increases measured.
- Overall healthcare CPC rose about 6% year over year to USD 5.64.
- Overall healthcare CTR fell about 12% year over year to 6.07%.
- Senior housing occupancy hit 89.9% in Q2 2026, the highest since 2015.
- Assisted living occupancy specifically sits at 88.4%.
- New senior housing supply grew under 1% annually for a fifth straight quarter.
- More than two-thirds of caregivers search 60 days or less before finding care.
- 66% of the family caregivers behind these searches are women.
- Overall healthcare cost per lead fell about 6% year over year to USD 66.02.
- There are roughly 41,465 assisted living communities competing for those clicks.
The headline benchmarks, isolated from the healthcare average
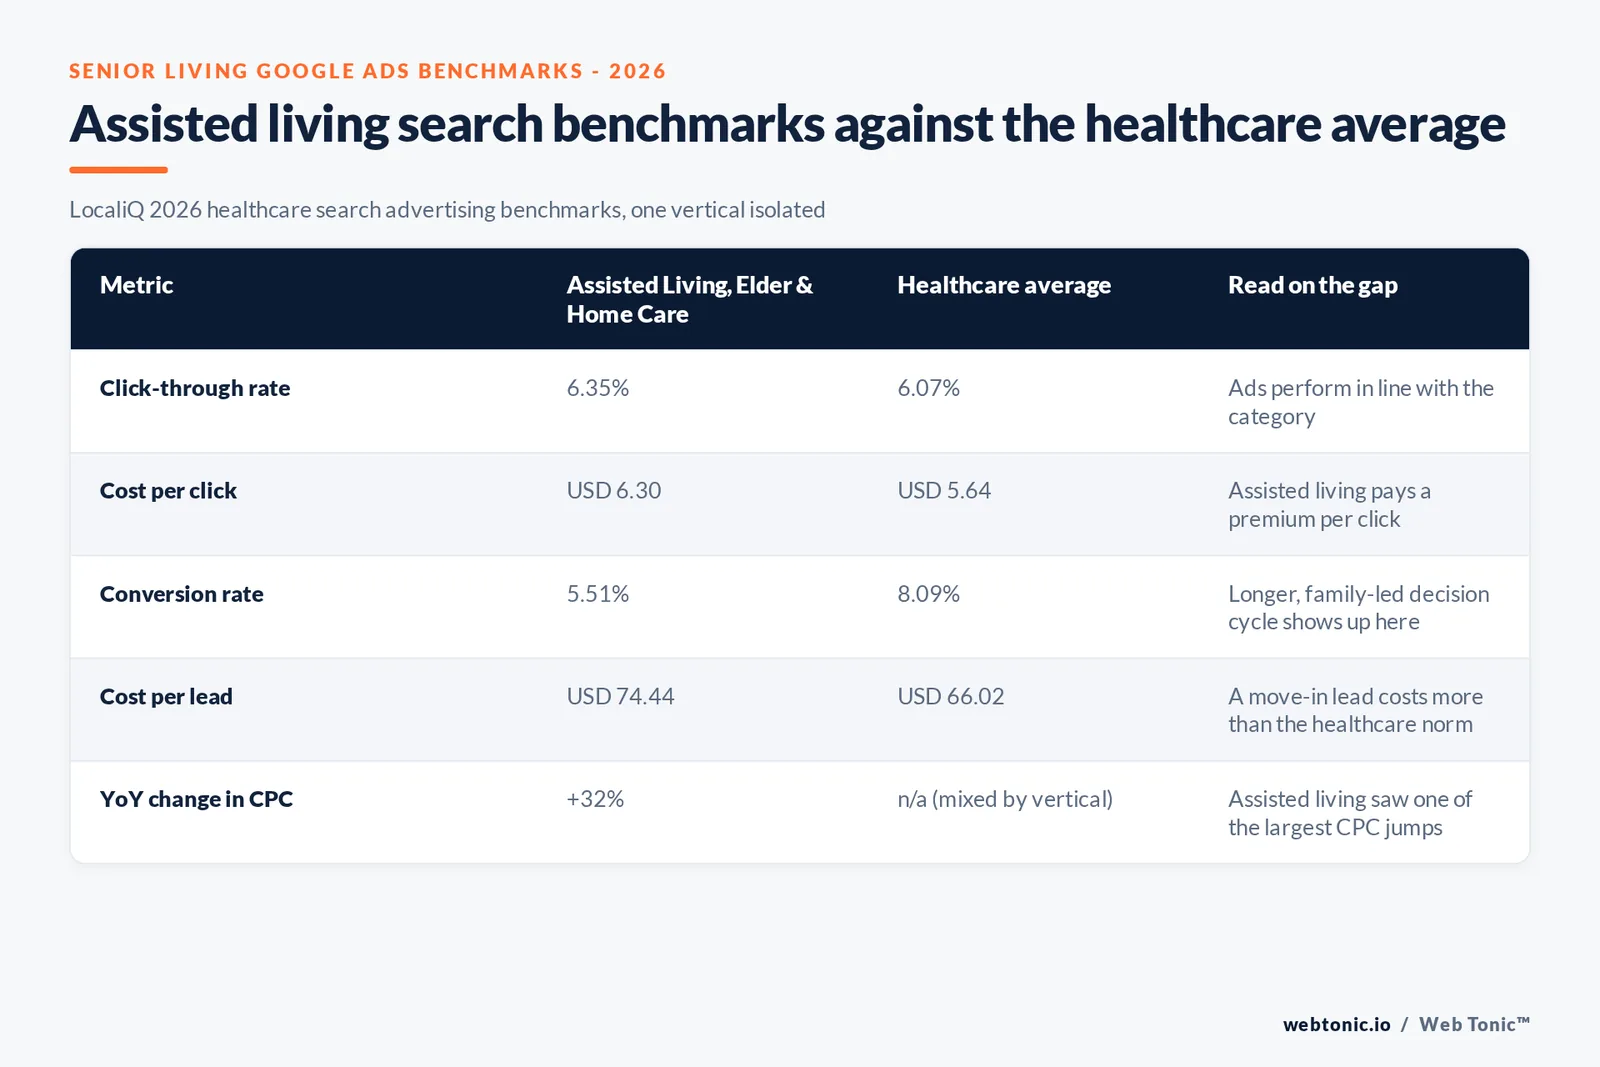
LocaliQ's 2026 healthcare search advertising benchmarks, built from more than 3,500 campaigns across sixteen specialties, list Assisted Living, Elder & Home Care Services as its own category. Against the sixteen-specialty average, the vertical runs a near-identical click-through rate, a moderately higher cost per click, a meaningfully lower conversion rate, and a higher cost per lead - a pattern consistent with a high-consideration, family-led purchase rather than an underperforming account.
| Metric (2026) | Assisted Living, Elder & Home Care | Healthcare average (16 specialties) | Gap |
|---|---|---|---|
| Click-through rate | 6.35% | 6.07% | +0.28 pts |
| Cost per click | USD 6.30 | USD 5.64 | +USD 0.66 |
| Conversion rate | 5.51% | 8.09% | -2.58 pts |
| Cost per lead | USD 74.44 | USD 66.02 | +USD 8.42 |
Why cost per lead runs above the healthcare norm
Two things push the number up. First, competitive density: AHCA/NCAL's Facts & Figures counts roughly 41,465 assisted living communities nationwide competing for local search traffic. Second, decision complexity: A Place for Mom's 2025 caregiver research found the typical searcher is an adult daughter or daughter-in-law researching on behalf of a parent, with 73% of searches starting from a gradual need rather than a single trigger - a longer, multi-stakeholder path to conversion than a same-day-decision category like emergency dentistry, which converts far higher in the same LocaliQ dataset.
| Cost driver | Figure | Source | Effect on CPL |
|---|---|---|---|
| Assisted living communities nationwide | ~41,465 | AHCA/NCAL Facts & Figures, 2025 | Dense local competition for the same keywords |
| Caregiver searches starting from gradual need | 73% | A Place for Mom, 2025 | Longer consideration window before converting |
| Senior housing occupancy, Q2 2026 | 89.9% | NIC MAP, 2026 | Fewer open units to sell against a fixed ad spend |
| Assisted living CPC, year-over-year change | +32% | LocaliQ, 2026 | Rising bid competition compounds the above |
What moved year over year
LocaliQ's 2026 report flags Assisted Living, Elder & Home Care Services among the categories with the largest cost-per-click increases measured, up 32% year over year - second only to Mental Health's 42% jump. LocaliQ attributes rising CPC and softening click-through rate in categories like this one in part to increased competition rather than falling search demand, which lines up with the near-record occupancy data below: demand for senior living is not falling, the paid-search market for it is simply getting more crowded.
| Year-over-year change (2026 vs. prior year) | Figure | Source |
|---|---|---|
| Assisted living CPC | +32% | LocaliQ 2026 healthcare benchmarks |
| Mental Health CPC (largest increase measured) | +42% | LocaliQ 2026 healthcare benchmarks |
| Healthcare-wide CPC | +6% | LocaliQ 2026 healthcare benchmarks |
| Healthcare-wide CTR | -12% | LocaliQ 2026 healthcare benchmarks |
| Healthcare-wide CPL | -6% | LocaliQ 2026 healthcare benchmarks |
The occupancy backdrop campaigns are actually bidding against
NIC MAP's Q2 2026 data put overall senior housing occupancy at 89.9%, the highest level since the end of 2015, with assisted living specifically at 88.4% and independent living at 91.3%. New supply grew under 1% annually for a fifth consecutive quarter. That combination - near-full communities and almost no new inventory - means a well-run assisted living campaign is often bidding for a lead against a genuinely limited number of open beds, not against an elastic supply the way a retail or home-services account would be.
Practically, that argues for pacing budget to actual unit availability by community rather than a flat monthly spend, and for routing leads to a fast human follow-up given how few of them a given community can actually convert into a signed move-in. A campaign built around a fixed monthly budget, rather than one that flexes with each community's open-unit count, risks spending the same amount per lead whether that community has five openings or fifty - which is the opposite of how a scarce, high-value inventory should be marketed.
The demand backdrop behind rising senior living CPCs
Rising bid competition is not happening against flat demand. The U.S. Census Bureau's Vintage 2024 Population Estimates put the population age 65 and older at 61.2 million as of 2024, up 3.1% in a single year and up 13.0% from 2020 to 2024 - far outpacing the 1.4% growth of the working-age population over the same period. Older adults now outnumber children in 11 states, up from just three in 2020. More prospective residents entering the addressable market is consistent with more advertisers bidding for the same local search terms, which is the more likely explanation for rising CPC than declining ad quality.
| Population fact (2024-2025) | Figure | Source |
|---|---|---|
| US population age 65+ | 61.2 million | US Census Bureau, Vintage 2024 estimates |
| Growth of the 65+ population, 2020-2024 | 13.0% | US Census Bureau, Vintage 2024 estimates |
| Growth of working-age population (18-64), same period | 1.4% | US Census Bureau, Vintage 2024 estimates |
| States where older adults outnumber children (2024) | 11, up from 3 in 2020 | US Census Bureau, Vintage 2024 estimates |
Where reviews fit inside a senior living Google Ads account
Seller-review asset eligibility and review-driven trust are not unique to organic search. BrightLocal's 2025 Local Consumer Review Survey found that consumers who trust reviews as much as a personal recommendation fell to 42% in 2025, down from 79% in 2020 - a decline worth pairing with any Google Ads account decision to run review-extension assets, since the format is losing some of the outsized trust premium it once carried. That does not make reviews irrelevant to a paid account; it argues for pairing review assets with clear pricing and care-level information rather than relying on star ratings alone to close a family-led decision.
| Trust signal in paid creative | 2025 figure | Source | Read for Google Ads assets |
|---|---|---|---|
| Consumers trusting reviews as much as personal recs | 42%, down from 79% in 2020 | BrightLocal 2025 | Pair review assets with concrete pricing/care info |
| Facebook CTR, Physicians & Surgeons (general healthcare) | 3.02% | WordStream 2025 | Cross-channel benchmark for paid social awareness spend |
| Facebook CPC, Physicians & Surgeons (general healthcare) | USD 0.82 | WordStream 2025 | Awareness-stage spend is cheaper than search CPL |
What this means for budget and targeting decisions
Given a CPL running 13% above the healthcare average and a conversion rate 2.6 points below it, the arithmetic favors fewer, better-qualified clicks over volume: tighter geographic radius targeting around each community, exclusion of unrelated senior-service search terms, and creative that pre-qualifies on care level and approximate cost before the click rather than after it. Unlike several other healthcare verticals in this benchmark set, senior living is not listed under Google's restricted health-targeting categories, so standard remarketing and customer match audiences remain fully available - a genuine structural advantage over categories like dermatology or plastic surgery, which lose access to advertiser-curated audiences entirely once a page touches an invasive-procedure keyword.
That advantage is worth building a full funnel around: a remarketing list off top-of-funnel searches for "assisted living near me" can carry a family through the weeks-long decision window the caregiver data above describes, rather than relying on a single search session to close. Read our breakdown of what Google Ads actually costs for how that compares across industries, or see how CPL benchmarks stack up more broadly in our cost-per-lead-by-industry data. Talk to us if you want this benchmark run against your own community's numbers.
Frequently Asked Questions
What is a good cost per lead for senior living Google Ads?
LocaliQ's 2026 healthcare search advertising benchmarks put the Assisted Living, Elder & Home Care Services average cost per lead at USD 74.44, against a USD 66.02 average across all sixteen healthcare specialties measured. That premium reflects a high-value, low-frequency conversion - a single move-in lead can be worth thousands of dollars a month in recurring revenue, so a CPL above the healthcare norm is not automatically inefficient.
Why is the assisted living conversion rate lower than the healthcare average?
LocaliQ's 2026 data shows Assisted Living, Elder & Home Care Services converting at 5.51% against an 8.09% average across all measured specialties. The likely reason sits outside the ad account: A Place for Mom's 2025 caregiver research found a family-led, multi-stakeholder decision that most often takes weeks, not a single session, which naturally lowers same-visit conversion rate versus a same-day booking category like emergency dentistry.
Did assisted living Google Ads costs rise or fall in 2026?
They rose. LocaliQ's data shows Assisted Living, Elder & Home Care Services among the categories with the largest year-over-year cost-per-click increase, up 32%, second only to Mental Health's 42% jump. Click-through rate for the category also declined, which LocaliQ attributes in part to rising competitive pressure in the vertical rather than to a demand drop.
Does the 89.9% occupancy figure change how Google Ads should be run?
It changes the target, not the mechanics. NIC MAP's Q2 2026 data put senior housing occupancy at 89.9%, the highest since 2015, with new supply growing under 1% annually. When most communities are close to full, campaigns should be built to capture and convert leads for the specific unit types still open - typically assisted living over independent living, per NIC's occupancy gap - rather than to drive volume against a fixed inventory that may already be sold out.
Should senior living campaigns use Google's standard remarketing audiences?
Largely yes, with more freedom than in cosmetic or many other healthcare categories - senior living and elder care are not listed under Google's invasive-procedure or chronic-condition sensitive categories the way cosmetic surgery or diabetes treatment are. Standard remarketing and customer match remain usable, which is one practical advantage this vertical has over several other healthcare accounts in the same benchmark set.
Sources
LocaliQ - Healthcare search ads benchmarks for 16 specialties, 2026
NIC - Senior Housing Occupancy Climbs in Second Quarter 2026
AHCA/NCAL - Assisted Living Facts & Figures
A Place for Mom - Senior Care Search Trends: Navigating Options in the U.S., 2025
US Census Bureau - Older Adults Outnumber Children in 11 States, Vintage 2024 estimates
BrightLocal - Local Consumer Review Survey 2025
WordStream - Facebook Ads Benchmarks 2025